

Introduction
In the Arctic region of Alaska, diesel fuel is routinely transported from marine ports, on navigable rivers, or from refineries to remote locations including mine sites and communities for power, heating, and transportation. Occasional accidents occur that result in releases of relatively large quantities of product to the environment. One such accident occurred in the summer of 2004 on a remote haul road, resulting in the release of approximately 10 m3 of diesel to surrounding tundra (ADEC 2004). The location of this spill was in northwestern Alaska in Cape Krusenstern National Monument on the haul road for the Red Dog Mine in the western Brooks Range.
The release occurred in a tundra environment characterised as having mild relief and poorly drained soils owing to the underlying permafrost. Considering the tundra classification scheme developed by Walker (Reference Walker1983), we classified the location of the spill as moist tundra. As in any petroleum-release incident, the initial response was to first stop the release and recover as much of the spilled product as practicable while preventing further migration of the released product (ADEC 2004). Spill responders excavated contaminated soil from the impacted area, and the resulting excavation was backfilled with clean coarse-grained soil not native to the spill site (aggregate). Treatment of the contaminated soil took place distant from the spill site. This spill response method is common in temperate regions and suggested for use in tundra environments (Van Deuren and others Reference Van Deuren, Lloyd, Chhetry, Raycharn and Peck2002; Cater Reference Cater2010). While effective in removing the released product from the site, this method may create further disturbances in the Arctic region underlain by permafrost.
In permafrost regions, excavation of petroleum-contaminated soils presents a unique consequence. Removal of the vegetated top soil drastically changes the overall thermal conductivity of the soil, resulting in thawing of underlying permafrost soils (Linell Reference Linell1973). In addition, large quantities of clean native soil for backfilling may not be accessible; hence, the excavated area may be backfilled with the aggregate used to construct roads and foundation pads. Backfilling an excavated zone with soil that has different characteristics than the surrounding native soil will further alter the thermal regime, resulting in a change in the underlying permafrost condition. At the extreme, such measures in the permafrost zone can result in the creation of thermokarsting and mass wasting of thawed soils due to erosion. The objective of this study was to investigate changes to the active layer thickness in the disturbed zone, comparing it with undisturbed ground in proximity to the site of the spill that occurred in Cape Krusenstern National Monument. From these results, we investigate the reduction in thaw depths brought about by adopting the method of applying a relatively thin layer (0.5 m) of native soil to the top of aggregate backfilled excavations.
Background
Upon the accidental release of petroleum, the liquid spreads across the ground surface to some extent and migrates into the subsurface. Since the densities of crude oil and refined petroleum products are less than water and the liquids are immiscible with water, petroleum liquid will not migrate below the water table as it moves through the subsurface. Rather the liquid will occupy pore space along with varying amounts of water and air throughout the unsaturated soil. Petroleum liquid can be found below the water table in cases where the water table has risen and entrapped the petroleum liquid. The individual petroleum hydrocarbons that make up these liquids will solubilise into the groundwater and a dissolved phase plume will develop, flowing downgradient from the area of the release. To limit the extent of the dissolved phase plume, professionals attempt to remove as much of the released petroleum from the area where the spill occurred, commonly referred to as the source zone.
Following the release, petroleum liquid that remains on the ground surface at the source zone is removed by surface pumping. Responders often install adsorbent booms, berms, or trenches downslope of the release to limit the spread of the product. Removal of the petroleum liquid that has migrated downward past the ground surface in the source zone is more challenging. In areas other than the Arctic, professionals use several different methods to recover petroleum liquids from the subsurface. Pumping the liquids is one of the more popular methods. However, the immiscibility of petroleum liquids requires a duel pumping strategy, where one pump creates a drawdown of the groundwater and another pump removes the petroleum liquid that resides above the water contained in the extraction well. Given the presence of both petroleum liquid and water in the pore space, recovery rates diminish with time, leading to the necessity of operating these systems for long periods. Even with a well-designed recovery system and considerable effort, hydraulic recovery systems are ineffective, and by some estimates, pumping recovers only about 60% of the released petroleum liquid under the best of conditions (Huntley and Beckett Reference Huntley and Beckett2002; Beckett and Lundegard Reference Beckett and Lundegard1997).
Excavation of soil in the source zone that contains released petroleum liquid and its off-site treatment is a common practice for releases that are small in volume, that is, less than approximately 760 m3 (U.S. EPA, 1993). There are several advantages to using this method to clean up the source zone. The main advantage is that the method is easy and quickly removes released petroleum from the source before any substantial dissolved phase plume can develop. Yet the method has limitations, one of which is expence, which includes costs for soil excavation, transportation to a soil-treatment system, and soil treatment. Another limitation is the depths that excavation equipment can achieve.
The logistics of responding to contaminant releases in Arctic tundra can be challenging, as can developing strategies to reduce the impact. Because of the presence of seasonal suprapermafrost groundwater tables, sensitive thermal regimes, and in some areas, soils with low hydraulic conductivity, each of the petroleum removal techniques just described may be difficult to implement and remove petroleum from the subsurface with varying success. Hence, several petroleum recovery strategies for the Arctic region have been devised that takes advantage of the presence of either frozen active layers or permafrost (Cater Reference Cater2010).
Historically, a majority of spills on tundra in the Alaska Arctic occur during periods of snow cover (Conn and others Reference Conn, Behr-Andres, Wiegers, Meggert and Glover2001). Petroleum recovery techniques under these conditions are typically less cumbersome than when a release occurs on thawed soil. Under frozen conditions, ice present in the soil pore space inhibits the downward movement of petroleum, resulting in the spread of released petroleum across the ground surface (Barnes and Wolfe Reference Barnes and Wolfe2008; Barnes and Chuviline Reference Barnes, Chuviline and Margesin2008; Barnes and Biggar Reference Barnes, Biggar, Filler, Snape and Barnes2008). Recovery of the released petroleum under these conditions is relatively straightforward in comparison with releases that occur on thawed soils. Cater (Reference Cater2010) discusses the recommended techniques for restricting movement of petroleum past the spill zone and for recovering petroleum when the soil is frozen and snow is present.
In many cases, permafrost acts as a barrier to released petroleum from spills that occur during the time of year that the soil in the active layer is thawing. In areas of moist and wet tundra, the presence of a seasonal water table in the active layer (suprapermafrost groundwater) inhibits the downward migration of petroleum. However, some level of petroleum saturation most likely exists down to the permafrost table. This distribution is a result of the shallow nature of suprapermafrost groundwater, which results in petroleum liquid being present throughout the active layer (Barnes and Chuviline Reference Barnes, Chuviline and Margesin2008). In order for the permafrost table to act as in impedance to downward migration of petroleum in areas of dry tundra, an ice-rich permafrost table zone needs to be present.
The main goals of a response to petroleum releases on tundra are to recover as much petroleum as possible, limit the amount of petroleum that migrates to the root zone in the soil, and limit damage to tundra as much as possible. Cater (Reference Cater2010) discusses many techniques for recovering petroleum from ice- and snow-free ground surfaces, which includes petroleum contained within the vegetative cover. Techniques include skimmers, which pump petroleum from the ground surface, flooding and flushing, which takes advantage of petroleum's buoyancy, and trimming, which cuts off petroleum-impacted vegetation. Once petroleum has migrated downward below the ground surface at a level that becomes toxic to plants, recovery is limited to soil excavation for off-site disposal. As in more-temperate regions, the excavation is backfilled with clean soil. However, unlike temperate regions, the stability of the backfilled area may be an issue. Removal of the vegetative cover, which is good thermal insulation, and backfilling the excavation with aggregate, which has relatively greater thermal conductivity than the native soil, change the annual depth of thaw. If the site is underlain by ice-rich permafrost, increases in thaw depth that exceed the lower boundary of the excavation may result in thawing of these ice features, causing thaw subsidence, thermokarsting, and mass wasting of soil under the appropriate conditions.
Methodology
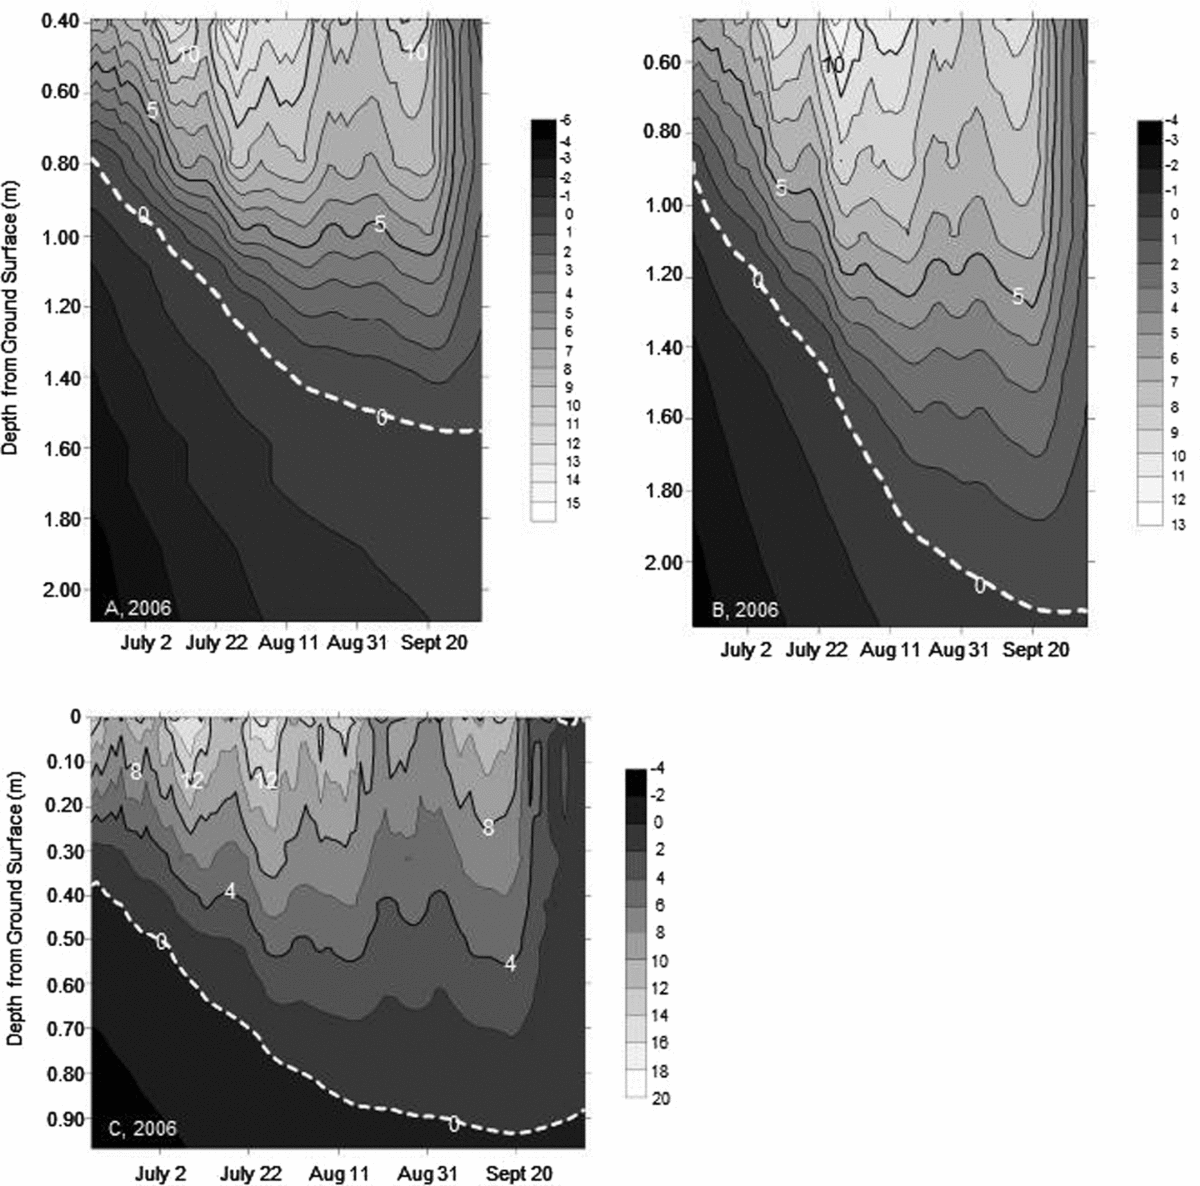
At the study site in the season following the release of diesel, we installed three sets of soil temperature sensors with recording data loggers (thermistor strings). Two of them were located inside the spill zone: one closer to where the tanker truck ended up on its side (denoted as thermistor string A), and one downgradient from this area (denoted as thermistor string B). We installed the third string outside the impacted zone in the native soils to measure the background soil temperatures (denoted as thermistor string C). The depths of thermistors at location A were as follows: 0.50, 0.90, 1.10, 1.20, 1.30, 1.40, 1.50, 1.60, 1.70, 1.80, 2.00, and 2.20 m. At location B, the thermistors depths were as follows: 0.60, 1.00, 1.20, 1.30, 1.40, 1.50, 1.60, 1.70, 1.80, 1.90, 2.10, and 2.30 cm. At location C, the depths were, 0.01, 0.40, 0.50, 0.60, 0.70, 0.80, 0.90, and 1.05 cm. All three thermistor strings frost-heaved out of the ground to a certain extent each year of our study. The thaw depths at each point are adjusted to reflect this heave. We programmed the data loggers to record temperatures every 12 hours, with a monitoring period from early June to early October in 2006 and 2007. During our October visits, we measured the active layer depth as the depth to further penetration (depth to refusal) with a utility probe (permafrost probe) at numerous locations in the native soils outside of the impacted area. We assumed that the depth of refusal was the depth to frozen ground on the day we took the measurement. We were then able to compare the average value of these measurements with the estimated depth to frozen ground determined with the data collected from thermistor string C.
Results and discussion
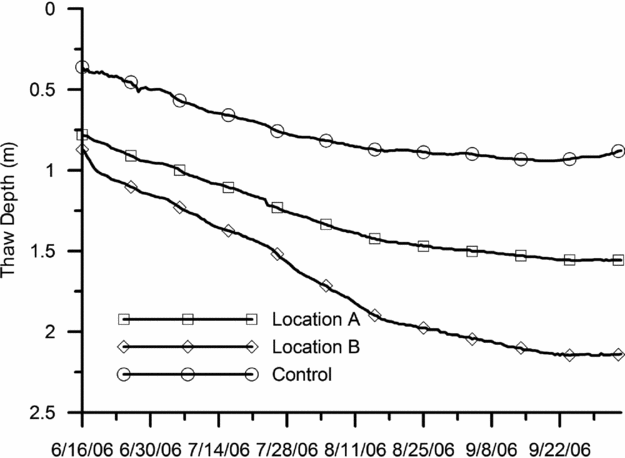
Interpolated isotherms over the 2006 monitoring period, 16 June to 5 October, for the impacted zone and the undisturbed soil are shown in Fig. 1. A comparison of the thaw depths for the three locations is shown in Fig. 2. For location A, we measured a maximum thaw depth of 1.56 m on 2 October. Thaw depths were estimated by linear interpolation between thermistors at known depths. The thermistor string at location B detected a deeper thaw depth of 2.15 m, which occurred on 29 September. After closer examination of the zero isotherm line for thermistor string B, we found that a relatively greater thermally conductive soil underlies the top 1.5 m of soil. The more conductive soil probably led to the comparatively greater maximum thaw depth reached near location B. The maximum thaw depth measured in the undisturbed soils (location C) was 0.94 m, which occurred on 18 September. The maximum thaw depth measured at location B is 228% greater than at the control location C.
Soil temperatures in degrees Celsius during the thawing season 2006 at the two locations within the backfill soil (location A and B) and in the control soil (location C).

Thaw depths in 2006 at the two locations within the backfill soil (location A and B) and in the control soil (location C).
Comparing the thaw depth measured in the undisturbed soil on 5 October 2006, with the thermistor string to the depth of the active layer measured with the permafrost probe, we find a difference in depths. 19 measurements of the depth to refusal in the undisturbed soil resulted in an average depth of 0.63 m, which is 0.25 m less than the thaw depth of 0.88 m estimated from thermistor string C for the same day. The difference is probably due to the change in ground cover that occurred during installation in the area around thermistor string C. While we took care to limit the disturbance, what little disturbance that did occur had an impact on the thaw depth.
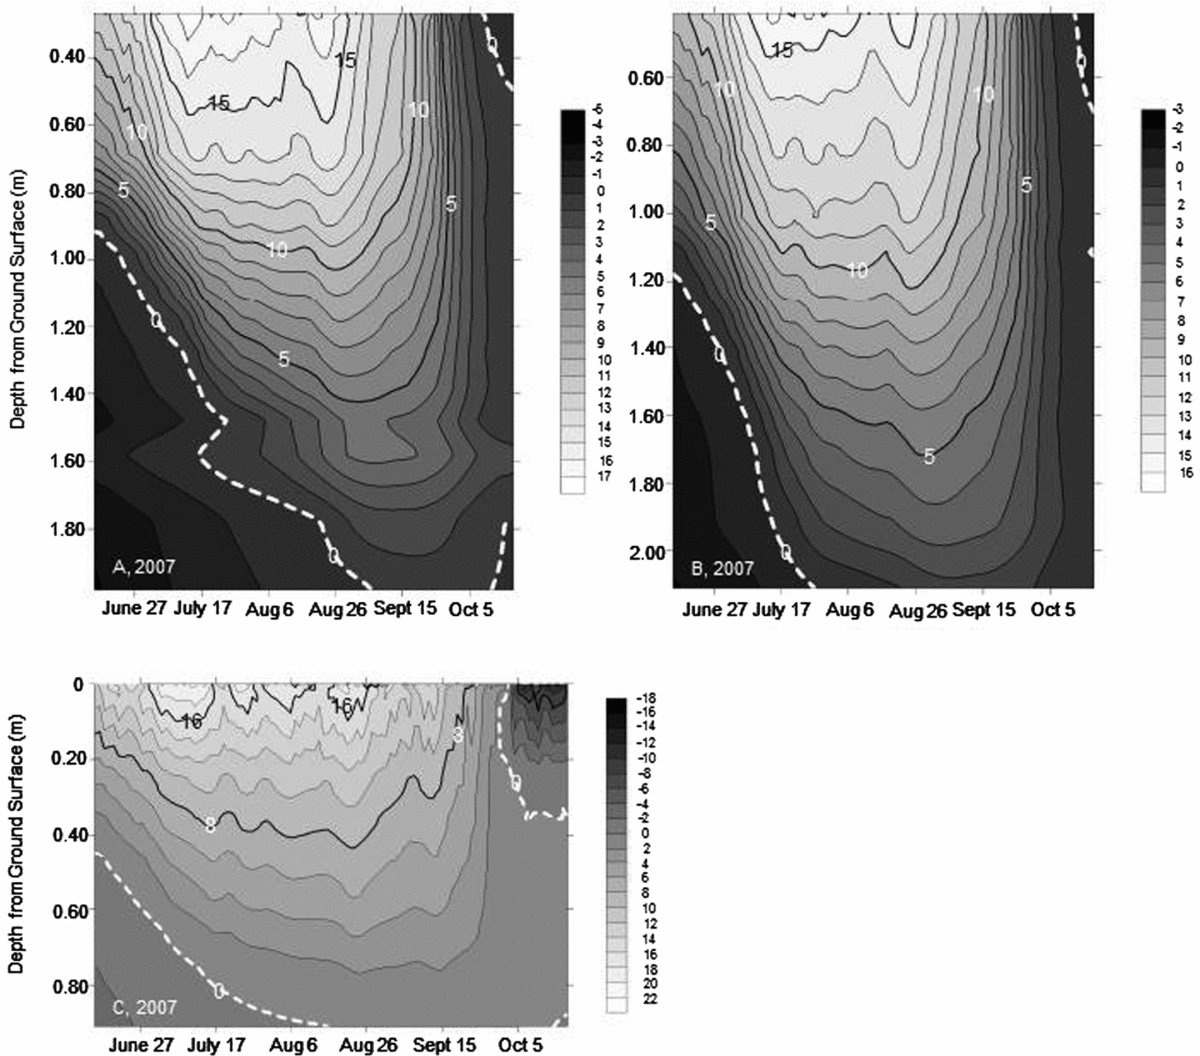
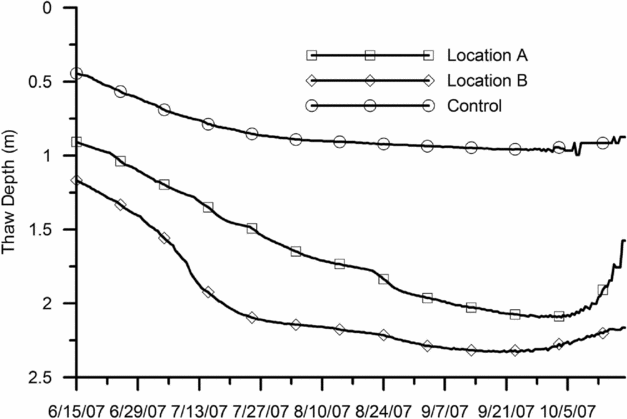
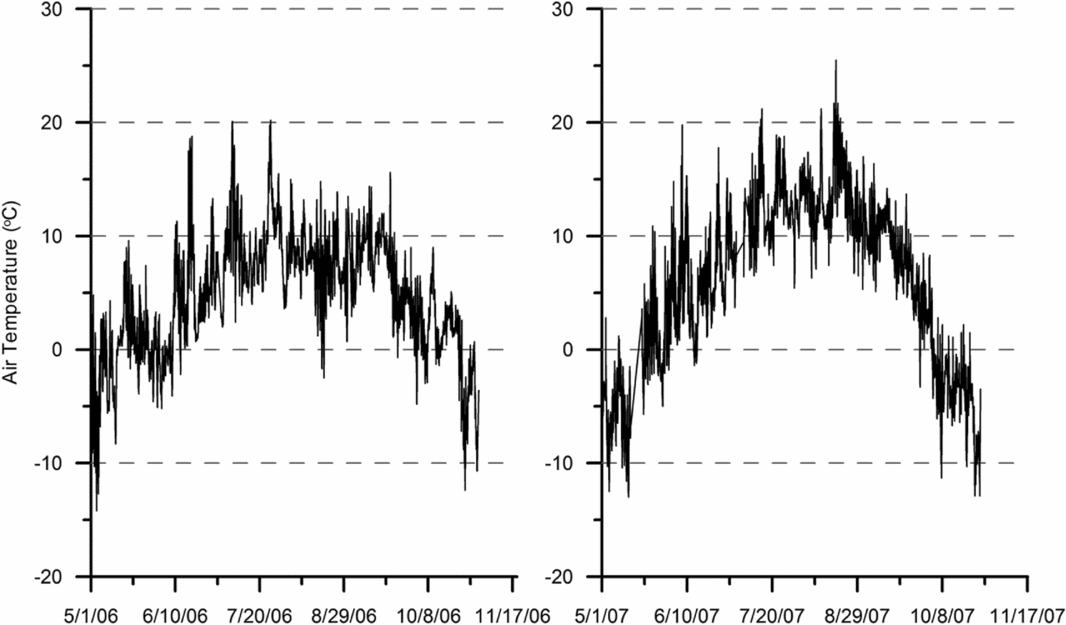
Temperature measurements from both location A and B at the start of the 2007 monitoring season showed that the active layer had completely frozen during the winter season. Thaw depths for the 2007 monitoring period are shown in Fig. 3, and a comparison of those depths is shown in Fig. 4. The first notable result is that the thaw depths achieved in 2007 were comparably greater than in 2006. The thawing index we calculated for 2006 was 900°C.days as compared with 1130°C.days in 2007. To calculate these thawing indices, we used air temperature data obtained from the closest meteorological station to the site: a National Oceanic and Atmospheric Agency buoy station located at the Red Dog Harbor dock (station RDDA2), approximately seven miles (11 km) from the study site. Though the air temperature data are from an offshore buoy, the resulting relative difference in the thawing indices indicates that the 2007 season was relatively warmer. The maximum thaw depth reached at location A was 2.09 m on 3 October; the maximum thaw depth reached at location B was 2.33 m on 23 September. In the native soils, a maximum thaw depth of 0.99 m was reached on 7 October. The maximum thaw depth reached at location B is 235% greater than the maximum thaw depth reached at the control location.
Soil temperatures in degrees Celsius during the thawing season 2007 at the two locations within the backfill soil (location A and B) and in the control soil (location C).
Thaw depths in 2007 at the two locations within the backfill soil (location A and B) and in the control soil (location C).
As in 2006, a change in the rate of thaw occurs at location B once the thawing depth reaches approximately 1.5 m, indicating that there is most likely a change to a more thermally conductive backfill material at this depth. In 2007 at location B, a decrease in the rate of thaw occurs once the thawing depth reaches approximately 2.2 m, which was not apparent in 2006 given that the thaw depth did not reach past 2.15 m. This change in thaw rate once again indicates a possible change in the thermal conductivity of the material at this depth, albeit a relatively lower thermal conductivity. This depth may represent the lower extent of excavation in this location; it may also represent that the thawing depth has reached native soils. A change in water content can result in a change in thaw rate; consequently, the change in thaw rate could indicate that thaw depth has reached the suprapermafrost groundwater table.
As expected, thaw depths in the impacted area for both monitored seasons exceed the thaw depth measured in the native soils. These greater thaw depths in the impacted area may lead to challenges if ground ice is present and if the thawing depth exceeds the lower extent of the excavated soil, as discussed earlier. One option would be to over-excavate in locations suspected of containing ground ice to assure that the thaw depth does not exceed the lower boundary of the backfilled soils. However, the additional excavated soil may be considered contaminated, requiring expensive treatment. Applying a top layer of native soil overlying the coarser backfill material may be an alternative solution. We can use our monitoring results to investigate this possibility further.
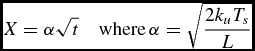
Nixon and McRoberts (Reference Nixon and McRoberts1973) discuss a simplified solution to the movement of the thaw front in a homogeneous soil subjected to a step increase in surface temperature:
 \begin{equation}
X = \alpha \sqrt t \quad {\rm where}\,\alpha = \sqrt {\frac{{2k_u T_s }}{L}}\end{equation}
In equation (1), X is thaw depth, α is a constant, k u is the unfrozen thermal conductivity, T s is an average surface temperature during thawing, t is time since thawing of the soil began, and L is volumetric latent heat of soil.
 \begin{equation}
L = \gamma _d \omega (1 - W_u )L'\end{equation}
In equation (2), γd is the dry density of the soil, ω is soil moisture content on a mass basis, W u is the unfrozen water content, and L′ is the volumetric latent heat of water. Two assumptions are made to derive this solution: the temperature of the frozen ground is close to the melting temperature, and a linear temperature distribution exists in the thawed zone. The conditions at the study site approach these assumptions hence, we can use this simplified solution to illustrate the impact of adding a layer of native soil to the top of the backfilled soil on the thaw depth.
Extending the above solution to a layered soil that has two layers results in the following equation for thaw depth (Nixon and McRoberts Reference Nixon and McRoberts1973):
 \begin{equation}
X = \sqrt {\left( {\frac{{k_2 }}{{k_1 }}H} \right)^2 + \frac{{2k_2 T_s (t - t_o )}}{{L_2 }}} - \left( {\frac{{k_2 }}{{k_1 }} - 1} \right)H\end{equation}
In equation (3), k 1 and k 2 equal the unfrozen thermal conductivity of the top layer and bottom layer, respectively, H is the thickness of the top layer, L 2 is volumetric latent heat of the lower soil layer, and t o is the time for the thaw depth to reach the interface between the two layers.
 \begin{equation}
t_o = \frac{{H^2 L_1 }}{{2k_1 T_s }}\end{equation}
In equation (4), L 1 is volumetric latent heat of the upper soil layer. For this study, the two layers are an upper layer of native soil overlying a layer of coarse backfill.
With these equations, we can determine what the thaw depth would have been if a layer of native soil had been applied over the top of the coarse backfill soil. We first need to determine the unfrozen thermal conductivity of each soil, which can be determined via linear regression of X versus t 1/2 in equation (1). Since temperatures were not recorded at the beginning of the thaw, we need to estimate the date that the thawing front begins progressing downward from the surface. This estimate can be made by determining the initial date of thaw that provides the best-fit line to X versus t 1/2. The resulting slope determined from linear regression corresponds to α in equation (1); hence, an estimate of T s and L are required to determine k u.
Knowing the air thawing index (I a), which is estimated with data from the meteorological station located at the Red Dog Harbor buoy (discussed previously), and the assumed n factor values for both the backfill material and the undisturbed soil, we can estimate the surface temperature for each location and season. Lunardini (Reference Lunardini1981) provides typical n factor values, which he describes as transfer functions between air and ground surface temperatures (Lunardini Reference Lunardini1978). From this listing, reasonable values for both the backfill material and the undisturbed soil are 1.3 and 1.0, respectively.
Estimation of the volumetric latent heat of each soil requires the total water content and the unfrozen water content. A reasonable estimation is to assume that the soils are nearly saturated as the thawing front progresses. Rawls and others (Reference Rawls, Brakensiek and Saxton1982) provide estimation of soil-water properties for a range of different soils. Reasonable estimates for saturated volumetric water content from this reference for the backfill soil (coarse-grained soil) and the undisturbed soil (silt loam) are 0.40 and 0.45, respectively.
Because of possible change in backfill properties at a depth of approximately 1.5 m in the area associated with monitoring location B, only the first 65 days, when the thawing front appears to be in the uppermost backfill material, were used to determine the thermal conductivity in this area (refer to Fig. 1). The values shown in Table 1 are the estimated values (estimated using the method described above) for each location during each season and the parameters used for the calculation. The resulting correlation coefficient from the determination of α is also provided in Table 1.
Estimation of unfrozen thermal conductivity for each study site location
To determine the accuracy of the date of initial thaw, we can compare the estimated values shown in Table 1 with the air temperatures measured at the Red Dog Harbor buoy, shown in Fig. 5. During both years, the estimated initial thaw dates correspond to roughly the same date the temperatures at the Red Dog Harbor rose above 0°C. However, due to melting of the snowpack, one would expect the temperatures in the soil to stay below freezing for a period corresponding to the time required to melt the snowpack. Hence, the values for α and, thus, unfrozen thermal conductivities for both seasons may be slightly underestimated.
Air temperatures measured at the Red Dog Harbor dock buoy station RDDA2.
Measurements taken by Cote and Konrad (Reference Cote and Konrad2005) show that the range of unfrozen thermal conductivity for base course materials (aggregate) used in construction of roadways is between approximately 0.7 and 3.5 W/m°C. The thermal conductivity values for location A, shown in Table 1, compare favorably with values measured by Cote and Konrad (Reference Cote and Konrad2005) for aggregate predominately comprising quartz. Ayuso and others (Reference Ayuso, Kelley, Leach, Young, Slack, Wandless, Lyon and Dillingham2004) discuss the presence of quartz in rock found in the western Brooks Range, which corresponds to the results measured at location A. Thermal conductivity at location B is relatively high and does not compare well with any of the materials tested by these authors. Most likely the lack of a good comparison is due to the relatively shallow depth of thaw used for the calculation, compared with location A. Given the more favorable comparison between the thermal conductivity estimated at location A and measurements made by others in aggregates, we use an unfrozen thermal conductivity value of 2.4 watts/m°C for the remainder of the analysis.
Hinzman and others (Reference Hinzman, Kane, Gieck and Everett1991) measured in the laboratory an unfrozen thermal conductivity for active layer soils composed of mostly sandy loam of approximately 1 W/m°C. The value measured in native soils at location C is slightly greater in comparison with these values measured by others, but is still within a reasonable value for fine-grained soil.
We can now use the estimated values for thermal conductivity along with equations (2) and (3) to investigate how much the overall depth of thaw would change if a layer of native soil is applied over the backfill aggregate material. First, we must choose a depth for the native soil cover layer. A reasonable assumption of depth is the average rooting depth of arctic flora. Considering the resulting decrease in overall thermal conductivity of the surface cover over time due to revegetation, it seems reasonable to choose this value for the depth of the native soil cover layer. Canadell and others (Reference Canadell, Jackson, Ehleringer, Mooney, Sala and Schulze1996) report an average rooting depth for Arctic tundra plants of approximately 0.5 m, which is the depth that is selected for this analysis.
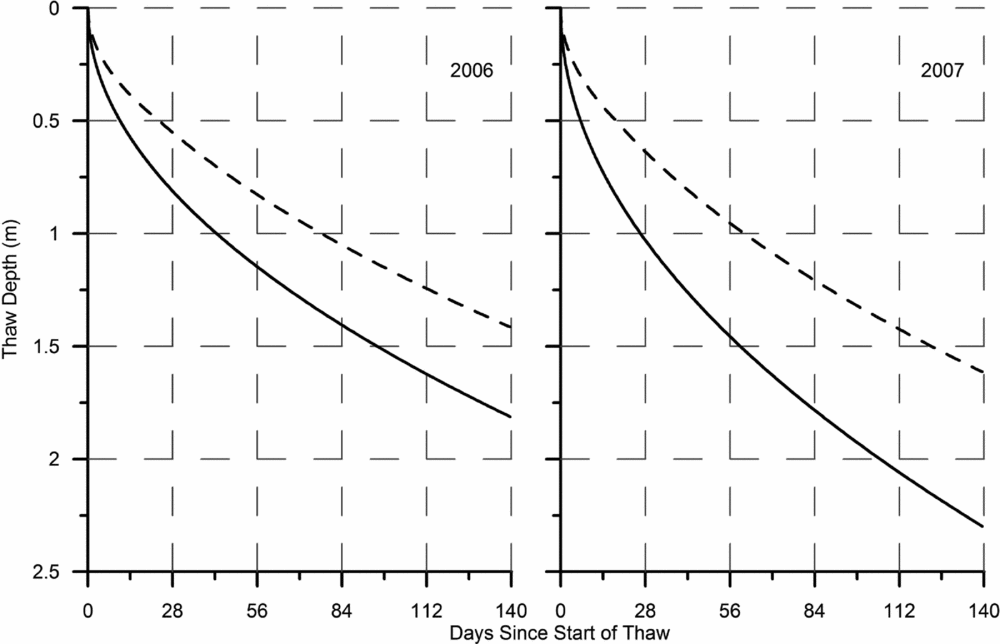
The progression of thaw depths in backfilled aggregate with and without native soil cover (unvegetated) during both summer seasons is shown in Fig. 6. For these calculations we used the same soil properties as were used to determine the unfrozen thermal conductivity of each soil as well as the unfrozen thermal conductivity for the aggregate determined at location A and for the native unvegetated soil, as shown in Table 1. The surface temperature for both seasons is the estimated surface temperatures corresponding to the native soils (location C) shown in Table 1. The decrease in thaw depth brought about by adding a cover layer of native soil is shown in Fig. 6. The difference between thaw depth with and without a cover layer is greatest in 2007, which is mostly due to the greater difference between the average surface temperatures estimated for the backfill soils and the native soils as compared with 2006. Surface temperatures increased due to the relatively warmer season in 2007, though the increase at location C was not as large as the increase at location B.
Thaw depths in a layered soil (solid line) consisting of 0.5 m of fine-grained soil overlying aggregate and in a homogeneous soil comprising just aggregate (dashed line) for the conditions measured at location A in 2006 and 2007.
It is useful to investigate the maximum thaw depth in more general terms. For this, consider a contaminated site located in the continuous permafrost zone that has been excavated and partially backfilled with aggregate. One-half meter of native fine-grained soil is added to bring the backfilled excavation to grade. We again start with equations (1) and (2) and develop a general solution and associated set of curves that can be used to obtain an estimate of the maximum thaw depth that is possible in this layered soil under the range of typical conditions, such that we can examine the characteristics of the solution. If we define k r equal to k bf/k n, k n.T s equal to κ with units of watt/m, and combine equations (2) and (3) above, then the following equation for the maximum thaw depth X max results:
 \begin{equation}
X_{max} = \sqrt {k_r^2 H^2 + \frac{{2k_r \kappa }}{{L_{bf} }}\left( {t_{max} - \frac{{H^2 L_n }}{{2\kappa }}} \right)} - \left( {k_r - 1} \right)H\end{equation}
In the above equation, L bf is the volumetric latent heat of the coarse-grained backfill soil, and L n is the volumetric latent heat for the native soil. The maximum length of time between the beginning of thaw and the maximum thaw depth measured in this study was estimated to be 132 days. Taking a conservative approach, if we estimate the maximum time of thaw that can be measured at any one site at 140 days, we can consider this value to be t max in the above equation. For this general solution, the depth of the native soil cover layer, H, is equal to 0.5 m to accommodate the average root depth of native plants as before. Latent heat of each soil is assumed to correspond to saturated soils with porosities equal to 0.45 and 0.40 for the fine-grained native soil cover and the aggregate, respectively. For this analysis, a range of reasonable surface temperatures is required.
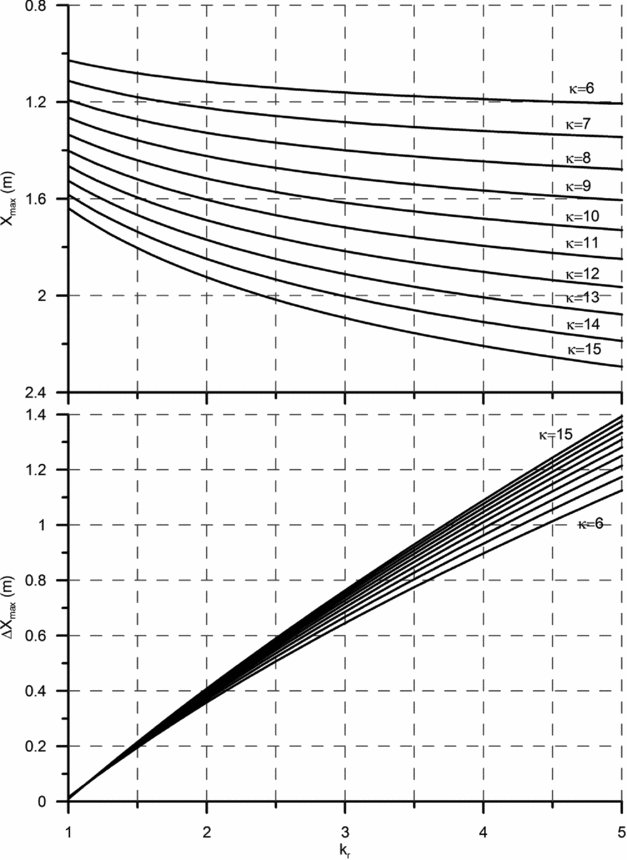
Wang and Key (Reference Wang and Key2003) report Arctic surface temperatures from 1982 to 1999. The maximum surface temperature in Arctic tundra for the months of June to August during this time span was approximately 10°C. Assuming a maximum k u value for unfrozen fine-grained soil without a plant cover is 1.5 watt/m°C, the maximum value for κ equals 15 watt/m. Similarly, the minimum Arctic tundra surface temperature for the months of June through August reported in Wang and Key (Reference Wang and Key2003) is approximately 7°C. Considering a reasonable minimum value for k u in fine-grained saturated soils is equal to approximately 0.9 watt/m°C, a minimum value for κ of approximately 6 watt/m results. The resulting family of curves for maximum thaw depth as a function of k r is shown in Fig. 7 for a reasonable range of unfrozen thermal conductivities and surface temperatures.
Maximum thaw depths (top graph) in a layered soil consisting of 0.5 m of fine-grained soil overlying aggregate and the difference between the maximum thaw depth in the layered soil and in a homogeneous soil consisting just of aggregate (bottom graph). Both X max and ΔX max are a function of the ratio in the unfrozen thermal conductivity of aggregate to fine-grained soils, k r and a function of the product of the unfrozen thermal conductivity of the fine-grained soil and the average surface temperature (κ).
The reasonable range in unfrozen thermal conductivities and average surface temperatures shown in Fig. 7 indicate that possible thaw depths in aggregate overlaid by 0.5 m of fine-grained soil vary between approximately 1.2 m and 2.3 m. Further, the greatest possible difference between the maximum thaw depth reached in soil layered in this manner and an aggregate that is not overlaid with a layer of fine-grained soil ranges between approximately 1.1 m and 1.4 m. Hence, the application of a 0.5 m layer of fine-grained soil over aggregate reduces the maximum depth of thaw by at least 1.1 m and no more than 1.4 m.
The establishment of native vegetation will further reduce the maximum thaw depth over time owing to the natural insulating qualities of arctic tundra vegetation. Placement of a 0.5 m cover of native soil aids in establishing vegetation and associated soil fauna as well as a more complete recovery of the overall ecosystem in the area of the spill. However, establishment of vegetation at a density that will reduce thaw depths takes many years. Chapin and Chapin (Reference Chapin and Chapin1980) present results from a long-term field study on native tundra vegetation recovery in the Arctic. These authors found that the complete re-establishment of native arctic tundra vegetation on a study site previously denuded of vegetation took five years. Hence, in sensitive areas, thaw subsidence could occur prior to any aid the vegetation would bring to minimising thaw depths.
Knowing the type of aggregate planned for use as backfill, we can use this figure to estimate maximum thaw depth and the extent of decrease in thaw depth in comparison with not applying a cover layer of fine-grained soil for different conditions. Consider an aggregate backfill material composed of gabbro. Cote and Konrad (Reference Cote and Konrad2005) measured unfrozen thermal conductivity at a water content of 8% by weight equal to approximately 1.5 watt/m°C. If we consider that the minimum value for the unfrozen thermal conductivity of a fine-grained soil is 0.9 watt/m°C, as Hinzman and others (Reference Hinzman, Kane, Gieck and Everett1991) measured, then the ratio of these two thermal conductivities, k r, is 1.7. Referring to the surface temperature of 7.9°C estimated in the fine-grained native soils at the study site (location C) during the 2007 season, a value for κ equal to 7.1 watt/m results. Under these conditions, according to Fig. 7, the maximum thaw depth would be approximately 1.2 m. If a 0.5 m layer of fine-grained soil is not placed over the coarse-grained backfill soil under these conditions, the maximum thaw depth will be approximately 1.5 m, or a difference of 0.3 m. We can compare these values with the maximum thaw depths that would be expected if the aggregate material was quartzite as opposed to gabbro.
Cote and Konrad (Reference Cote and Konrad2005) measured an unfrozen thermal conductivity equal to approximately 3.5 watt/m°C for quartzite at a relatively high moisture content of 5.5%. Using the same unfrozen thermal conductivity for the native fine-grained cover soil (0.9 watt/m°C), the ratio of unfrozen thermal conductivities is equal to 3.9, and the estimated maximum thaw depth in the layered soil is 1.3 m. For backfill with no surface cover, the maximum thaw depth would be 2.2 m, a difference of 0.9 m. In comparing these two examples, as expected, the greatest impact to decreasing the maximum thaw depth is realized when the difference between the thermal conductivities of the aggregate and the fine-grained soil is relatively large, as illustrated in Fig. 7.
Knowing the approximate unfrozen thermal conductivity of the available aggregate material and fine-grained soil, estimates can be made as to the benefit of going to the effort of applying a surface cover layer. The unfrozen thermal conductivity of aggregate can be estimated by knowing the type of rock that the aggregate material is coming from and using literature values for thermal conductivity.
Conclusions
Though care is taken in the handling and storage of petroleum products, accidents occur. When petroleum releases occur in the Arctic region, excavation of the contaminated soil and off-site treatment is a viable, and sometimes the only, cleanup method available. However, availability of backfill material often hinders this activity. As was the case at the site of this study, large quantities of native soils may not be available for backfilling. In such conditions, the only available soil may be aggregate used for road and foundation pad construction. If a spill has taken place in fine-grained soils, which are ubiquitous in the Arctic region, coarse-grained aggregates will have greater thermal conductivity than the native soils. Hence, when responders are developing the necessary plans for a response to such a spill, they must pay attention to the resulting greater depth of thaw in ice-rich permafrost soils. Such an increase in thaw depth under conditions conducive to thermokarsting could result in site instability.
In this study, we measured the depth of thaw during two seasons at a site underlain by permafrost that experienced an accidental release of diesel. The contaminated soil was excavated, and an aggregate was used to backfill the excavation. Soil temperature measurements over two seasons indicated that the maximum thaw depth reached in the backfilled area was as much as 235% greater than the thaw depth measured at the control location. Most likely, this difference is greater due to disturbance at the control location where the thermistor string was placed, resulting in increased thaw depth in comparison with thaw depth in the undisturbed tundra.
One possible remedy to this situation is to apply a cover of native soils over the aggregate backfill. A depth of 0.5 m, which is the rooting depth of native Arctic tundra vegetation, is recommended. Such a remedy still requires a source of native soils, albeit a smaller one. Using the analytical solution for thaw depth in a layered soil presented in Nixon and McRoberts (Reference Nixon and McRoberts1973), we show how applying a native soil cover layer decreases the thaw depth. Such a cover is required most when the underlying permafrost is ice-rich, the depth of the excavation is less than the maximum thaw depth without the cover soil, and the aggregate backfill is composed of material with relatively high unfrozen thermal conductivity. These combined conditions result in a relatively deep thaw depth and possible thermokarsting.
The rate of ecosystem recovery following a contaminant release and subsequent remedial action should also be a consideration that is included in response decision making. Addition of a native soil cover to the top of the aggregate backfill may enhance the recovery rate. Moreover, the establishment of native vegetation in the impacted area may further decrease the thaw depth reducing the impact of the remedial action. However, the establishment of a sufficient vegetation cover may take many years. This topic warrants further study.
Acknowledgements
The United States National Park Service funded this study (Study number CAKR-00005). I would like to thank Dr. Diane Sanzone (formally with the U.S. National Park Service) and the Teck Cominco staff at the Red Dog Mine for their assistance.