Although depression risk is undoubtedly multifaceted, genetic variation likely helps explain why some youth succumb to negative affective outcomes following stressful experiences whereas others are resilient. However, efforts to better understand how specific genes interact with environmental risk to predict depression have been constrained by power concerns. We examined stress-system genetic risk as a moderator of the link between multiple forms of environmental stress and depressive symptoms among adolescents. In doing so, we sought to demonstrate whether gene–environment interactions (G×Es) can robustly predict psychopathology by optimizing measurement of both genetic risk (assessing multilocus genetic variation) and environmental risk (using gold-standard interviews).
G×E research on depression
The largest body of research on G×E effects in depression focuses on a polymorphism in the promoter region of the serotonin transporter gene (5-HTTLPR). Evidence suggests that short 5-HTTLPR allele carriers may be more vulnerable to depression following stress exposure, although results vary considerably across studies and even meta-analyses (Culverhouse et al., Reference Culverhouse, Saccone, Horton, Ma, Anstey, Banaschewski and Bierut2017; Karg, Burmeister, Shedden, & Sen, Reference Karg, Burmeister, Shedden and Sen2011; Munafò et al., Reference Munafò, Freimer, Ng, Ophoff, Veijola, Miettunen and Flint2009; Risch et al., Reference Risch, Herrell, Lehner, Liang, Eaves, Hoh and Merikangas2009). More recently, researchers have explored G×Es involving genetic variants linked to functioning in other biological systems associated with depression etiology. The hypothalamic-pituitary-adrenal (HPA) axis is one of the primary stress-responsive physiological systems, and abnormalities in its functioning closely relate to psychiatric disorders, including depression (Chida & Steptoe, Reference Chida and Steptoe2009; Pariante & Lightman, Reference Pariante and Lightman2008). Genetic variants linked to HPA axis functioning therefore may modify associations between stressful experiences and depressive outcomes. Supporting this notion, studies suggest several HPA-axis–linked genes moderate the effect of stress on depression, including mineralocorticoid receptor genes (NR3C2) (Vinkers et al., Reference Vinkers, Joëls, Milaneschi, Gerritsen, Kahn, Penninx and Boks2015), corticotrophin-releasing-hormone receptor genes (CRHR1) (Bradley et al., Reference Bradley, Binder, Epstein, Tang, Nair, Liu and Newport2008; Liu et al., Reference Liu, Liu, Yao, Yang, Xiao, Wan and Xiao2013; Polanczyk et al., Reference Polanczyk, Caspi, Williams, Price, Danese, Sugden and Moffit2009; Starr, Hammen, Conway, Raposa, & Brennan, Reference Starr, Hammen, Conway, Raposa and Brennan2014), and FK506-binding protein 5 (FKBP5) (Appel et al., Reference Appel, Schwahn, Mahler, Schulz, Spitzer, Fenske and Grabe2011; Zimmermann et al., Reference Zimmermann, Brückl, Nocon, Pfister, Binder, Uhr and Ising2011).
However, most studies have examined individual single nucleotide polymorphisms (SNPs) or haplotypes of commonly co-inherited SNPs. In recent years, single-candidate polymorphism G×E research has been criticized for selectively showcasing effect sizes that are small and often unreliable (de Vries, Roest, Franzen, Munafò, & Bastiaansen, Reference de Vries, Roest, Franzen, Munafò and Bastiaansen2016; Dick et al., Reference Dick, Agrawal, Keller, Adkins, Aliev, Monroe and Sher2015; Duncan & Keller, Reference Duncan and Keller2011). Although this issue remains controversial (for counterpoints, see Caspi, Hariri, Holmes, Uher, & Moffitt, Reference Caspi, Hariri, Holmes, Uher and Moffitt2010; Karg et al., Reference Karg, Burmeister, Shedden and Sen2011; Vrshek-Schallhorn, Sapuram, & Avery, Reference Vrshek-Schallhorn, Sapuram and Avery2017), it is widely accepted that depression is polygenic, with many genes each contributing a small amount of variance (Cross-Disorder Group of the Psychiatric Genomics Consortium, 2013; Sullivan, Daly, & O'Donovan, Reference Sullivan, Daly and O'Donovan2012); therefore, although individual SNP G×Es may be legitimate, effects may be small and difficult to reliably detect in reasonably sized samples.
Multilocus genetic profiles: refining the “G”
As a potential solution, researchers have constructed multilocus genetic profile scores (MGPSs) (Bogdan, Hyde, & Hariri, Reference Bogdan, Hyde and Hariri2013), or additive indices comprising risk alleles from multiple SNPs selected for inclusion based on shared associations with a biological system linked to behavioral outcomes. This theory-driven approach can be distinguished from polygenic risk scores derived atheoretically using genome-wide association studies (GWAS; Musliner et al., Reference Musliner, Seifuddin, Judy, Pirooznia, Goes and Zandi2015). As continuous indices reflecting cumulative effects of multiple genes, the MGPS approach provides greater power and avoids statistical pitfalls associated with modeling interaction terms using categorical genetic variables (Aliev, Latendresse, Bacanu, Neale, & Dick, Reference Aliev, Latendresse, Bacanu, Neale and Dick2014; Caspi et al., Reference Caspi, Hariri, Holmes, Uher and Moffitt2010; Dick et al., Reference Dick, Agrawal, Keller, Adkins, Aliev, Monroe and Sher2015). Researchers have begun to develop MGPSs reflecting genetic risk in several biological systems. Nikolova, Ferrell, Manuck, and Hariri (Reference Nikolova, Ferrell, Manuck and Hariri2011) developed a dopaminergic MGPS composed of risk alleles from five functional SNPs involved in striatal dopamine signaling. Although no individual SNP had a significant effect, collectively, MGPSs accounted for 11% of variance in reward-related ventral striatum reactivity. Other researchers have linked similar dopaminergic MGPSs to behavioral outcomes (e.g., Davis & Loxton, Reference Davis and Loxton2013; Davis et al., Reference Davis, Loxton, Levitan, Kaplan, Carter and Kennedy2013), including depression (Pearson-Fuhrhop et al., Reference Pearson-Fuhrhop, Dunn, Mortero, Devan, Falcone, Lee and Cramer2014). Vrshek-Schallhorn et al. (Reference Vrshek-Schallhorn, Stroud, Mineka, Zinbarg, Adam, Redei and Craske2015) developed an MGPS composed of five serotonergic SNPs and showed that scores interacted with recent interpersonal life events to predict depressive onset. No individual SNP showed a significant G×E predicting depression, again suggesting a cumulative, polygenic effect. In sum, by aggregating across multiple small effects, the MGPS approach may help mitigate power concerns that have dogged candidate gene research.
Recently, Pagliaccio et al. (Reference Pagliaccio, Luby, Bogdan, Agrawal, Gaffrey, Belden and Barch2014) developed a MGPS composed of 10 SNPs on HPA-axis–related genes; for inclusion, all SNPs were required to have an established association with either HPA axis dysregulation or depression-related phenotypes. SNPs were selected from genes with biologically plausible pathways to stress reactivity, including CRHR1 (expressed in the amygdala and pituitary and thus affecting cortisol release following stress exposure directly and via positive feedback pathways) and NRC31, NRC32, and FKBP5 (which modify cortisol negative feedback via mineralocorticoid and glucocorticoid receptors). In a child sample, the researchers found that MGPS predicted cortisol levels following a laboratory stressor and interacted with major life events to predict hippocampal and amygdala volume and amygdala connectivity with four regions, the latter of which in turn longitudinally predicted emotion regulation problems and anxiety (Pagliaccio et al., Reference Pagliaccio, Luby, Bogdan, Agrawal, Gaffrey, Belden and Barch2014, Reference Pagliaccio, Luby, Bogdan, Agrawal, Gaffrey, Belden and Barch2015a). Scores also predicted amygdala and hippocampus reactivity to fearful faces among pubertal girls (Pagliaccio et al., Reference Pagliaccio, Luby, Bogdan, Agrawal, Gaffrey, Belden and Barch2015b). Other researchers have created MGPSs based on narrower inclusion criteria that specifically require associations with HPA-axis biomarkers (as opposed to depressive outcomes). Di Iorio et al. (Reference Di Iorio, Carey, Michalski, Corral-Frias, Conley, Hariri and Bogdan2017) created one such MGPS using a subset of Pagliaccio et al.’s (Reference Pagliaccio, Luby, Bogdan, Agrawal, Gaffrey, Belden and Barch2014) loci, showing that, in an adult sample, scores interacted with early trauma to predict right amygdala reactivity to threat-related stimuli and directly correlated with anxious arousal. Although these authors found no interaction between early trauma and internalizing symptoms, analysis may have been limited by the study's reliance on self-report data to assess both stress and symptoms. Most recently, Feurer et al. (Reference Feurer, McGeary, Knopik, Brick, Palmer and Gibb2017) found that an MGPS similar to Di Iorio et al.’s (Reference Di Iorio, Carey, Michalski, Corral-Frias, Conley, Hariri and Bogdan2017), comprised three variants (one CRHR1 haplotype, one NR3C2 haplotype, and one FKBP5 SNP), moderated the prospective association between interpersonal acute events and depression among at-risk children, providing the first evidence that HPA-axis multilocus vulnerability G×Es extend to affective outcomes. However, no studies have examined G×Es with affective outcomes using Pagliaccio et al.’s (Reference Pagliaccio, Luby, Bogdan, Agrawal, Gaffrey, Belden and Barch2014) more expansively defined HPA-axis MGPS or examined more diverse aspects of environmental stress.
Conceptualizing environmental stress: refining the “E”
An acknowledged but underaddressed contributor to the variability in G×E findings is the inconsistent and imprecise measurement of environmental stress (Monroe & Reid, Reference Monroe and Reid2008). Life stress is often construed as a uniform construct, but numerous factors may affect the extent to which its emotional impact is genetically moderated. For example, quality of stress measurement differs markedly across studies. Many G×E studies assess stress using checklists or other self-report measures; these measures are potentially problematic because of their subjectivity, limited differentiation between stress occurrence and response, and lack of contextual detail (Harkness & Monroe, Reference Harkness and Monroe2016). Consequently, self-report measures have been shown to produce less reliable G×E effects compared with gold-standard interviews, for which severity is objectively coded by diagnosis-blind raters based on contextual threat (Karg et al., Reference Karg, Burmeister, Shedden and Sen2011; Monroe & Reid, Reference Monroe and Reid2008). The current study relies exclusively on rigorous, interview-based measures of stress.
In addition, characteristics of the environmental context being measured may influence the extent to which it is genetically moderated. Although the issue has been underexplored in relation to HPA-axis genetic risk, previous research (e.g., on serotonergic genetic risk) has compellingly demonstrated that the characteristics of the “candidate environment” markedly affect the significance and magnitude of G×E effects (Karg et al., Reference Karg, Burmeister, Shedden and Sen2011; Monroe & Reid, Reference Monroe and Reid2008; Vrshek-Schallhorn et al., Reference Vrshek-Schallhorn, Mineka, Zinbarg, Craske, Griffith, Sutton and Adam2014). Determining appropriate candidate environments for HPA-axis–related genetic variation is an important next step for the field. For example, the timing and chronicity of the stress are major determinants of its influence on HPA-axis activity. Regarding timing, childhood adversity (CA) may be a particularly relevant candidate environment. Stress exposure during key developmental windows in childhood may disrupt development of the HPA axis and related neural structures (Heim & Nemeroff, Reference Heim and Nemeroff2001), resulting in cascading effects that may affect stress regulation and depressive symptoms. Genetic risk may influence HPA-axis functioning and plasticity during sensitive developmental periods, thereby moderating the effects of CA. According to the allostatic load model (McEwen, Reference McEwen1998), cumulative impact of multiple stressors over the course of childhood may have a particularly strong effect on HPA-axis functioning (compared with single, discrete stressors [e.g., Lupien et al., Reference Lupien, Ouellet-Morin, Hupbach, Tu, Buss, Walker, McEwen, Cicchetti and Cohen2006; Zalewski, Lengua, Kiff, & Fisher, Reference Zalewski, Lengua, Kiff and Fisher2012]); therefore, HPA-axis genetic variation may moderate the additive effect of adversities experienced over the course of childhood.
Temporally proximal stress, on the other hand, is more likely to directly predict depressive onset (Monroe & Reid, Reference Monroe and Reid2008). Temporally proximal stress can in turn be differentiated into acute, episodic stress (discrete, temporary events with significant negative effect) and chronic stress (ongoing strains and challenging circumstances), which are both important to the development of depressive symptoms (Hammen, Reference Hammen2005) but have distinct neurobiological implications (de Kloet, Joëls, & Holsboer, Reference de Kloet, Joëls and Holsboer2005). For example, although much remains unknown about the relationship between environmental stress and cortisol secretion, research broadly suggests that acute stress is linked to hypercortisolism; however, with increased duration of the stressor or under chronic stress, hypocortisolism develops (McEwen, Reference McEwen1998; Miller, Chen, & Zhou, Reference Miller, Chen and Zhou2007; Stroud, Chen, Doane, & Granger, Reference Stroud, Chen, Doane and Granger2016). Both patterns of cortisol secretion represent dysregulation and are related to internalizing symptoms (Chida & Steptoe, Reference Chida and Steptoe2009; McEwen, Reference McEwen1998); thus, although CA, acute stress, and chronic stress are all highly relevant to HPA-axis functioning and depressive symptoms, the specific nature of these associations differs. As a result, it is unclear if their effects on adolescent depressive symptoms would all be similarly moderated by HPA-axis genetic variation. The current study assessed all three forms of environmental stress to examine differential interactions with an HPA-axis MGPS.
Finally, the nature of the stressor may influence the extent to which it is genetically moderated; for example, Vrshek-Schallhorn et al. (Reference Vrshek-Schallhorn, Mineka, Zinbarg, Craske, Griffith, Sutton and Adam2014) recently suggested that interpersonal stress constitutes a more powerful candidate environment to test G×Es involving serotonergic genes. The same logic may apply to HPA-axis–linked genes. Interpersonal dysfunction and stress are closely tied to depression (Hames, Hagan, & Joiner, Reference Hames, Hagan and Joiner2013; Hammen, Reference Hammen, Johnson, Hayes, Field, Schneiderman and McCabe2000). Stressors associated with threats to social status are reliably linked to HPA-axis activation, including elevations in morning and afternoon/evening cortisol and increased latent trait cortisol (Miller et al., Reference Miller, Chen and Zhou2007; Stroud et al., Reference Stroud, Chen, Doane and Granger2016); a meta-analysis of 208 studies showed that laboratory stressors characterized by social evaluative threat elicited higher cortisol responses (Dickerson & Kemeny, Reference Dickerson and Kemeny2004). Notably, Feurer et al. (Reference Feurer, McGeary, Knopik, Brick, Palmer and Gibb2017) found that an HPA-axis MPGS moderated the effect of interpersonal (but not noninterpersonal) acute stress on depression in a sample of children. The current study sought to replicate and extend these findings using Pagliaccio et al.’s (Reference Pagliaccio, Luby, Bogdan, Agrawal, Gaffrey, Belden and Barch2014) 10-SNP MGPS in an adolescent sample.
Developmental timing
Previous studies examining HPA-axis–related multilocus genetic risk have focused on children (Feurer et al., Reference Feurer, McGeary, Knopik, Brick, Palmer and Gibb2017; Pagliaccio et al., Reference Pagliaccio, Luby, Bogdan, Agrawal, Gaffrey, Belden and Barch2014, Reference Pagliaccio, Luby, Bogdan, Agrawal, Gaffrey, Belden and Barch2015a, Reference Pagliaccio, Luby, Bogdan, Agrawal, Gaffrey, Belden and Barch2015b) or adults (Di Iorio et al., Reference Di Iorio, Carey, Michalski, Corral-Frias, Conley, Hariri and Bogdan2017). Adolescence may be a more ideal developmental period within which to examine environmental stress and affective outcomes. Depression rates dramatically increase during adolescence (Avenevoli, Swendsen, He, Burstein, & Merikangas, Reference Avenevoli, Swendsen, He, Burstein and Merikangas2015). This critical period of development is characterized by major social transitions, coinciding with an increase in stressful life events, particularly those that are interpersonal in nature (Rudolph, Reference Rudolph2002). Adolescence is also associated with marked biological changes. In the HPA axis, basal HPA-axis activity shifts in adolescence, resulting in greater adrenal release of related hormones and increased reactivity to stress (Gunnar, Wewerka, Frenn, Long, & Griggs, Reference Gunnar, Wewerka, Frenn, Long and Griggs2009; Romeo, Reference Romeo2013). Altogether, findings point to adolescence as a sensitive period when considering HPA-axis functioning and depressive symptoms.
The current study
We tested multilocus HPA-axis genetic variation as a moderator of the association between environmental stress and depressive symptoms in a sample of adolescents. Following pre-established procedures of Pagliaccio et al. (Reference Pagliaccio, Luby, Bogdan, Agrawal, Gaffrey, Belden and Barch2014), we computed an MGPS using 10 SNPs linked to HPA-axis functioning. We predicted that this MGPS would moderate the association between multiple forms of stress (acute/episodic stress, chronic stress, CA) and adolescent depressive symptoms, but that G×Es would be present for interpersonal (but not noninterpersonal) acute stress and CA.
Method
Participants
The full sample comprised 241 adolescents aged 14–17 years (128 female, 110 male, 3 other [e.g., gender fluid]) who participated with their primary caregiver. Participants were recruited from the community of a mid-sized metropolitan area (for recruitment details, see Starr et al., Reference Starr, Dienes, Stroud, Shaw, Li, Mlawer and Huang2017). Exclusion criteria were previous diagnosis of any psychotic or bipolar disorders; any major physical, neurological, or pervasive developmental disorder; English reading or comprehension difficulties; and prior participation of another household member. Parent-reported median annual family income was $80,000–$89,999, with 24.1% of youth receiving free or reduced-cost lunch at school. Participating parents were primarily mothers (87.6%).
As described in the following section, most analyses were conducted in White youth to account for population stratification (adolescent race was parent-reported; participant reports of racial identification correspond closely with ancestry informative markers; Sinha, Larkin, Elston, & Redline, Reference Sinha, Larkin, Elston and Redline2006). The sample included 192 White adolescents (mean [M] age = 15.89 years, standard deviation [SD] = 1.08, 53.1% female).
Procedure
Families attended a laboratory session in which they provided assent/consent, separately completed interviews, and provided DNA samples. Families received $160 for participating in all study procedures and were entered into raffles. All procedures were approved by the Research Subjects Review Board of the University of Rochester.
Measures
Depressive symptoms
Adolescents’ current symptoms of major depressive disorder and dysthymia were assessed by trained interviewers using the Schedule for Affective Disorders and Schizophrenia for School-Aged Children—Present and Lifetime (Kaufman et al., Reference Kaufman, Birmaher, Brent, Rao, Flynn, Moreci and Ryan1997), a semistructured diagnostic interview with high validity and reliability. As in prior research (e.g., Rao, Daley, & Hammen, Reference Rao, Daley and Hammen2000; Steinberg & Davila, Reference Steinberg and Davila2008), symptoms at the disorder and subsyndromal level were captured using a dimensional 5-point rating scale: 0 = no symptoms; 1 = mild symptoms; 2 = moderate, subthreshold symptoms; 3 = Diagnostic and Statistical Manual of Mental Disorders, 4th edition, criteria met; 4 = DSM-IV criteria met with high severity/impairment. Maximum scores between current major depressive disorder and dysthymia served as an index of depressive symptoms (consistent with prior G×E studies; e.g., Conway, Hammen, Brennan, Lind, & Najman, Reference Conway, Hammen, Brennan, Lind and Najman2010). Blind raters recoded 20% of audiotaped interviews, with 100% reliability.
Chronic and acute stress
The UCLA Life Stress Interview (LSI; Hammen, Henry, & Daley, Reference Hammen, Henry and Daley2000), adapted for adolescents (Shih, Eberhart, Hammen, & Brennan, Reference Shih, Eberhart, Hammen and Brennan2006), is a semistructured interview that assesses chronic and acute stress. To assess chronic stress, interviewers elicited information concerning the adolescents’ typical functioning in the past 6 months across multiple domains: romantic life, close friendships, family life, peer relations, academics, and behavioral issues. Using a scale with behaviorally specific anchor points that ranged from 1 (exceptionally good conditions) to 5 (extreme adversity), half-points permitted, interviewers evaluated and then rated the youth's ongoing stress within each domain over the past 6 months. Scores across all domains were averaged; scores were ranged from 1.58 to 3.58 with acceptable skewness and kurtosis. Interrater reliability was good (intraclass correlation [ICC] = .85).Footnote 1
To assess acute life events, the LSI uses procedures based on the contextual threat method (Brown & Harris, Reference Brown and Harris1978). Trained interviewers elicited information about discrete events from the youth's life over the past year, including nature, dates, and surrounding contexts. Interviewers prepared written narratives about specific events, excluding details about emotional responses, later presented to a team of diagnosis-blind coders. Taking context into account, independent coding teams consensus rated each event's objective negative impact from 1 (no negative impact) to 5 (extremely severe impact), including half-points. Adolescents reported an average of 2.95 events. Teams also rated whether each event was (a) interpersonal in nature/consequences and (b) independent (significantly attributable to the adolescent's own actions). A second coding team rerated a subset of events, with excellent reliability (ICC = .87). Event impact ratings (excluding scores of 1, which denoted nonevents) were summed for indices of total, interpersonal, noninterpersonal, and independent episodic stress. Across the full sample (N = 241), adolescents reported an average of 2.95 events, and total mean severity ranged from 0.0 (i.e., no reported events) to 25.0 (the distribution showed acceptable skew and kurtosis).
CA
Parents completed a modified version of the Youth Life Stress Interview (Rudolph et al., Reference Rudolph, Hammen, Burge, Lindberg, Herzberg and Daley2000), which assessed the adolescents’ experiences with negative life events from birth up until a year before baseline. CA was assessed from parents only because of time constraints and because parents may have better recollection about events during early childhood. Interviewers elicited information about the youths’ exposure to negative events and circumstances (e.g., parental conflict/divorce, deaths, separation from parents, physical illnesses, financial instability), including context, duration, and impact. Parents reported an average of 4.56 events. Events were team-coded on objective negative effect using the same scale as the LSI, and judged as interpersonal or not. Independent judges’ ratings of a subset of life events yielded an ICC of .97. Overall, interpersonal, and noninterpersonal CA scores were obtained by summing the ratings of relevant events, excluding nonevents.
Pubertal development (covariate)
The Pubertal Development Scale (Petersen, Crockett, Richards, & Boxer, Reference Petersen, Crockett, Richards and Boxer1988) includes three items for both sexes relating to physical maturation (e.g., changes in height, skin complexion, body hair growth), as well as two sex-specific additional items (girls: breast development, menstruation; boys: facial hair, vocal changes). All items were scored on a 4-point scale (1 = has not yet begun to 4 = growth or development is complete), with the exception of the dichotomous menstruation item (1 = no, 4 = yes). The five Pubertal Development Scale items were averaged for an overall score.
Genotyping and MGPS computation
Genotyping
Saliva samples were obtained from adolescents using Oragene (DNA Genotek, Ontario, Canada) collection kits. DNA was submitted to the University of Wisconsin-Madison Biotechnology Center for analysis. DNA concentration was detected and quantitated using the Quant-iT PicoGreen dsDNA kit (Life Technologies, Grand Island, NY) and extracted using a standard salting-out procedure. Genotyping was completed using KBiosciences’ competitive allele specific PCR SNP genotyping assay based on dual FRET (KASPar). KASPar assays were amplified with the Eppendorf Mastercycler pro384 thermal cycler using allele specific primers. End point fluorescence signal was analyzed using the Synergy 2 (BioTek) plate reader and Gen5 software program.
In accordance with Pagliaccio et al.’s (Reference Pagliaccio, Luby, Bogdan, Agrawal, Gaffrey, Belden and Barch2014) HPA-axis MGPS, genotype data were obtained for risk alleles from 10 SNPs from four HPA axis-related genes: CRHR1 (rs4792887 T allele, rs110402 G allele, rs242941 T allele, rs242939 G allele, rs1876828 G allele), NR3C1 (rs41423247 G allele, rs10482605 T allele, rs10052957 A allele), NR3C2 (rs5522 G allele), and FKB5 (rs1360780 T allele). Extensive detail on the development and specific coding scheme of this MGPS is available elsewhere (Pagliaccio et al., Reference Pagliaccio, Luby, Bogdan, Agrawal, Gaffrey, Belden and Barch2014). Briefly, SNPs were chosen for associations with elevated cortisol (primarily in the context of laboratory challenges), depression, and/or related phenotypes and were pruned from an initial list of 15 SNPs to reduce linkage disequilibrium (Pagliaccio et al., Reference Pagliaccio, Luby, Bogdan, Agrawal, Gaffrey, Belden and Barch2014).
Distributions of genotypes for individual SNPs are available upon request. All distributions were in Hardy-Weinberg equilibrium (χ2 (1) ≤ 2.82, all p > .05) with the exception of rs1876828, χ2 (1) = 4.12, p = .041. Rerunning analyses excluding this SNP did not affect results.
Computation of MGPS
HPA-axis genetic profile scores were computed following procedures of Pagliaccio et al. (Reference Pagliaccio, Luby, Bogdan, Agrawal, Gaffrey, Belden and Barch2014). SNPs were coded for presence (1) or absence (0) of at-risk genotypes (.5 codes were assigned to heterozygotes in cases where research suggested allelic rather than genotypic effects). Individual SNP codes were summed, with higher a MGPS reflecting higher genetic risk. The MGPS has a possible range of 0–10; in this sample the actual range was 2–9 (M = 4.70, SD = 1.42) We permitted up to two missing genotypes (20%) per person, a proportion consistent with prior MGPS work (Vrshek-Schallhorn et al., Reference Vrshek-Schallhorn, Stroud, Mineka, Zinbarg, Adam, Redei and Craske2015). |Of 2,410 individual variants genotyped, there were 19 genotyping failures (15 participants had 1 SNP with invalid readings, 2 had 2 invalid readings, and none had more than 2). For these adolescents, MGPSs were computed using available SNPs and rescaled.
Results
Preliminary analyses
Population stratification
We first determined extent to which population stratification (i.e., coincidental differences in allele frequencies between racial groups, which may produce spurious findings when race is correlated with outcomes of interest) could potentially confound results. MGPS was significantly associated with racial group, with higher scores among non-White youth compared with Whites: t (239) = 2.10, p = .036. Importantly, non-Whites also scored higher or marginally higher on several other variables of interest, including depressive symptoms (t (58.03) = 2.38, p = .073), chronic stress (t (62.36) = 5.20, p = .013), and acute stress (t (52.19) = 1.94, p = .057). Moreover, race significantly moderated the association between MGPS and depressive symptoms (interaction b = .19, standard error [SE] = .08, p = .024, stronger associations for White youth). Collectively, this suggests population stratification may influence findings. To be conservative, we restricted primary analyses to the White portion of the sample (n = 192), but also present abbreviated results of main hypotheses from the full sample (N = 241).
Main effects and G×E correlations
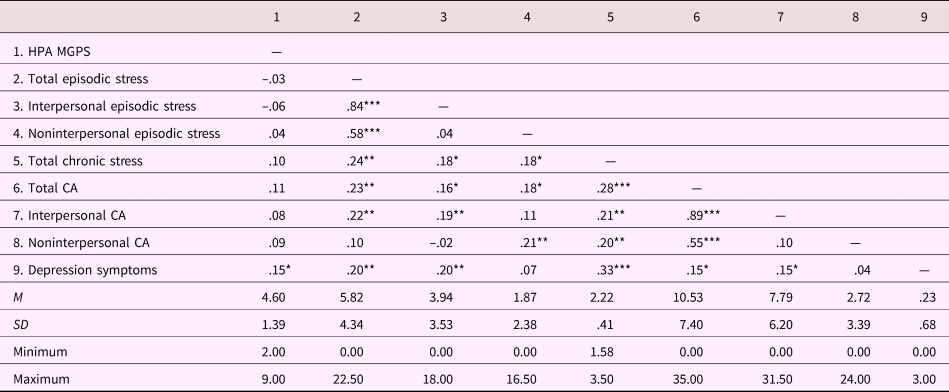
Table 1 presents bivariate correlations and descriptive data within the White subsample. Notably, HPA-axis genetic variation was significantly correlated with adolescent depressive symptoms as a main effect)p = .032), with higher MGPS linked to more symptoms. There was no evidence of G×E correlations between MGPS and any stress variables. Looking at environmental main effects, there were significant associations between adolescent depressive symptoms and chronic stress, acute stress, and CA. Interpersonal, but not noninterpersonal, acute stress and CA were significantly associated with adolescent depressive symptoms.
Bivariate main effect and gene–environment correlations and descriptive data

Note: CA = childhood adversity; HPA = hypothalamic-pituitary-adrenal; M = mean; MGPS = multilocus genetic profile score; SD = standard deviation. Data reflect the White subsample (n = 192) and may differ from the full sample (n = 241). ***p < .001, **p < .01, *p < .05.
Importantly, there was no significant correlation between interpersonal and noninterpersonal forms of acute stress and CA, supporting the notion that these represent unique candidate environments. Other stress indices were modestly correlated (all r ≤ .28).
Overview of tests of G×E interactions
All interactions were tested by entering main effects of stress, MGPS, and their product, with depressive symptoms as the outcome, using the SPSS PROCESS macro (Hayes, Reference Hayes2013). Gender and pubertal stage were included as covariates in all analyses. Following recommendations of Dick et al. (Reference Dick, Agrawal, Keller, Adkins, Aliev, Monroe and Sher2015), we also conducted models in which covariates were entered as main and interaction effects (e.g., gender×G, gender×E). All covariates were nonsignificant in all final models, and there were virtually no cases in which their inclusion altered results. To reduce likelihood of spurious interactions from unmodeled nonlinearity, significant interactions were tested for robustness by adding quadratic terms (G2, E2) as covariates and inspecting significance pattern (Dick et al., Reference Dick, Agrawal, Keller, Adkins, Aliev, Monroe and Sher2015). For full sample analyses, race was also included as a covariate, as both a main effect and in interaction with genetic and stress variables. Significant interactions were decomposed with simple slope tests at M±1 SD. The Johnson-Neyman technique (JNT) was also performed to determine the region of significance (MGPS values at which stress variables were significantly associated with adolescent depressive symptoms). We also conducted alternate decompositions to examine environmental conditions under which HPA-axis vulnerability is most predictive of depressive symptoms.
MGPS × acute stress
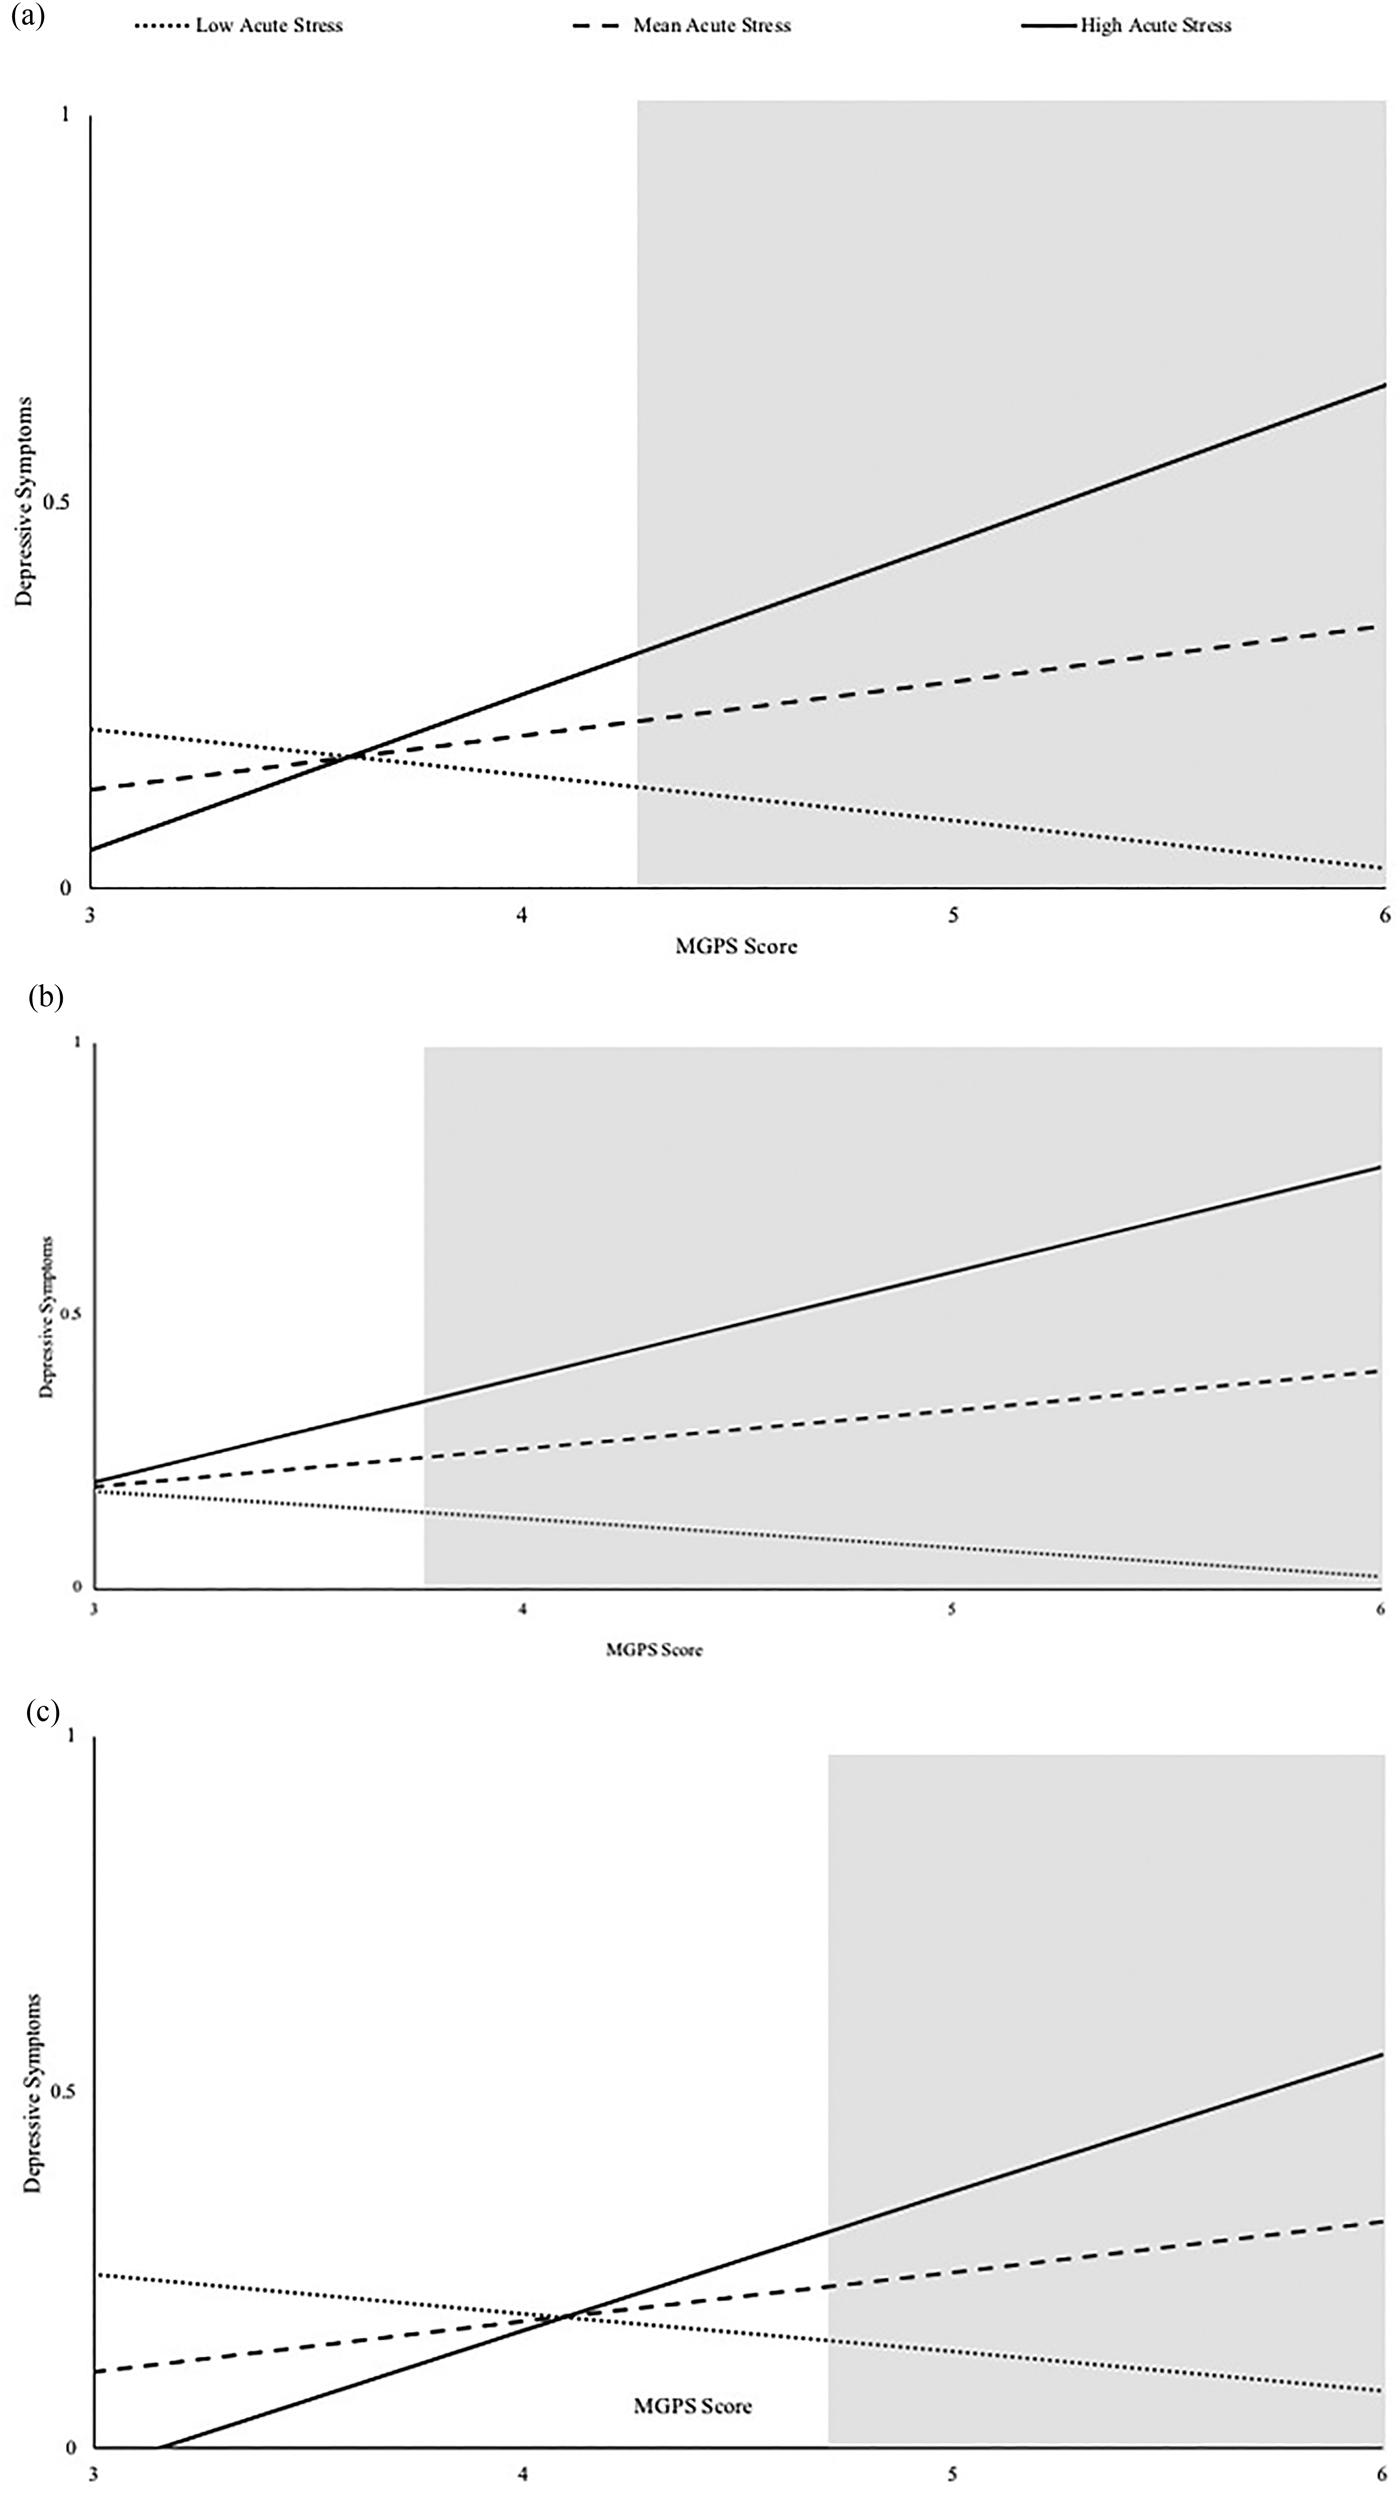
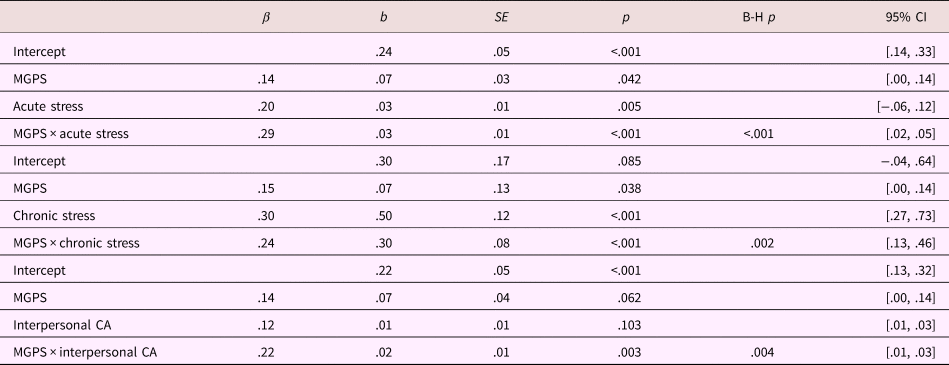
Total acute stress significantly interacted with MGPS to predict adolescent depressive symptoms, p = .00005 (full results in Table 2). ΔR 2 for the interaction was .08, indicating that this G×E effect explains 8% of adolescent depressive symptom variance. Acute stress was not significantly associated with adolescent depressive symptoms at low (M − 1 SD) MGPS, b = –.01, SE = .02, p = .409, but was robustly associated with depressive symptoms at high MGPS (M + 1 SD), b = .08, SE = .01, p < .0001 (Figure 1a). JNT significance region was above MGPS of 4.32, 49th percentile (in addition, youth with extremely low scores [MGPS ≤ 2.30, 5th percentile] showed significant negative associations between acute stress and depressive symptoms). We next performed an alternative decomposition to examine the effects of MPGS at different levels of acute stress. The JNT suggested that at high levels of acute stress (>59th percentile), MGPS predicted increased adolescent depressive symptoms, but at very low levels (lowest 9th percentile, which encompassed youth who reported zero episodic stressors only), MGPS negatively predicted depressive symptoms. In models testing the robustness of the interaction, quadratic terms were nonsignificant and did not influence the significance or interpretation of the interaction. The MGPS × acute stress interaction also retained significance when controlling for main and G×E effects of chronic stress and CA.
Depression symptoms as predicted by (a) acute stress, (b) chronic stress, and (c) interpersonal childhood adversity, at high and low levels of multilocus genetic profile score (MGPS). These analyses were conducted in the White portion of the study sample (n = 192). Shaded areas represent regions over which MGPS predicted significant (p < .05) associations between stress and depression. Depression symptoms reflect continuous interviewer ratings of major depression/dysthymia.

Results for separate regression models predicting current depression from the interactions between HPA-axis multilocus genetic profile scores and acute stress, chronic stress, and interpersonal childhood adversity

Note: ß = standardized parameter estimate; B-H p = Benjamini-Hochberg corrected p value; CA = childhood adversity; CI = confidence interval; HPA = hypothalamic-pituitary-adrenal; MGPS = multilocus genetic profile score; SE = standard error. Analyses are from the White subsample (n = 192). The following covariates were also included in the models, but are omitted here for space: gender, Pubertal Development Scale (PDS), gender × MGPS, gender × stress variable, PDS × MGPS, and PDS × stress variables. All covariates were nonsignificant in final models (all p ≥ .173) and their inclusion did not substantially affect results. Full results are available from the first author upon request.
We next separately tested interpersonal and noninterpersonal acute stress. In both models, interaction terms were significant (G× interpersonal b =.04, SE = .01, p = .0010; G × noninterpersonal b = .05, SE = .02, p = .0025), with stronger associations between both acute stress types and adolescent depressive symptoms at higher MGPS. Further, both interactions remained significant when tested in a single model (G × interpersonal b = .03, SE = .01, p = .0072; G × noninterpersonal b = .04, SE = .02, p = .0133). Inclusion of quadratic terms did not modify significance or pattern of interactions in any of these models.
The cross-sectional nature of our data precludes inferences about temporal ordering of acute stress and adolescent depressive symptoms. To ensure that findings were not the result of youth at high genetic risk being more susceptible to stress generation when depressed (Starr, Hammen, Brennan, & Najman, Reference Starr, Hammen, Brennan and Najman2012), we restricted analyses to independent (fateful, uncontrollable) stress. Results were comparable (interaction term b = .04, SE = .01, p = .0025).
MGPS × chronic stress
MGPS significantly moderated associations between chronic stress and adolescent depressive symptoms, interaction term b = .30, SE = .08, p = .0004, with about 6% of the depressive symptom variance attributable to this interaction (Table 2). As displayed in Figure 1b, chronic stress was associated with depressive symptoms at high (b = .91, SE = .16, p < .0001) but not low (b = .08, SE = .17 p = .6345) MGPS, with a region of significance beginning at the 22nd percentile (MGPS ≥ 3.85). Higher genetic vulnerability scores predicted higher adolescent depressive symptoms at high levels of chronic stress (JNT significance region beginning at 55th percentile of chronic stress), but also predicted lower levels of adolescent depressive symptoms at very low levels of chronic stress (below the third percentile). Supporting the robustness of this G×E, significance was unchanged when controlling for quadratic MGPS and chronic stress terms. The significant interaction also survived when controlling for acute stress and CA (main effects and MGPS interactions).
MGPS × CA
Because the high correlation between total CA and interpersonal CA (r = .89) suggests these scales may be redundant, we chose not to test moderation of total CA to reduce the number of tests. MGPS significantly moderated interpersonal CA, b = .02, SE = .01, p = .0029, with the G×E explaining about 5% of depressive symptom variance (full results in Table 2). Aligning with predictions, interpersonal CA predicted adolescent depressive symptoms at high (b = .04, SE = .01, p = .0007) but not low (b = –.01, SE = .01, p = .4769) MGPS (Figure 1c). JNT analyses indicated that interpersonal CA predicted depressive symptoms at MGPS ≥ 4.77 (54th percentile). Alternate decomposition revealed stronger genetic effects at high levels of interpersonal CA (JNT significance region began at interpersonal CA ≥ 63rd percentile). Quadratic effects were nonsignificant and did not influence significance of the G×E. Note that the MGPS × interpersonal CA interaction did not retain significance when controlling for main effects and G×Es of acute or chronic stress, p = .1075, suggesting that this G×E effect may be at least partially the result of shared variance between interpersonal CA and more temporally proximal stressors. The G×E was nonsignificant for noninterpersonal CA, b = –.01, SE = .01, p = .5723. Results were similar when both interactions were entered simultaneously into a single model.
Corrections for multiple tests
To reduce risk of Type I error from multiple testing, false discovery rate (FDR) adjustments were applied following the procedures of Benjamini and Hochberg (Reference Benjamini and Hochberg1995). In line with genetic research recommendations (Van Den Oord & Sullivan, Reference Van Den Oord and Sullivan2003), FDR was set at .05. All reported significant effects (hypothesized and nonhypothesized) retained significance following FDR adjustment. Adjusted p values are included for major models in Table 2.
Tests of individual SNPs
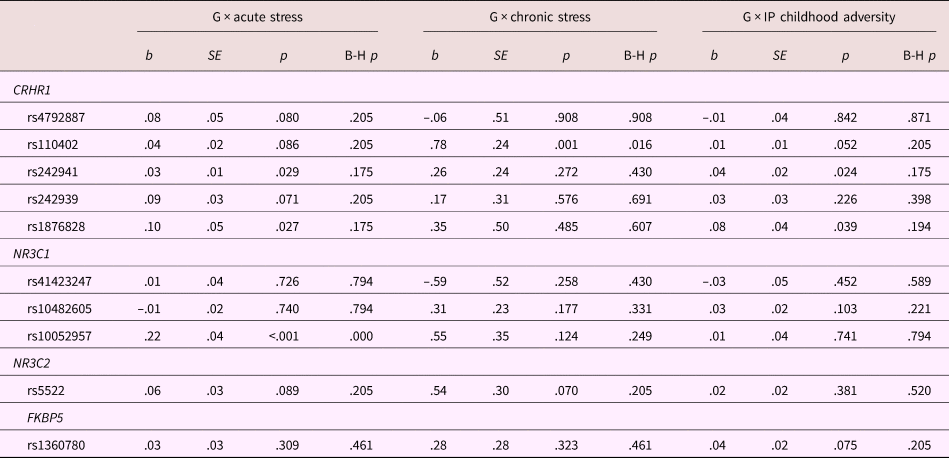
In an exploratory fashion, we tested whether each MGPS SNP individually moderated associations among the three stress indices and adolescent depressive symptoms. Results are provided to allow for MGPS refinements and to demonstrate that MGPS results are not driven by single SNPs; extra caution should be taken in interpreting them outside of that context, because individual SNP G×E effects are expected to be underpowered under an additive, polygenic model. In these models, we included only the main effects of gender and pubertal development as covariates, but also examined whether adding interaction covariates affected results for SNPs that met significance thresholds. Table 3 presents the results. For moderation of acute stress-depressive symptom associations, three SNPs reached nominal significance: rs10052957, rs1876828, and rs242941. After FDR adjustments, however, only one, NR3C1 SNP rs10052957, emerged as significant (nominal p = .0000016, Benjamini-Hochberg adjusted p value = .00005). This interaction held when controlling for covariate interaction terms, p = .0000005. To ensure that rs10052957 did not fully account for results, we computed a modified MGPS excluding this SNP. The interaction between acute stress and modified MGPS remained significant, b = .24, SE = .01, p = .0007.
Results for separate regression models predicting current depression from the interactions between individual SNPs and acute stress, chronic stress, and interpersonal childhood adversity

Note: B-H p = Benjamini-Hochberg corrected p value; IP = interpersonal; SE = standard error. Analyses conducted in the White subsample (n = 192). Covariates included gender and pubertal development.
For chronic stress-depressive symptom moderation, only one SNP (CRHR1 SNP rs110402) was significant, nominally (p = .0011) and after FDR adjustment (p = .008). This SNP remained a significant moderator when controlling for all covariate interaction terms. A modified MGPS excluding rs110402 remained a significant moderator of chronic stress-depressive symptom associations, b = 2.71, SE = .91, p = .0034.
Finally, we examined individual SNPs as moderators of interpersonal CA. Two (CRHR1 SNPs rs242941 and rs1876828) reached nominal significance, but neither survived FDR correction.
Replication in full sample
We reran major analyses in the full (N = 241) sample including all racial groups. Results largely followed identical patterns. MGPS intensified associations between both chronic (p = .0382) and acute stress (p < .0001) and adolescent depressive symptoms. In contrast to these results (but as originally hypothesized), MGPS moderated interpersonal but not noninterpersonal acute stress (respective interaction term p =.0006 and .1276 when entered simultaneously). MGPS × interpersonal CA also remained significant (p = .0318). Patterns of decomposition were consistent with previous results.
Replication using Di Iorio et al. (Reference Di Iorio, Carey, Michalski, Corral-Frias, Conley, Hariri and Bogdan2017) MGPS
Last, we examined whether results replicated using the subset of SNPs included in Di Iorio et al.’s (Reference Di Iorio, Carey, Michalski, Corral-Frias, Conley, Hariri and Bogdan2017) MGPS, which included CRHR1 rs110402, FKBP5 rs1350780, and NR3C2 rs5522 (this single SNP represented the two-SNP NR3C2 haplotype used by Di Iorio et al.), with all risk alleles coded additively. The association between chronic stress and depression was moderated by this MGPS within the White sample (p = .0014), as was interpersonal CA (p = .0327). Acute stress was only marginally moderated by the Di Iorio et al. MGPS (p = .0852). The effects of the Di Iorio MGPS on depression varied substantially by race (race × MGPS p = .00004), with stronger effects for Whites; none of these results were replicated in the full, nonstratified sample.
Discussion
The current study adds critical findings to the G×E literature regarding the interactive relationship between HPA-axis–linked multilocus genetic risk, environmental stress, and adolescent depressive symptoms. First, there was a significant main effect of MGPS on depressive symptoms. Importantly, this main effect was qualified by significant G×Es with multiple indices of environmental stress: acute stress, chronic stress, and interpersonal CA. In all cases, youth with high HPA-axis vulnerability showed stronger stress-depression associations.
Previous studies have connected HPA-axis multilocus profile scores to depression-linked biological phenotypes (e.g., cortisol secretion in response to a laboratory challenge, hippocampal volume, amygdala reactivity and connectivity), both as main effects and in interaction with environmental stressors (Di Iorio et al., Reference Di Iorio, Carey, Michalski, Corral-Frias, Conley, Hariri and Bogdan2017; Pagliaccio et al., Reference Pagliaccio, Luby, Bogdan, Agrawal, Gaffrey, Belden and Barch2014, Reference Pagliaccio, Luby, Bogdan, Agrawal, Gaffrey, Belden and Barch2015a, Reference Pagliaccio, Luby, Bogdan, Agrawal, Gaffrey, Belden and Barch2015b). This study, however, is only the second to extend these G×E findings to affective outcomes using gold-standard, contextual threat-based methods of stress assessment (see also Feurer et al., Reference Feurer, McGeary, Knopik, Brick, Palmer and Gibb2017), and the first to do so (a) using Pagliaccio et al.’s (Reference Pagliaccio, Luby, Bogdan, Agrawal, Gaffrey, Belden and Barch2014) comprehensive 10-SNP MGPS, (b) in an all-adolescent sample, and (c) examining chronic stress and childhood adversity in addition to episodic stressors. Examining potential biological intermediate phenotypes as outcomes is a crucial step toward elucidating pathways between genetic risk and depression, and aligns with evolving conceptualizations of psychopathology (e.g., Insel et al., Reference Insel, Cuthbert, Garvey, Heinssen, Pine, Quinn and Wang2010); however, it also remains important to demonstrate that models of genetic risk that predict biological phenotypes also extend to behaviorally defined psychopathology. To this end, current findings (as well as the aligning findings reported by Feurer et al., Reference Feurer, McGeary, Knopik, Brick, Palmer and Gibb2017) provide important context for interpreting prior research linking HPA-axis MGPSs to biological phenotypes and lay a foundation for future research examining other outcomes.
Importantly, no individual SNPs accounted for G×E findings. Although several individual SNPs showed nominally significant G×Es, only two withstood correction for multiple testing (NR3C1 SNP rs10052957 moderating acute stress and CRHR1 SNP 110402 moderating chronic stress). Excluding these two SNPs did not alter results, suggesting that the accumulation of HPA-axis–related genetic risk, rather than any individual variant, drives our effects. This aligns with modern understanding of the genetic architecture of depression. Despite high heritability of depression in twin studies (e.g., Eaves et al., Reference Eaves, Silberg, Meyer, Maes, Simonoff, Pickles and Truett1997), most GWAS efforts have failed to identify individual SNPs associated with depression (e.g., Major Depressive Disorder Working Group of the Psychiatric GWAS Consortium, 2013; although recent studies have been somewhat more successful; see Converge Consortium, 2015; Okbay et al., Reference Okbay, Baselmans, De Neve, Turley, Nivard, Fontana and Derringer2016; Wray & Sullivan, Reference Wray and Sullivan2018), leading to a general consensus that genetic risk for depression is composed of many small additive effects (Cross-Disorder Group of the Psychiatric Genomics Consortium, 2013; Sullivan et al., Reference Sullivan, Daly and O'Donovan2012). Further supporting this idea, Lubke et al. (Reference Lubke, Hottenga, Walters, Laurin, de Geus, Willemsen and Boomsma2012) recently estimated that the additive variance contributed by all SNPs assessed on a GWAS chip account for up to 32% of depression variance. The multilocus approach capitalizes on this genetic architecture. Moreover, compared with atheoretical polygenic approaches, biologically informed multilocus scores allow researchers to make theoretically driven hypotheses and draw clearer inferences about etiological factors. For example, our findings are consistent with the notion that HPA-axis functioning contributes to depressive symptom etiology, dually influenced by genetic and environmental factors.
Notably, effect sizes (accounting for up to 8% of depression variance) in the current study were markedly larger than those typically found in G×E studies, including those using GWAS-based polygenic risk score approaches, which have either had null results or reported interactions accounting for 0.12% to 0.50% of depression variance (Colodro-Conde et al., Reference Colodro-Conde, Couvy-Duchesne, Zhu, Coventry, Byrne, Gordon and Martin2017; Mullins et al., Reference Mullins, Perroud, Uher, Butler, Cohen-Woods, Rivera and Lewis2014; Musliner et al., Reference Musliner, Seifuddin, Judy, Pirooznia, Goes and Zandi2015; Peyrot et al., Reference Peyrot, Milaneschi, Abdellaoui, Sullivan, Hottenga, Boomsma and Penninx2014). GWAS-based approaches devise risk scores based on SNPs with significant main effects on depression, which may differ from genetic liability to stress reactivity, especially in the presence of differential susceptibility (Belsky & Pluess, Reference Belsky and Pluess2009). As a point of speculation, GWAS-based approaches also have the potential to capture peripheral genes that do not contribute directly to etiology, whereas the MPGS approach, with SNPs selected using biologically meaningful rationales, may be more likely to represent “core” genes (Boyle, Li, & Pritchard, Reference Boyle, Li and Pritchard2017). Further, studies using polygenic risk score approach have typically relied on checklists or ad hoc measures of stress (c.f., Peyrot et al., Reference Peyrot, Milaneschi, Abdellaoui, Sullivan, Hottenga, Boomsma and Penninx2014), which may introduce bias. We also emphasize that our high effect sizes may be anomalous and that further replication is needed. Moreover, further refinements may be needed as knowledge advances because our models are likely oversimplified. For example, there may be epistatic effects (G×G) among individual HPA-axis–related variants or with genetic risk related to other biological systems. Previous research has already supported epistasis among individual HPA-axis–related SNPs (Reuter, Markett, Melchers, & Montag, Reference Reuter, Markett, Melchers and Montag2012; Sheikh, Kryski, Smith, Hayden, & Singh, Reference Sheikh, Kryski, Smith, Hayden and Singh2013; Szczepankiewicz et al., Reference Szczepankiewicz, Leszczynska-Rodziewicz, Pawlak, Narozna, Rajewska-Rager, Wilkosc and Twarowska-Hauser2014). Nonlinear effects of genetic risk should be examined more closely. Multiple stressful contexts could also interact with each other along with genetic risk (G×E×E, see Starr et al., Reference Starr, Hammen, Conway, Raposa and Brennan2014). Further research should consider the potential layers of complexity that may underlie genetic risk for depression. Moreover, our results show that at very low levels of acute and chronic stress (e.g., zero recent life events), HPA-axis genetic vulnerability actually predicted lower levels of adolescent depressive symptoms. These results may hint at a differential susceptibility pattern, in which the same genetic factors that place youth at high risk under stressful contexts predict thriving under positive, nurturing contexts (Belsky, Bakermans-Kranenburg, & van IJzendoorn, Reference Belsky, Bakermans-Kranenburg and van IJzendoorn2007; Belsky & Pluess, Reference Belsky and Pluess2009). Feurer et al. (Reference Feurer, McGeary, Knopik, Brick, Palmer and Gibb2017) also found evidence for differential susceptibility using another HPA-axis MGPS. Future research should assess a broad spectrum of contextual factors to further probe whether HPA-axis genetic “vulnerability” can be better construed as for-better-and-for-worse malleability to environmental conditions.
We separately examined chronic and acute stress and CA, under the expectation that results might vary depending on the type of stressor being assessed, given the differential relationship between different forms of stress and HPA-axis functioning. We found instead that, as a whole, the MGPS moderated the relationship between depression and most forms of stress (largely irrespective of nature, timing, and chronicity), suggesting that this genetic profile captures broadly defined stress reactivity. We had predicted that G×E results would be unique to interpersonal stressors, and results were somewhat equivocal. Regarding acute stressors, we found that MGPS moderated both interpersonal and noninterpersonal stress, in contrast to previous work examining serotonergic risk (Vrshek-Schallhorn et al., Reference Vrshek-Schallhorn, Mineka, Zinbarg, Craske, Griffith, Sutton and Adam2014), as well as a recent study using a different HPA-axis MGPS in a younger sample (Feurer et al., Reference Feurer, McGeary, Knopik, Brick, Palmer and Gibb2017). Notably, in the full, nonracially stratified sample, genetic moderation was exclusive to interpersonal stress, suggesting that race (or correlated risk factors) may influence results. More research is needed to explore this issue. However, we consistently found that for CA, only the impact of interpersonal stress (and not noninterpersonal CA) was genetically moderated. Given the importance of social bonds in attachment formation and the dependence of young children on close others for safety and wellbeing, interpersonal events in early childhood may constitute particularly potent threats and may therefore be particularly relevant to HPA-axis functioning. Moreover, interpersonal stressors may have cascading effects on social development that contribute to continuous stress exposure, which may shape HPA-axis development. Although previous studies have considered how genetic moderation differs depending on nature of CAs (e.g., maltreatment subtypes; Cicchetti & Rogosch, Reference Cicchetti and Rogosch2012), we are not familiar with research that has specifically highlighted interpersonal CA as a particularly relevant context for G×Es. If results replicate, future research should consider interpersonal CA as an important “candidate environment.” Note, however, that controlling for G×Es with chronic and acute stress rendered the G×E with interpersonal CA nonsignificant, suggesting that continued exposure to temporally proximal stressors may account for findings. Further, there were fewer noninterpersonal than interpersonal adversities reported in our sample, and the difference in variability may have truncated power for the noninterpersonal CA analysis.
We focused on depressive outcomes, but it is very likely that this MGPS confers transdiagnostic risk because HPA axis functioning is closely tied to numerous psychiatric and physical conditions. For example, anxiety commonly co-occurs with depression, is associated with elevated adrenocortical stress response (e.g., Condren, O'Neill, Ryan, Barrett, & Thakore, Reference Condren, O'Neill, Ryan, Barrett and Thakore2002), and has been directly linked to multilocus HPA-axis genetic risk (Di Iorio et al., Reference Di Iorio, Carey, Michalski, Corral-Frias, Conley, Hariri and Bogdan2017). Other psychiatric problems are closely linked to abnormalities in HPA-axis functioning, but with markedly different patterns of dysregulation from the hyperactivity most characteristic of depression. For example, posttraumatic stress disorder has been linked to low urinary cortisol levels and increased cortisol suppression following dexamethasone challenge (Yehuda et al., Reference Yehuda, Southwick, Krystal, Bremner, Charney and Mason1993; Yehuda et al., Reference Yehuda, Southwick, Nussbuam, Wahby, Giller and Mason1990). Moreover, risk for externalizing problems (including aggression, disruptive behavior disorders, and substance use) is associated with low cortisol secretion in laboratory settings (McBurnett, Lahey, Capasso, & Loeber, Reference McBurnett, Lahey, Capasso and Loeber1996; McBurnett, Lahey, Rathouz, & Loeber, Reference McBurnett, Lahey, Rathouz and Loeber2000; Moss, Vanyukov, & Martin, Reference Moss, Vanyukov and Martin1995) as well as altered diurnal cortisol patterns (Popma et al., Reference Popma, Doreleijers, Jansen, Van Goozen, Van Engeland and Vermeiren2007). It is unclear whether this MGPS (selected for associations with depression and cortisol hyperactivity; Pagliaccio et al., Reference Pagliaccio, Luby, Bogdan, Agrawal, Gaffrey, Belden and Barch2014) would be similarly associated with these outcomes; this is a fascinating question for future studies. Finally, HPA-axis dysfunction is associated with a large scope of medical problems (e.g., type II diabetes, cardiovascular disease, stroke; Rosmond & Bjorntorp, Reference Rosmond and Bjorntorp2000); it would be intriguing to examine whether HPA-axis genetic variation moderates the link between stress and immune functioning, cellular aging, and other markers of physiological health.
Given the confluence of changing biology, increased reactivity to stress, and greater rates of depression, adolescence was an ideal developmental period to examine our research questions; however, these G×E findings likely are not limited to adolescence and may change across development. For example, longitudinal twin studies suggest that the relative importance of environment versus genetics in depression etiology shifts with age (e.g., Rice, Harold, & Thapar, Reference Rice, Harold and Thapar2002; Tully, Iacono, & McGue, Reference Tully, Iacono and McGue2010). HPA-axis activity also changes over time, with increases in basal levels of cortisol from childhood into adulthood (Gunnar & Vazquez, Reference Gunnar, Vazquez, Cichetti and Cohen2015). Longitudinal research tracking how the effects of HPA-axis genetic variation change over time will be an important future direction.
Readers should note that our sample size (particularly the racially stratified subsample) is small by candidate gene standards. Although this is, without doubt, an important study limitation, it is worth remembering that stringent standards were developed for single polymorphism candidate gene research. For example, in a widely cited criticism of existing candidate G×E research, Duncan and Keller (Reference Duncan and Keller2011) made strict sample size recommendations based on an estimated “moderate” G×E R 2 of .001. In contrast, our own results revealed R 2 values ranging up to .08, which is 80 times these authors’ estimates (note that Duncan and Keller, Reference Duncan and Keller2011, also computed power functions for larger effect sizes and found that much smaller samples were adequately powered, with “very large” effect sizes of .1 requiring only 50 participants). Although the magnitude of our effect sizes may be anomalous and requires replication, we believe that the robustness of our findings (which withstood correction for multiple testing, sample racial stratification, and control of covariates, covariate interaction terms, and quadratic terms) suggests our sample was adequately powered. Indeed, we hope that our findings, coupled with those from previous studies (e.g., Feurer et al., Reference Feurer, McGeary, Knopik, Brick, Palmer and Gibb2017; Vrshek-Schallhorn et al., Reference Vrshek-Schallhorn, Stroud, Mineka, Zinbarg, Adam, Redei and Craske2015), demonstrate the feasibility of evaluating G×E effects in modestly sized samples when multilocus scores and gold-standard stress assessments are used. That is, optimizing both the “G” (using multilocus profiles) and the “E” (through careful selection of candidate environments and rigorous stress measurement) may produce more robust and reliable G×E results. Indeed, as others have noted (Caspi et al., Reference Caspi, Hariri, Holmes, Uher and Moffitt2010), requiring very large samples in G×E may compel researchers to rely on self-report stress measures because of their efficiency and low labor costs, even though such measures are associated with smaller G×E effects (Karg et al., Reference Karg, Burmeister, Shedden and Sen2011). That said, we cannot definitively determine whether use of contextual threat-based interviews to assess stress contributed to high effect sizes because we had no questionnaire-based stress measure with which to compare results. Continued replication of current findings using diverse methods remains a pressing priority.
Additionally, the sample was cross-sectional, which raises two important issues. First, reporting of stress may have been subject to biases associated with retrospection. This concern is somewhat mitigated by our use of independent raters, who coded events based on objective characteristics and context, blind to diagnosis, genetic risk, and the individual's emotional response to the event. Gold-standard life stress interviews are not immune to recall bias, however; for example, even with standardized probes, individuals may be more likely to remember events with lasting emotional impact. This is especially relevant for assessment of CA, which often occurred many years before the assessment. Future research that longitudinally assesses CA beginning early in life or that uses objective indicators of adversity occurrence (e.g., child abuse reports) will be critical. Second, temporal precedence of stress before depressive symptoms is unverified. This is important because the association between stress and depressive symptoms is known to be bidirectional; stress clearly predicts depressive symptoms, but individuals with depression also generate or select into stressful contexts (Hammen, Reference Hammen1991). Further, genetic risk may increase the likelihood of stress generation (Harkness et al., Reference Harkness, Bagby, Stewart, Larocque, Mazurka, Strauss and Kennedy2015; Starr et al., Reference Starr, Hammen, Brennan and Najman2012), although this has never been tested with HPA-axis–linked genes. We did show that independent stress (fateful events outside of the person's control) was genetically moderated, which adds to our confidence that this G×E is not exclusively a result of stress generation. Further, a recent study using a different MGPS supported a significant G×E using longitudinal data (Feurer et al., Reference Feurer, McGeary, Knopik, Brick, Palmer and Gibb2017). Longitudinal research is most appropriate when follow-up periods are brief because of decay in the effects of stress on depression (Harkness & Monroe, Reference Harkness and Monroe2016). Nonetheless, additional longitudinal work that tracks temporal precedence of stress (and examines the intriguing hypothesis that HPA-axis genetic variation contributes to stress generation) is an important next step.
Other limitations also merit note. In addition to being assessed retrospectively, CA was assessed via parent report. As a result, events that occurred outside of the parent's awareness may have been excluded, and the child's perspective of the adverse experience was not incorporated. Parents may have also been unwilling to disclose events in which they themselves were a perpetrator (e.g., emotional abuse). Our sample was also drawn from the community, and rates of psychopathology are relatively low. Future research is needed in higher risk samples. In addition, we coded adolescent depressive symptoms as a dimensional variable, which has multiple benefits (e.g., more statistical power, inclusion of subthreshold cases, greater consistency with modern conceptualizations of depression), but also presents some challenges. For example, there is no established method of differentiating between first onset, recurrences, and other markers of depression course within our dimensional coding system, which research has suggested may be an important distinction for G×E findings (Kendler, Thornton, & Gardner, Reference Kendler, Thornton and Gardner2001; Uher et al., Reference Uher, Caspi, Houts, Sugden, Williams, Poulton and Moffitt2011). Moreover, the current study did not use a GWAS chip for genotyping, which precluded us from doing competitive significance testing to determine whether this MGPS outperforms randomly generated MGPSs comprising SNPs with similar characteristics (see Di Iorio et al., Reference Di Iorio, Carey, Michalski, Corral-Frias, Conley, Hariri and Bogdan2017), an important direction for future studies.
The MGPS approach has some inherent limitations. For example, construction of an MGPS relies on the existing database of candidate gene studies, which often present inconsistent or even contradictory guidance on which specific alleles confer risk, and under which conditions (Bogdan et al., Reference Bogdan, Salmeron, Carey, Agrawal, Calhoun, Garavan and Goldman2017). Greater standardization of procedures for developing, replicating, and refining novel MGPSs is needed. Despite these limitations, this study highlights the importance of stress-system genetic variation in contributing to adolescent depressive symptom etiology and demonstrates the promise of using multilocus profiles to examine G×Es with affective outcomes.
Study funding was provided by the University of Rochester. The authors thank Y. Irina Li, Zoey A. Shaw, and Fanny Mlawer for data collection management, and participating families for generously volunteering their time. The authors acknowledge the University of Wisconsin Biotechnology Center DNA Sequencing Facility for providing genotyping facilities and services.