1. Introduction
The investigation of heat transfer and thermal effects in particle-laden flows is widely relevant to multiple fields. This phenomenon spans diverse domains ranging from atmospheric cloud microphysics (Grabowski & Wang Reference Grabowski and Wang2013) to energy-intensive industrial systems, including coal-fired fluidized bed reactors (Mickley & Fairbanks Reference Mickley and Fairbanks1955; Feng & Musong Reference Feng and Musong2014), concentrated solar receivers (Zamansky et al. Reference Zamansky, Coletti, Massot and Mani2014) and biomass conversion processes (Zhong et al. Reference Zhong, Yu, Liu, Tong and Zhang2016). The collective findings reveal that heat transfer not only affects energy transfer efficiency but also induces complex thermohydrodynamic coupling effects through buoyancy-driven modifications of both fluid flow and particle dynamics. Consequently, research on heat transfer and thermal-buoyancy effects holds promising prospects for both theoretical exploration and engineering applications.
Earlier investigations of heat transfer in particle-laden flow focused on developing empirical correlations for heat transfer coefficients, i.e. Nusselt numbers. The Ranz–Marshall correlation provides a foundational framework for heat transfer of spherical particles in forced convection (Rans & Marshall Reference Rans and Marshall1952). And the applicable parameter range of this correlation was extended by Whitaker (Reference Whitaker1972) and Feng & Michaelides (Reference Feng and Michaelides2000). Other factors influencing Nusselt numbers have been further explored, such as the aspect ratio of ellipsoidal particles (Kishore & Gu Reference Kishore and Gu2011), attack angles and temperature ratios (Kiwitt et al. Reference Kiwitt, Fröhlich, Meinke and Schröder2022). Subsequent studies expanded these insights to wake instabilities, revealing bifurcations at the critical Reynolds numbers (Ern et al. Reference Ern, Risso, Fabre and Magnaudet2012). For small Reynolds numbers, the wake remains axisymmetric with a symmetric local Nusselt number distribution (Bagchi, Ha & Balachandar Reference Bagchi, Ha and Balachandar2001). The first bifurcation
 $({\textit{Re}}_{cr1} \approx 212)$
induces axial symmetry breaking while preserving a planar reflectional symmetry, generating transverse or lift forces. Beyond
 ${\textit{Re}}_{cr2} \approx 270$
, the oscillations of longitudinal vortex emerge through a secondary Hopf bifurcation. The tertiary instability at
 ${\textit{Re}}_{cr3} \approx 320$
triggers a secondary frequency that is approximately one-third of the primary frequency (Bouchet, Mebarek & Dušek Reference Bouchet, Mebarek and Dušek2006), ultimately transitioning to a three-dimensional (3-D) chaotic wake when
 $\textit{Re} \gtrsim 355$
(Magnaudet & Mougin Reference Magnaudet and Mougin2007).
As regards the freely moving particles, the translational and angular motions introduce additional degrees of freedom, leading to non-rectilinear trajectories first documented by Newton, Cohen & Whitman (Reference Newton1687). This phenomenon, called path instability, has been extensively explored for isothermal particles settling or rising in Newtonian fluids with comprehensive experiments (Horowitz & Williamson Reference Horowitz and Williamson2010; Raaghav, Poelma & Breugem Reference Raaghav, Poelma and Breugem2022) and numerical simulations (Jenny, Dušek & Bouchet Reference Jenny, Dušek and Bouchet2004; Zhou & Dušek Reference Zhou and Dušek2015; Auguste & Magnaudet Reference Auguste and Magnaudet2018). The mechanistic relationship between path instability and wake instability for spherical particles emerges as a critical coupling phenomenon governed by the particle–fluid density ratio and the Reynolds number (Ern et al. Reference Ern, Risso, Fabre and Magnaudet2012). Beyond critical Reynolds numbers, wake vortices generate oscillating lift forces and torques that drive bifurcations in particle trajectories, yielding characteristic regimes of path instability such as a spiralling regime or zigzagging regime.
Systematic regime mapping of path instability of spheres has been achieved through parametric studies, though the consensus on some patterns remains incomplete. Numerical simulations by Jenny et al. (Reference Jenny, Dušek and Bouchet2004) identified six distinct regimes: stable vertical, stable oblique, low or high-frequency oscillating oblique, periodic zigzagging and chaotic regime spanning density ratios
 $(0\leqslant \rho _r \leqslant 10)$
and Galileo numbers
 $(150\leqslant \textit{Ga} \leqslant 350)$
. Experimental validations (Veldhuis et al. Reference Veldhuis, Biesheuvel, Van Wijngaarden and Lohse2004; Veldhuis & Biesheuvel Reference Veldhuis and Biesheuvel2007) confirmed this classification, whereas Horowitz & Williamson (Reference Horowitz and Williamson2010) reported different particle behaviour. Potential sources of experimental error, including void-induced mass distribution inhomogeneities, initial release disturbances and background flow perturbations, were discussed by Will & Krug (Reference Will and Krug2021). Auguste & Magnaudet (Reference Auguste and Magnaudet2018) numerically explored many new regimes of light spheres rising at intermediate Galileo numbers and investigated the effect of path instabilities on the drag coefficient. Then the effects of deformation of light rising bubbles has also been studied (Bonnefis et al. Reference Bonnefis, Sierra-Ausin, Fabre and Magnaudet2024). Additional studies identified a bistable regime at high Galileo numbers, where particle behaviour is characterized by either a planar, vertical oscillation with small amplitude and high frequency or a chaotic state that is sensitive to the initial conditions (Zhou & Dušek Reference Zhou and Dušek2015; Raaghav et al. Reference Raaghav, Poelma and Breugem2022).
Moreover, the dynamics of particles could be significantly influenced by thermal buoyancy, which drives natural convection. Under the Oberbeck–Boussinesq approximation, density variations are assumed to depend linearly on temperature and are confined to the buoyancy term in the momentum equation of fluid flows. This assumption is valid for the systems with small density differences and negligible Mach numbers. The influence of thermal buoyancy on particle dynamics has been extensively investigated across various studies. For spherical particles, Kotouč, Bouchet & Dušek (Reference Kotouč, Bouchet and Dušek2008) analysed the loss of axisymmetry of the wake of a fixed heated particle in assisting flows. Subsequently, Kotouč et al. (Reference Kotouč, Bouchet and Dušek2009) systematically investigated thermal-buoyancy effects on wake transition dynamics, comprehensively characterizing both assisting and opposing flow configurations. In contrast, Dan & Wachs (Reference Dan and Wachs2010) examined how thermal-buoyancy effects on freely settling spheres, highlighting the roles of Reynolds numbers and Grashof numbers in this process. Meanwhile, Majlesara et al. (Reference Majlesara, Abouali, Kamali, Ardekani and Brandt2020) demonstrated altered settling dynamics and path instabilities in freely released ellipsoidal particles under thermal buoyancy. Thermal buoyancy also impacts particle–particle interactions in multiparticle systems. Gan et al. (Reference Gan, Chang, Feng and Hu2003) studied the motion and interactions of cold or hot particle pairs in two-dimensional vertical channels considering thermal convection. Yang et al. (Reference Yang, Chen, Cao, Liu and Zheng2016) further revealed that thermal convection accelerates vortex shedding and substantially modifies the interactions between two cold particles during the sedimentation. The effects of thermal buoyancy on particle sedimentation at density ratio near unity were performed by Xu & Choi (Reference Xu and Choi2023). Additionally, particles generating heat can alter their motion through thermal convection. Examples include catalyst particles that release heat from chemical reactions (Yu, Shao & Wachs Reference Yu, Shao and Wachs2006; Wachs Reference Wachs2011; Shao, Shi & Yu Reference Shao, Shi and Yu2012) and solar energy-absorbing particles (Zamansky et al. Reference Zamansky, Coletti, Massot and Mani2014). Collectively, these works underscore the profound impact of thermal buoyancy on particle dynamics across various flow regimes. Their findings hold a significant application value in fields such as meteorology, ocean engineering, aerospace engineering and biomechanics.
However, particularly for light particles, little is known about how thermal buoyancy affects path instability. Previous investigations by Chouippe et al. (Reference Chouippe, Krayer, Uhlmann, Dušek, Kiselev and Leisner2019) modelled a falling graupel as a heated sphere falling in quiescent flows, exploring the saturation field in the wake of the sphere. Their findings demonstrate that thermal-buoyancy effects on the wake of ice particles are negligible when the density ratio is around
 $10$
. Additionally, Majlesara et al. (Reference Majlesara, Abouali, Kamali, Ardekani and Brandt2020) considered thermal buoyancy impacts on settling spheroidal particles with varying aspect ratios, providing analyses of wake structures and the regions of stable sedimentation. Their study, however, focused exclusively on
 $\rho _r = 1.1$
particles. Collectively, existing research on thermal buoyancy primarily concentrate on the path instabilities of heavy particles, with light particles receiving insufficient attention.
For light particles, significant modifications to path instability during rising are anticipated when thermal buoyancy becomes more important. However, these thermohydrodynamic interactions remain unexplored to the best of the authors’ knowledge. To fill this gap, it is crucial to investigate how thermal buoyancy influences the dynamics and path instability of a rising or settling particle, particularly for light particles. This study focuses on the motion of a sphere under thermal buoyancy through particle-resolved direct numerical simulations. By independently varying dimensionless parameters, we investigate separately particle inertial, thermal buoyant and gravitational effects on the dynamics and path instabilities of particles. We conduct comparative simulations of particles with varying density ratio under fixed buoyancy conditions, where the Galileo number and Richardson number remain constant. Then we focus on the dynamics of light particles influenced by thermal buoyancy. Our simulations reveal a substantial reduction in the critical Reynolds number for path instability when thermal buoyancy is involved. This destabilization mechanism originates from thermally induced natural convection that modulate the rear vortex of the particle, triggering wake instability. We identify four distinct regimes: stable vertical, zigzagging, spiralling and chaotic regimes. The established regime maps enhance predictive modelling of multiphase systems, emphasizing the necessity of incorporating thermal effects in particle-resolved simulations.
The paper is organized as follows. Section2 introduces the governing equations, numerical methods and simulation set-up. Section3 presents the results of simulations. We first analyse the particle inertial effects through density ratio variations under fixed buoyancy conditions. Then we investigate thermal buoyant effects and gravitational impacts on the dynamics and heat transfer of particles, focusing on light particles
 $(\rho _r =0.5)$
. Finally, §4 summarizes key findings of this study.
2. Simulation methodology
2.1. Governing equations
The governing equation for the fluid phase is the non-dimensional Navier–Stokes equations under the Oberbeck–Boussinesq approximation (2.1)–(2.3), i.e.
 \begin{align}\frac {\partial \boldsymbol{u}}{\partial t}+\boldsymbol{u} \boldsymbol{\cdot }\boldsymbol{\nabla }{\kern-1pt}\boldsymbol{u}&= - \boldsymbol{\nabla }{\kern-1pt}p +\frac {1}{\textit{Re}} {\nabla} ^{2} \boldsymbol{u} -\frac {Gr}{\textit{Re}^{2}} \theta \boldsymbol{e_g} + \boldsymbol{f}_{\!\textit{IB}}, \end{align}
 \begin{align}\boldsymbol{\nabla }\boldsymbol{\cdot }\boldsymbol{u}&=0, \end{align}
 \begin{align}\frac {\partial \theta }{\partial t}+\boldsymbol{u} \boldsymbol{\cdot }\boldsymbol{\nabla }\theta &=\frac {1}{{\textit{Re}} {\textit{Pr}}} {\nabla} ^{2} \theta + q_{\textit{IB}}. \end{align}
Here,
 $\boldsymbol{u}(\boldsymbol{x}, t)$
and
 $p(\boldsymbol{x}, t)$
are fluid velocity and pressure, respectively. The normalized temperature is
 $\theta (\boldsymbol{x}, t) = (\varTheta _f(\boldsymbol{x}, t) - \varTheta _{\infty })/(\varTheta _p - \varTheta _{\infty })$
, where
 $\varTheta _p-\varTheta _{\infty }$
is the constant temperature difference between the particle
 $\varTheta _p$
and the ambient fluid
 $\varTheta _{\infty }$
. The source terms
 $\boldsymbol{f}_{\!\textit{IB}}$
and
 $q_{\textit{IB}}$
, respectively, represent the immersed boundary force and temperature source, satisfying the no-slip and constant-temperature boundary condition. Reynolds number is
 $\textit{Re}=U_{C} L_{C}/\nu$
, where
 $\nu$
is the viscosity of fluid. And
 $U_{C},L_{C}$
are characteristic velocity and length, respectively. The Prandtl number is
 ${\textit{Pr}} = \nu / \kappa$
where
 $\kappa$
is temperature diffusivity. The thermal buoyancy is applied along the gravitational direction and
 $\boldsymbol{e}_g$
is the unit vector in the gravitational direction. The Grashof number
 $Gr = g \beta (\varTheta _p - \varTheta _{\infty }) L_{C}^3 / \nu ^2$
can be used to describe the influence of temperature variations on the buoyancy term, where
 $g$
is the magnitude of gravitational acceleration and
 $\beta$
is the thermal expansion coefficient of the fluid. It is worth noting that the thermal-buoyancy term is applied only to the flow field outside the particle.
The particle phase is simulated using an immersed boundary method (IBM), the translational and rotational motions of the rigid sphere are governed by the Newton–Euler equations,
 \begin{align}\rho _{r} {\mathscr{V}_{p}} \frac {{\textrm{d}}\boldsymbol{U}_{\!p}}{{\textrm{d}} t}&= \oint _{\partial{\kern-1pt}{V_p}} {{\boldsymbol{\tau }} \boldsymbol{\cdot }{\boldsymbol{n}}{\textrm{d}} A} +(\rho _{r}-1) Fr {\mathscr{V}_{p}} \boldsymbol{e}_g , \end{align}
 \begin{align}{\mathscr{I}_{p}} \frac {{\textrm{d}}(\boldsymbol{\omega }_p)}{{\textrm{d}} t}&=\oint _{\partial{\kern-1pt}{V_p}} {{{r}} \times \left ( {{\boldsymbol{\tau }} \boldsymbol{\cdot }{\boldsymbol{n}}} \right ){\textrm{d}} A}. \end{align}
Here,
 $\boldsymbol{U}_{\!p}$
and
 $\boldsymbol{\omega }_{p}$
are the particle translational and angular velocity, respectively. The density ratio is
 $\rho _{r}=\rho _{p}/\rho _{f}$
, where
 $\rho _{p}$
and
 $\rho _{f}$
are the densities of particles and fluids, respectively. Here
 ${\mathscr{V}_{p}}$
and
 ${\mathscr{I}_{p}}$
are the volume and moment-of-inertia of the particle. Here,
 $\boldsymbol{r}$
indicates the position vector with respect to the centre of the spheroid and
 $\boldsymbol{n}$
is the outward unit normal vector at the particle surface where the stress tensor,
 $\boldsymbol{\tau }=-p\boldsymbol{I}+(\boldsymbol{\nabla }{\kern-1pt}\boldsymbol{u}+\boldsymbol{\nabla }{\kern-1pt}\boldsymbol{u}^T)/ Re$
, acting on the surface of the particle is integrated. In the buoyancy term, the Froude number is defined as
 $Fr=g L_{C}/U_{C}^2$
. Since only a single particle is considered in this study, particle–particle collision forces and torques are not discussed.
In our study, we assume a constant and uniform temperature on the particle surface, as previously studied by Dan & Wachs (Reference Dan and Wachs2010) and Majlesara et al. (Reference Majlesara, Abouali, Kamali, Ardekani and Brandt2020). This assumption is justified when the specific heat capacity and thermal conductivity of the particles are substantially larger than that of the fluid. Particle diameter
 $D_p$
is considered as the characteristic length
 $L_{C}$
. Following Wachs (Reference Wachs2011), the characteristic velocity
 $U_{C}$
is derived from an estimated balance between inertial and isothermal-buoyancy force,
 \begin{equation} \frac {\rho _f \pi D_p^2 U_{C}^2}{8}=\frac {\pi D_p^3}{6} (\rho _p-\rho _f ) g, \end{equation}
yielding
 $U_{C}=\sqrt {(4/3)\boldsymbol{\cdot }gD_p|\rho _r-1|}$
. The factor
 $(4/3)^{1/2}$
is retained to ensure consistency with conventional scaling in prior studies and is explicitly reflected only in
 $\textit{Re}$
. We introduce Galileo number
 $\textit{Ga}=\sqrt {|\rho _r-1|gD_p^3}/\nu =\sqrt {3/4}Re$
to quantify the relative importance of gravitational forces compared with viscous forces, with higher values indicating a stronger gravitational influence. It is similar to the Archimedes number
 $Ar$
, which characterizes buoyancy-driven dynamics in systems such as fluidization and bubble column design. We define the Richardson number as
 ${\textit{Ri}}=\beta (\varTheta _p - \varTheta _{\infty })/(1-\rho _r)$
to measure the relative influence of thermal buoyancy on particle rising or settling dynamics, where the magnitude
 $|{\textit{Ri}}|=|Gr/\textit{Ga}^2|$
determines the intensity of thermal buoyancy, and the sign indicates whether thermal buoyancy enhances or suppresses particle motion. Although the present definition of
 $|{\textit{Ri}}|$
is consistent with previous studies, we adopt a different sign convention. For example, Kotouč et al. (Reference Kotouč, Bouchet and Dušek2009) associate
 ${\textit{Ri}}\lt 0$
with a destabilizing opposing-flow effect for heated particles, whereas we interpret this same condition as
 ${\textit{Ri}}\gt 0$
, as it leads to an increase in particle settling or rising velocity. Notably, the particles are not always hotter than the flow field when
 ${\textit{Ri}}\gt 0$
, in contrast to
 $Gr$
. In the present study,
 ${\textit{Ri}}\gt 0$
for heavy particles
 $(\rho _r\gt 1)$
corresponds to the cases with the particle temperature
 $\varTheta _p$
is lower than the ambient temperature
 $\varTheta _{\infty }$
, while the case of light particles
 $(\rho _r\lt 1)$
is the opposite, i.e.
 $\varTheta _p \gt \varTheta _{\infty }$
. Besides, the Froude number is
 $Fr=g L_{C}/U_{C}^2 =3/(4|\rho _r-1|)$
. To sum up, the key dimensionless parameters in this system are listed as follows:
 \begin{align}{\textrm{Prandtl number}}\quad {\textit{Pr}} &= \frac {\nu }{\kappa },\nonumber \\[-9pt] \end{align}
 \begin{align}{\textrm{density ratio}}\quad \rho _{r} &=\frac {\rho _{p}}{\rho _{f}},\nonumber \\[-9pt] \end{align}
 \begin{align}{\textrm{Galileo number}}\quad \textit{Ga} &=\frac {\sqrt {|\rho _r-1|gD_p^3}}{\nu },\nonumber \\[-9pt] \end{align}
 \begin{align}{\textrm{Richardson number}}\quad {\textit{Ri}} &=\frac {\beta (\varTheta _p - \varTheta _{\infty })}{1-\rho _r}. \end{align}
2.2. Numerical methods and simulations set-up
The incompressible Navier–Stokes equations (2.1)–(2.3) are solved numerically using a second-order finite difference method following Kim, Baek & Sung (Reference Kim, Baek and Sung2002) and Pan, Kim & Choi (Reference Pan, Kim and Choi2019). Particle–fluid interactions are resolved through an IBM implementation, where the particle surface is discretized by a set of Lagrangian marker points using the method proposed by Eshghinejadfard et al. (Reference Eshghinejadfard, Abdelsamie, Janiga and Thévenin2016). The direct-forcing IBM formulation by Uhlmann (Reference Uhlmann2005) and Breugem (Reference Breugem2012) is adopted for IB force calculation.
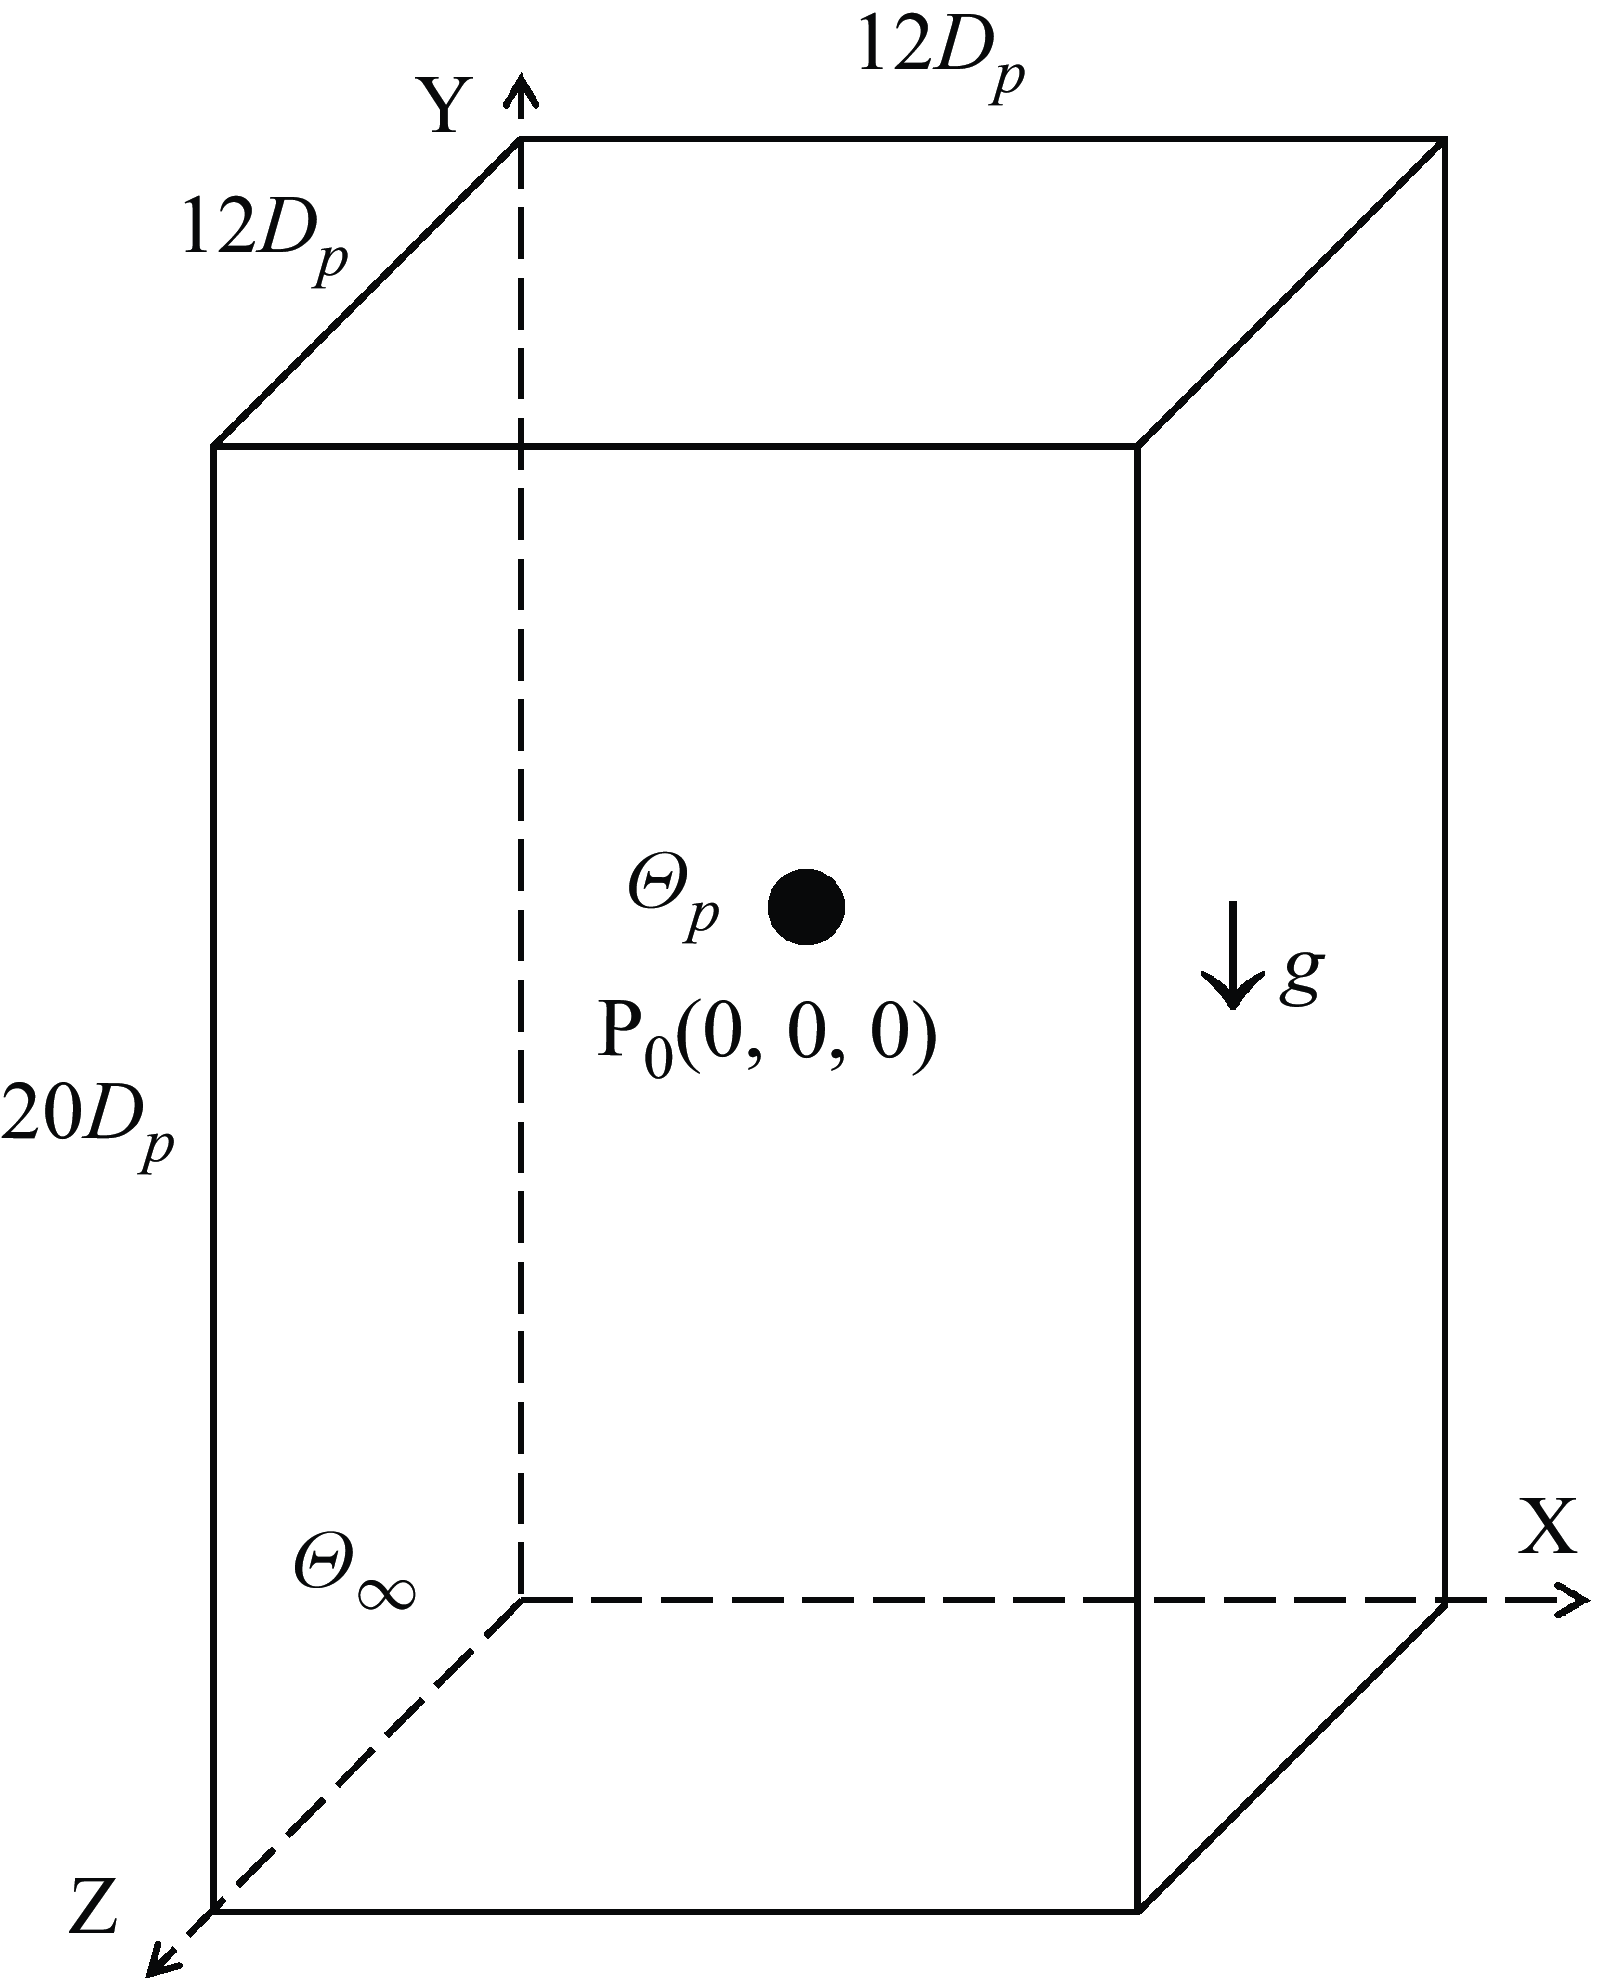
Schematic diagram of a sphere in a vertical semi-infinite channel.

Our particle-resolved direct numerical simulation framework excluding thermal- buoyancy effects has been extensively validated, with detailed methodology and verification cases documented in Jiang et al. (Reference Jiang, Huang, Xu and Zhao2024a ,Reference Jiang, Xu and Zhao b ). Temperature field validation is presented in Appendix A.1, while the heat transfer of particles is validated in Appendix A.2. The developed semi-implicit fluid–solid coupling method for particles with arbitrary density ratios proposed by Tschisgale, Kempe & Fröhlich (Reference Tschisgale, Kempe and Fröhlich2017) is also employed, which has been validated for the rising of a light particle as detailed in Appendix A.2.
This study employs a 3-D semi-infinite domain to simulate a single released sphere freely rising or falling with thermal buoyancy, as shown in figure 1. The computational domain is scaled as
 $12D_p\times 20D_p\times 12D_p$
, with periodic boundary conditions applied in the transverse directions and a semi-infinite boundary in the Y direction. Gravitational acceleration is aligned with the negative Y direction, and the domain moves with the particle to ensure that it remains at a fixed distance from the bottom or top of the computational box. The computational domain employs a spatial resolution of 32 grid cells per particle diameter
 $D_p$
to ensure sufficient resolution of the momentum and thermal boundary layers (Doostmohammadi, Dabiri & Ardekani Reference Doostmohammadi, Dabiri and Ardekani2014).
The particle is released from the centre of a quiescent isothermal fluid
 $(\varTheta _{\infty }=0)$
with a fixed Prandtl number
 $({\textit{Pr}}=1)$
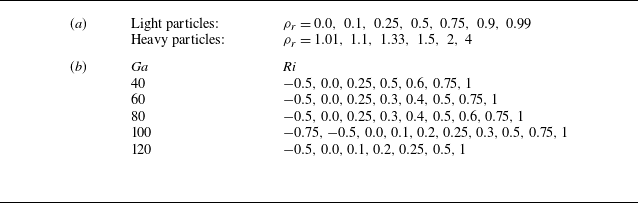
. To isolate the influence of particle inertia, we consider simulations that maintain constant buoyant forcing parameters
 $(\textit{Ga}=60, {\textit{Ri}}=0.5)$
while varying the density ratio across
 $0.0 \leqslant \rho _r \leqslant 4$
in §3.1. When considering the effect of thermal buoyancy and gravity, we focus on light particles with
 $\rho _r = 0.5$
and systematically investigate how variations in
 ${\textit{Ga}}$
and
 ${\textit{Ri}}$
modulate their motion in §3.2. The parameters in this study are summarized in table 1.
Summary of dimensionless parameters in simulations. (a) Varying density ratios
 $\rho _r$
with fixed
 ${\textit{Pr}}=1$
,
 $\textit{Ga}=60$
,
 ${\textit{Ri}}=0.5$
; (b) light particles (
 $\rho _r=0.5$
,
 ${\textit{Pr}}=1$
) with varying
 ${\textit{Ga}}$
and
 ${\textit{Ri}}$
.

3. Results
In the following sections, the subscripts v and
 $h$
denote the vertical (gravity-aligned) and horizontal components, respectively, for both velocity and force quantities. The tilde superscript denotes time-averaged values.
The trajectories of particles with varying density ratios
 $(0.0 \leqslant \rho _r \leqslant 4)$
under fixed buoyancy conditions, i.e.
 ${\textit{Ga}}=60$
, and
 ${\textit{Ri}}=0.5$
. Here, red curves represent 3-D particle trajectories, while orange lines denote their planar projections for density ratios (a)
 $\rho _r = 0.0$
, (b)
 $\rho _r = 0.5$
, (c)
 $\rho _r = 0.9$
, (d)
 $\rho _r = 1.1$
, (e)
 $\rho _r = 2.0$
, (f)
 $\rho _r = 4.0$
.

3.1. Effect of density ratio
In this section, we investigate the dynamics of freely ascending or descending particles with thermal buoyancy
 $({\textit{Ga}}=60, {\textit{Ri}}=0.5)$
across a wide range of density ratios
 $(0.0 \leqslant \rho _r \leqslant 4)$
focusing on the effect of particle inertia. Our analysis begins from examining the trajectory patterns of particles under same buoyant conditions, as shown in figure 2. A significant dependence of path stability on particle inertia is observed. For inertialess particles
 $(\rho _r=0.0)$
, stable zigzag oscillations dominate the ascent dynamics. Moderately inertial particles
 $(\rho _r = 0.5, 0.9)$
transition to 3-D spiral rising patterns. Conversely, particles slightly heavier than the fluid
 $(\rho _r= 1.1,2)$
exhibit spiral settling trajectories with progressively diminishing oscillation amplitudes. Notably, oscillatory motions become nearly imperceptible at
 $\rho _r=4$
, indicating inertial stabilization of the settling path. In conclusion, as the density ratio increases, path instabilities are suppressed, resulting in reduced oscillation or spiralling amplitudes and delayed the onset of instability.
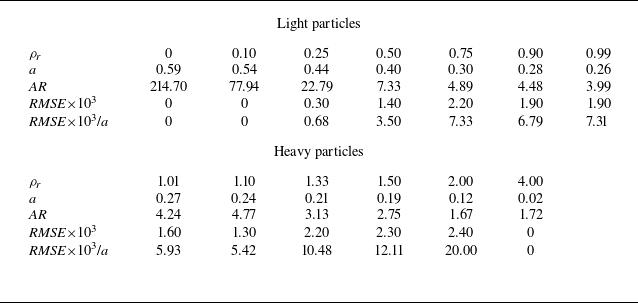
To quantify the deviation of particle motion from a vertical path, we perform an elliptical fitting (Fitzgibbon, Pilu & Fisher Reference Fitzgibbon, Pilu and Fisher1999) of the non-vertical portions of the particle trajectories projected onto the horizontal
 $XZ$
plane. From the fitted ellipses, we extract the semimajor axis length
 $a$
, the aspect ratio (AR), defined as the ratio of the major to minor axis, and the root-mean-square error (RMSE) as a measure of fit quality, defined as
 \begin{equation} {\textit{RMSE}}=\sqrt {\frac {1}{N} \sum _{i=1}^N d_i^2}, \end{equation}
where
 $d_i$
is the minimum Euclidean distance between the
 $i$
th data point and the fitted ellipse, and
 $N$
is the total number of points. As shown in figure 3, increasing the density ratio leads to reductions in both the lateral oscillation amplitude (quantified by
 $a$
) and the aspect ratios, consistent with the qualitative observations discussed earlier.
Particle trajectories projected onto the horizontal
 $XZ$
plane (orange lines) and corresponding ellipse fits (red lines) for various density ratios: (a)
 $\rho _r = 0.0$
, (b)
 $\rho _r = 0.5$
, (c)
 $\rho _r = 1.1$
, (d)
 $\rho _r = 4.0$
.

Ellipse fitting results for particle trajectories in the
 $XZ$
plane. The semimajor axis length
 $a$
,
 $\textit{AR}$
,
 $\textit{RMSE}$
and the normalized error
 $\textit{RMSE}$
/
 $a$
are reported for particles with different density ratios
 $\rho _r$
. Note that
 $\textit{RMSE}$
and
 $\textit{RMSE}$
/
 $a$
are presented in units of
 $10^{-3}$
.

The fitted ellipses effectively capture the dominant geometric features of the motion. For the
 $\rho _r=0.0$
particle, the projected trajectory is nearly linear, exhibiting an extremely large aspect ratio (AR=214.70), characteristic of zigzagging motion. For particles with higher density ratios
 $(\rho _r=0.5, 1.1)$
, the projected trajectories form ellipses with moderate AR and low fitting residuals (RMSE), indicative of spiralling motion. In contrast, the
 $\rho _r=4.0$
particle displays only very weak lateral instability. The oscillation amplitude is minimal (
 $a = 0.02$
), and the motion remains close to vertical. Since the RMSE represents the average deviation of the particle positions from the fitted ellipse, we also computed the dimensionless quantity RMSE/
 $a$
to facilitate comparison across particles with different oscillation amplitudes. A lower value of RMSE/
 $a$
indicates better agreement between the particle trajectory and the fitted ellipse. Overall, the fitting results are satisfactory, and the relevant parameters for various density ratios are summarized in the table 2. For clarity, the values of RMSE and RMSE/
 $a$
reported in the table are scaled by
 $10^3$
.
All particles attain identical dimensionless terminal velocities prior to the onset of instability as shown in figure 4, indicating that steady-state motion under fixed
 ${\textit{Ga}}$
and
 ${\textit{Ri}}$
conditions is independent of particle inertia. However, the effects of particle inertia manifest in the duration required to reach terminal velocity and the time it begins to oscillate. Figure 4(b) provides a zoomed-in view to reveal subtle effects of particle inertia. Particles with low inertia exhibit amplified velocity oscillations and slightly reduced vertical velocities. In contrast, high-inertia particles demonstrate delayed vortex-induced oscillations with attenuated amplitudes, reflecting the enhanced stabilization through the dominance of particle inertia.
Time evolution of particle vertical velocity with varying density ratio. Panel (b) provides a zoomed-in view of panel (a).

Spectrum of the fluctuation of horizontal velocity of particles with different
 $\rho _r$
. Panel (b) provides a zoomed-in view of panel (a) near the frequency peak. At
 $\rho _r=0.0$
, the peak frequency is
 $\bar {f}=0.12$
, with the dominant Strouhal number
 ${\textit{St}}\approx 0.1207$
. The Fourier transform (FFT) was evaluated as
 $X[k] = \sum_{n=0}^{N-1} x[n],w[n],e^{-j2\pi kn/N}$ ($j^2=-1$)
, with a Hanning window
 $w[n]=\tfrac{1}{2}[1-\cos(2\pi n/(N-1))]$
applied.

Complementary to vertical velocity analysis, we systematically investigated the horizontal velocity components in the XZ-plane during particle oscillations. Spectral analysis in figure 5, employing detrending and a Hanning window to avoid spectral leakage, reveals a fundamental frequency peak at
 $\bar {f}=0.12$
across cases except
 $\rho _r=4$
, particularly pronounced for light particles. The dimensionless frequency is defined as
 $\bar {f}=\textit{fL}_C/|U_C|$
, where
 $f$
is the oscillation frequency. Owing to the clearly periodic nature of the motion observed in this set of cases, the Strouhal number is employed to characterize the dynamics of particles. It is defined as
 ${\textit{St}}=\textit{fL}_C/|\widetilde {U_v}|=\bar {f} / (|\widetilde {U_v}|/U_C)$
. Under the present conditions, the Strouhal number exhibits a slight decreasing trend with increasing density ratio, ranging from 0.1207 at
 $\rho _r=0\,{\rm to}\,0.1142$
at
 $\rho _r=2$
. These values are of the same order of magnitude as those reported by Kotouč et al. (Reference Kotouč, Bouchet and Dušek2009), though slightly higher, likely due to differences in Prandtl number and the fact that the particle is freely moving in the present study. Furthermore, as illustrated in figure 5(b), the amplitude of the primary frequency progressively attenuates with increasing density ratios. Notably, a secondary low-frequency component (
 $\bar {f}\lt 0.05$
) develops at mediate density ratios, as indicated by the inset in figure 5(a). This phenomenon is reminiscent of the tertiary instability observed in the wake instability of particles. This subharmonic signature is associated with spiralling motion superposed on the primary oscillatory trajectory, suggesting inertial modification of 3-D instability modes.
(a) Time evolution of the horizontal component of the hydrodynamic force
 $\boldsymbol{F}^H$
acting on particles with different density ratios. (b) Spectrum of the horizontal hydrodynamic force and (c) its zoomed-in view.

We also examine the hydrodynamic force
 $\boldsymbol{F}^H$
, defined as
 \begin{equation} \boldsymbol{F}^H = \oint _{\partial{\kern-1pt}{V_p}} {{\boldsymbol{\tau }} \boldsymbol{\cdot }{\boldsymbol{n}}{\textrm{d}} A}. \end{equation}
Although the vertical component of the hydrodynamic force is approximately 20 times greater than the horizontal component (not shown), it primarily acts as resistance to settling or rising. The horizontal component, in contrast, plays a direct role in influencing the lateral motion of the particle. Therefore, here we focus on the horizontal hydrodynamic force
 $\boldsymbol{F}^H_h$
, as illustrated in figure 6(a). Once the particle becomes unstable, this force initially increases and then exhibits periodic oscillations, closely corresponding to the fluctuations in the horizontal particle velocity. A spectral analysis of the horizontal hydrodynamic force is presented in figures 6(b) and 6(c), where figure 6(c) provides an enlarge view of the spectrum in the range
 $0\leqslant \bar {f} \leqslant 0.15$
. A dominant spectral peak at
 $\bar {f} \approx 0.12$
is observed, consistent with the primary oscillation frequency of the velocity signal. Particles with density ratios closer to unity experience stronger horizontal hydrodynamic forces, while those with density ratios further from one exhibit weaker horizontal forces. For the lightest case (
 $\rho _r = 0$
), the hydrodynamic force is minimal, yet the horizontal oscillation is most pronounced (see figure 5
c) due to the very low particle inertia. Conversely, for the heaviest case (
 $\rho _r = 4$
), its settling motion is dominated by particle inertia in the vertical direction, resulting in both weak horizontal forces and minimal lateral oscillations. In addition, a secondary low-frequency peak appears within
 $0\leqslant \bar {f} \leqslant 0.05$
, particularly for heavy particles
 $(\rho _r \gt 1)$
. This component is associated with the spiralling motion observed during particle settling.
Wake visualized using the Q criterion (Iso-Q surface,
 $Q=0.12$
, coloured by the local value of vertical velocity): (a,b)
 $\rho _r = 0.5$
; (c,d)
 $\rho _r = 2.0$
. The black spheres denote particle positions, while (a) and (c) present cross-sectional views in the Z–Y plane, and (b) and (d) present cross-sectional views in the X–Y plane.

To further investigate particle–fluid interactions, we visualize the wake dynamics of a light particle
 $(\rho _r=0.5)$
and a heavy particle
 $(\rho _r=2.0)$
using a
 $Q=0.12$
isosurface (vortex identification criterion), coloured by the vertical velocity component, as shown in figure 7. Note that these are given the same buoyancy conditions, i.e.
 ${\textit{Ga}}=60$
, and
 ${\textit{Ri}}=0.5$
. Under thermal buoyancy
 $({\textit{Ri}}=0.5)$
, both particles exhibit periodic vortex shedding at
 ${\textit{Ga}}=60$
, directly driving oscillatory motion. Spectral analysis of fixed-probe velocity signals within the particle wakes reveals a fundamental frequency
 $\bar {f}=0.06$
, precisely half the horizontal oscillation frequency of particles. This oscillation behaviour is similar to the horizontal oscillation during the settlement of a single cold particle in a two-dimensional channel, as described by Gan et al. (Reference Gan, Chang, Feng and Hu2003). The natural convection stemming from thermal buoyancy induces high pressure at the back stagnation point of the particles. The high-pressure counterbalance between the front and back stagnation points causes a ‘buckling instability’, which in turn prompts vortex shedding and subsequent wake oscillations (Gan et al. Reference Gan, Chang, Feng and Hu2003). Initially, the particles commence horizontal rotation, as illustrated in figure 8(a). When the rotational degrees of freedom of the particles are restricted, the onset of oscillation is postponed and the oscillation amplitude is amplified, as depicted in figure 8(b).
(a) Particle rotation velocity
 $(\rho _r=0.5,{\textit{Ga}}=60,{\textit{Ri}}=0.5)$
. (b) Comparison of the time evolution of particles vertical velocity in the presence or absence of particle rotation.

Under thermal buoyancy with positive Richardson number, particle inertia significantly influences path stability, oscillation characteristics and wake dynamics even for particles with
 ${\textit{Ga}}=60$
. This may be attributed to the fact that thermal buoyancy enhances the particle velocity and promotes the onset of wake instability. As discussed in Dan & Wachs (Reference Dan and Wachs2010), the acceleration or deceleration of particle velocities is fundamentally influenced by the alignment of natural convection flows with the gravity-dominated motion. In our simulations with
 ${\textit{Ri}}=0.5$
, hot particles generate ascending natural convection plumes when rising, whereas cold particles exhibit descending convective flows when falling. Velocity amplification occurs when the thermal-buoyancy-driven flow direction aligns synergistically with the rising or settling velocity, leading to wake instability and complex kinematic patterns.
3.2. Effect of thermal buoyancy and gravity
Given the sensitivity of light particles to thermal-buoyancy effects, we examine a series of cases of light particles
 $(\rho _r =0.5)$
under various
 ${\textit{Ga}}$
and
 ${\textit{Ri}}$
to elucidate the effects of thermal buoyancy and gravity. Figure 9 presents the particle trajectories for the cases with
 ${\textit{Ga}} = 40$
and
 ${\textit{Ga}} = 100$
as examples. In general, increasing the Richardson number
 $({\textit{Ri}})$
induces progressive transitions of the ascent patterns of particles: from stable vertical rising to 3-D spiralling or planar zigzagging, and ultimately chaotic rising. For particles with
 ${\textit{Ga}}=40$
, stronger buoyancy forcing
 $({\textit{Ri}} \gtrsim 0.5)$
is required to initiate path instabilities, marked by the emergence of horizontal velocity fluctuations. Whereas
 ${\textit{Ga}}=100$
particles exhibit lower destabilization thresholds, entering fully developed chaotic ascent regimes at
 ${\textit{Ri}}=0.5$
. This contrast highlights the dual control of thermal buoyancy and gravity: higher
 ${\textit{Ga}}$
amplifies instability susceptibility by enhancing momentum advection, while increased
 ${\textit{Ri}}$
accelerates shear layer destabilization through the generation of thermal convection.
The trajectories of light particles
 $(\rho _r=0.5)$
with varying buoyant forces: (a–c)
 ${\textit{Ga}}=40$
and
 ${\textit{Ri}}=0.5/ 0.75/ 1.0$
; (d–f)
 ${\textit{Ga}}=100$
and
 ${\textit{Ri}}=0.1/ 0.25/ 0.5$
.

Similarly, we fit ellipses to the horizontal projection of trajectories (
 $XZ$
plane) of light particles
 $(\rho _r =0.5)$
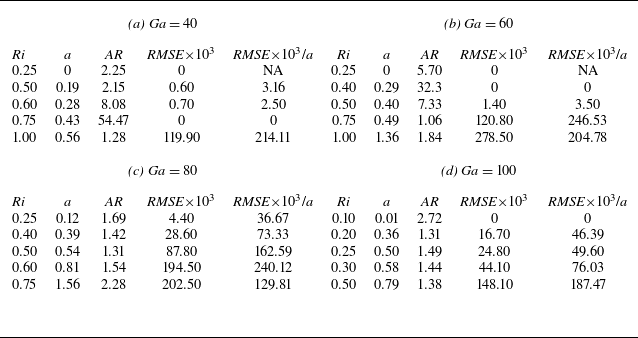
under varying gravitational and thermal-buoyancy effects. The corresponding parameters, including the semimajor axis length
 $a$
, AR, RMSE and the normalized error RMSE/
 $a$
are summarized in table 3. For the classification purposes, the stable vertical regime is defined as the cases with
 $a\lt 0.02$
, the zigzagging regime is characterized by AR
 ${\gt }\, 30$
and RMSE
 $\times\, 10^3$
/
 $a\lt 0.1$
, the spiralling regime corresponds to AR between 1 and 30 with RMSE
 $\times\, 10^3$
/
 $a\lt 100$
, and the chaotic regime is defined by AR
 ${\lt }\, 5$
and RMSE
 $\times\, 10^3$
/
 $a\gt 100$
. These four regimes are mapped in figure 10, where the black regions denote stable vertical rising and green regions correspond to 3-D chaotic rising. It is worth noting that the transition between the zigzagging and spiralling regimes is not sharply resolved within the current parameter space. Furthermore, flow regimes such as the stable oblique regime, commonly observed under isothermal conditions, are not observed in the present study, in agreement with the numerical results reported by Majlesara et al. (Reference Majlesara, Abouali, Kamali, Ardekani and Brandt2020).
Ellipse fitting results for light particles (
 $\rho _r=0.5$
) rising under different effects of gravity (
 ${\textit{Ga}}$
) and thermal buoyancy (
 ${\textit{Ri}}$
). The semimajor axis length
 $a$
,
 $\textit{AR}$
,
 $\textit{RMSE}$
and normalized error
 $\textit{RMSE}$
/
 $a$
are reported. Note that
 $\textit{RMSE}$
and
 $\textit{RMSE}$
/
 $a$
are presented in units of
 $10^{-3}$
.

To further investigate the relationship between particle motion and horizontal hydrodynamic forces, we examine the temporal evolution of the angle between the horizontal hydrodynamic force vector and the horizontal particle velocity vector during the rising motion of light particles (
 $\rho _r = 0.5$
). This angle, denoted as
 $\theta _{\textit{FV}}$
, is defined as
 \begin{equation} \theta _{\textit{FV}}(t)=\cos ^{-1}\left (\frac {\boldsymbol{F}^H_h \boldsymbol{\cdot }\boldsymbol{U}_h}{\left |\boldsymbol{F}^H_h\right |\left |\boldsymbol{U}_h\right |}\right )\!, \end{equation}
Regime map of the rising behaviour of a light sphere
 $(\rho _r=0.5)$
in an infinite domain with thermal buoyancy in the (
 ${\textit{Ga}},{\textit{Ri}}$
) parameter plane. The annotations are as follows: SV, stable vertical; ZZ, zigzagging; SP, spiralling; 3DC, 3-D chaotic.

where
 $\boldsymbol{F}^H_h$
and
 $\boldsymbol{U}_h$
represent the horizontal components of the hydrodynamic force and particle velocity, respectively. In the stable vertical regime, where the horizontal hydrodynamic force is negligible, the angle
 $\theta _{\textit{FV}}$
appears randomly distributed between 0
 $^\circ$
to 180
 $^\circ$
, reflecting the absence of lateral forcing. In contrast, in the zigzagging and spiralling regimes,
 $\theta _{\textit{FV}}$
exhibits periodic or quasiperiodic variations, as illustrated in figure 11. For the zigzagging regime, the angle oscillates periodically between 0
 $^\circ$
and 180
 $^\circ$
, indicating that the horizontal force primarily acts as drag – resisting motion without inducing deviation from the main oscillation direction. Interestingly, even within this regime, subtle differences are evident. For instance, the case
 $({\textit{Ga}}, {\textit{Ri}}) = (60, 0.4)$
shows a slight angular offset compared with
 $({\textit{Ga}}, {\textit{Ri}}) = (40, 0.75)$
, indicating a tendency towards the spiralling behaviour. This transition is further evidenced by the corresponding horizontal trajectory aspect ratios: AR=32.30 for
 $(60, 0.4)$
is nearly half that of
 $(40, 0.75)$
, for which AR=54.47. In the spiralling regime, the angle
 $\theta _{\textit{FV}}$
oscillates between approximately 20
 $^\circ$
and 160
 $^\circ$
, indicating that the hydrodynamic force includes both resistive and deflective components in the horizontal plane. This periodic deflection may be driven by the combined effects of vortex shedding, path instability and asymmetries in the incoming flow. Notably, although the case
 $({\textit{Ga}}, {\textit{Ri}}) = (60, 0.5)$
initially exhibits spiralling motion, it gradually transitions to a zigzag-like rising pattern at later times. We interpret this evolution as the result of a competition between thermal-buoyancy-induced asymmetric instabilities and the planar symmetry imposed by vortex shedding. At early stages, thermal buoyancy dominates, promoting vortex shedding and lateral deviations. However, as the vortex field intensifies, it tends to restore planar symmetry, thereby altering the long-term particle trajectory. Furthermore, as
 ${\textit{Ga}}$
increases, the periodicity of
 $\theta _{\textit{FV}}$
becomes progressively disrupted, suggesting a transition towards the chaotic regime. For the chaotic regime (not shown), the angle
 $\theta _{\textit{FV}}$
no longer displays clear periodicity but instead shows a broad, near-random distribution, revealing a complex and irregular interaction between horizontal force and motion.
Temporal evolution of the angle
 $\theta _{\textit{FV}}$
for light particles
 $(\rho _r=0.5)$
under different combinations of
 $({\textit{Ga}}, {\textit{Ri}})$
, categorized as (a) zigzagging and (b) spiralling regimes.

Instantaneous contours of vertical fluid velocity in the X–Y plane of
 ${\textit{Ga}}=40$
light particles
 $(\rho _r=0.5)$
with different
 ${\textit{Ri}}$
: (a)
 ${\textit{Ri}}=0.5$
, (b)
 ${\textit{Ri}}=0.75$
, (c)
 ${\textit{Ri}}=1.0$
. White solid lines indicate zero relative vertical velocity (
 $u_{v,r}=|U_v-v|=0$
), while black solid lines represent temperature contours ranging from 0.1 to 0.9.

The time-averaged recirculation length
 $\widetilde {L_v}$
, the normalized length
 $\widetilde {L_v}/\widetilde {L_{v0}}$
, and its standard deviation Std(
 $\widetilde {L_v}$
) for light particles
 $(\rho _r=0.5)$
at various
 ${\textit{Ga}}$
and
 ${\textit{Ri}}$
. Here
 $\widetilde {L_{v0}}$
denotes the value at
 ${\textit{Ri}} = 0$
.

Instantaneous iso-Q surface (
 $Q=0.12$
) of
 ${\textit{Ga}}=40$
light particles
 $(\rho _r=0.5)$
with different
 ${\textit{Ri}}$
: (a)
 ${\textit{Ri}}=0.5$
, (b)
 ${\textit{Ri}}=0.75$
, (c)
 ${\textit{Ri}}=1.0$
. Panel (d) provides a vertical side view of case (c). The black spheres denote particle positions, and the surfaces coloured by the local value of vertical velocity.

We analyse instantaneous flow fields during the ascent of
 ${\textit{Ga}}=40$
particles to elucidate thermal-buoyancy effects. Figure 12 presents XY-plane slices at increasing three buoyancy intensities
 $({\textit{Ri}}=0.5/0.75/1.0)$
with vertical velocity colormaps. The corresponding 3-D vortex structures in figure 13 are visualized using
 $Q = 0.12$
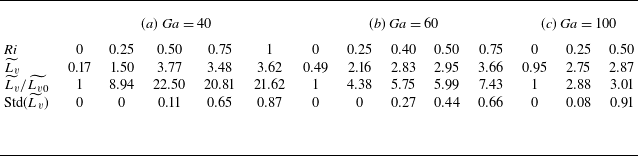
isosurfaces coloured by vertical velocity. Thermal buoyancy drives convection around the hot particle: heated fluid is advected from the rear of the sphere to the shear region, while colder ambient fluid is entrained into the wake. This mechanism intensifies the recirculation with increasing
 ${\textit{Ri}}$
, as evidenced by the stronger vertical velocities within the high-velocity regions (outlined by white contours) with higher
 ${\textit{Ri}}$
in figure 12. To further quantify this effect, we computed the time-averaged recirculation length
 $\widetilde {L_v}$
, defined as the maximum distance from the sphere surface to the point where the relative vertical velocity (
 $u_{v,r}=|U_v-v|=0$
) is zero. The results are summarized in table 4. For the isothermal cases (
 ${\textit{Ri}} = 0$
), the length
 $\widetilde {L_v}$
increases monotonically with
 ${\textit{Ga}}$
without vortex shedding. For a given
 ${\textit{Ga}}$
,
 $\widetilde {L_v}$
also increases with
 ${\textit{Ri}}$
, indicating that thermal buoyancy strengthens and extends the recirculation zone. An exception is observed at
 $({\textit{Ga}}, {\textit{Ri}}) = (40, 0.5)$
, where the length
 $\widetilde {L_v}$
is longer than those for
 $(40, 0.75)$
and even
 $(40, 1.0)$
. This irregularity results from the onset of unsteady vortex shedding, which introduces fluctuations in the wake and affects the recirculation length under the present definition. A similar trend was reported by Chouippe et al. (Reference Chouippe, Krayer, Uhlmann, Dušek, Kiselev and Leisner2019). The normalized length
 $\widetilde {L_v}/\widetilde {L_{v0}}$
, where
 $\widetilde {L_{v0}}$
corresponds to the isothermal case
 $({\textit{Ri}}=0)$
, also increases significantly with increasing
 ${\textit{Ri}}$
. However, the relative enhancement becomes less pronounced at higher
 ${\textit{Ga}}$
. Specifically, for
 ${\textit{Ri}} = 0.25$
and
 $0.5$
, the normalized length
 $\widetilde {L_v}/\widetilde {L_{v0}}$
decreases as
 ${\textit{Ga}}$
increases. Interestingly, the length
 $\widetilde {L_v}$
shows
 ${\textit{Ri}}$
-dependent trends: it increases with
 ${\textit{Ga}}$
at
 ${\textit{Ri}} = 0.25$
but decreases at
 ${\textit{Ri}} = 0.5$
, again reflecting the influence of wake instability. Moreover, the standard deviation of
 $\widetilde {L_v}$
also increases with both
 ${\textit{Ga}}$
and
 ${\textit{Ri}}$
, reflecting the development of stronger fluctuations and enhanced wake unsteadiness. These trends emphasize the destabilizing role of thermal buoyancy. Vorticity fields in figure 13 reveal that vortex shedding is modulated with
 ${\textit{Ri}}$
, deviating from the classical dynamics observed in isothermal cases at
 ${\textit{Ga}}=40$
. As thermal buoyancy increases
 $({\textit{Ri}}\gt 0)$
, vortex shedding becomes more intense and increasingly non-axisymmetric. The cases with
 ${\textit{Ri}} = 0.5$
and
 ${\textit{Ri}} = 1.0$
exhibit more pronounced asymmetries, corresponding to spiralling and chaotic regimes, respectively. In particular, at
 ${\textit{Ri}} = 0.5$
, the symmetry of the vortex ring is disrupted, although the shedding remains relatively organized. In contrast, at
 ${\textit{Ri}} = 1.0$
, even the planar symmetry of the shedding is disrupted, indicating a fully chaotic regime. By comparison, the case with
 ${\textit{Ri}} = 0.75$
maintains an approximately planar-symmetric structure, indicating that thermal buoyancy has a weaker influence on the vortex configuration in this intermediate regime. Enhanced vertical flow also leads to elevated temperatures within vortex cores, as indicated by black isotherms in figure 12. Collectively, these observations highlight the critical role of thermal buoyancy-induced convection in modifying wake dynamics and triggering path instabilities.
In addition, we present instantaneous iso-Q surface for the
 ${\textit{Ga}}=60$
cases to further investigate the transitions between different regimes. As illustrated in the regime map (figure 10), an inversion in the sequence of regimes is observed as
 ${\textit{Ga}}$
increases. At
 ${\textit{Ga}}=40$
, the particle transitions from stable vertical motion to spiralling, then to zigzagging and finally to chaotic motion (3-D chaotic) with increasing
 ${\textit{Ri}}$
. In contrast, for
 ${\textit{Ga}}=60$
, spiralling appears before zigzagging motion. This inversion can be explained by the interplay between thermal buoyancy-induced asymmetric instabilities and the planar symmetries enforced by vortex shedding. At low
 ${\textit{Ga}}$
, thermal buoyancy triggers a buckling instability that breaks the axial symmetry of the vortex ring, as illustrated in figure 13(a). Therefore, the particle exhibits spiralling motion which becomes more pronounced with increasing
 ${\textit{Ri}}$
, as evidenced by the increasing semimajor axis length
 $a$
and AR in the
 ${\textit{Ga}}=40$
cases (table 3). For the case with
 ${\textit{Ri}}=0.75$
, vortex shedding becomes more pronounced, but thermal buoyancy has weak impact on the planar symmetry of the shedding vortices. As a result, the motion is predominantly zigzagging, as shown in figure 13(b). At higher
 ${\textit{Ga}}$
, vortex shedding develops earlier and enforcing planar symmetry at moderate
 ${\textit{Ri}}$
, as illustrated in figures 14(a) and 14(b). These two cases thus exhibit transitional behaviour between spiralling and zigzagging, as discussed above. As
 ${\textit{Ri}}$
further increases, thermal buoyancy eventually breaks the symmetry, inducing more chaotic motion with increasing
 $a$
but decreasing AR. This is further supported by instantaneous vorticity structure in figure 14(c).
Instantaneous iso-Q surface (
 $Q=0.12$
) of
 ${\textit{Ga}}=60$
light particles
 $(\rho _r=0.5)$
with different
 ${\textit{Ri}}$
: (a)
 ${\textit{Ri}}=0.4$
, (b)
 ${\textit{Ri}}=0.5$
, (c)
 ${\textit{Ri}}=0.75$
.

The vertical velocities of particles at
 ${\textit{Ga}}=40$
and
 $100$
modulated by thermal buoyancy with varying
 ${\textit{Ri}}$
are compared in figure 15. Increasing
 ${\textit{Ri}}$
, which means stronger positive thermal buoyancy, enhances ascent velocities while inducing progressive transitions from stable vertical to zigzagging or spiralling, and ultimately chaotic rising. For the
 ${\textit{Ga}}=100$
cases, we also present the results for negative thermal-buoyancy effect
 $({\textit{Ri}}=-0.5)$
, corresponding to a light particle that is colder than the surrounding fluid. In this configuration, thermal buoyant suppression manifests through inhibited cold fluid entrainment into shear layers, attenuating recirculation intensity and reducing the terminal velocity to 0.72
 $U_{g,0}$
(versus
 $U_{g,0}$
at
 ${\textit{Ri}}=0$
). This counterflow mechanism contrasts with positive
 ${\textit{Ri}}$
behaviour, demonstrating bidirectional control of dynamics of particles via the orientation of thermal buoyancy-induced convection.
Vertical velocity of particles for different
 ${\textit{Ri}}$
: (a)
 ${\textit{Ga}}=40$
; (b)
 ${\textit{Ga}}=100$
.

Time-averaged vertical velocity
 $|\widetilde {U_v}|$
of light particles (
 $\rho _r=0.5$
) under negative thermal buoyancy (
 ${\textit{Ri}}\lt 0$
), plotted against
 ${\textit{Ga}}$
for various
 ${\textit{Ri}}$
. Green diamonds represent the cases without thermal buoyancy (
 ${\textit{Ri}} = 0$
), blue circles correspond to
 ${\textit{Ri}} = -0.5$
, black markers show corresponding results for heavy particles (
 $\rho _r = 1.5$
) at
 ${\textit{Ga}} = 60$
and the purple star represents
 ${\textit{Ri}} = -0.75$
at
 ${\textit{Ga}} = 100$
.

Under negative
 ${\textit{Ri}}$
, particles consistently reach a steady regime within the explored parameter space. Figure 16 summarizes the variation of the time-averaged vertical velocity
 $|\widetilde {U_v}|$
of light particles (
 $\rho _r=0.5$
) with respect to both
 ${\textit{Ga}}$
and
 ${\textit{Ri}}$
. It can be seen that as
 ${\textit{Ga}}$
decreases, the suppressive effect of negative thermal buoyancy on particle vertical velocity becomes more pronounced. We also compute the settling velocity of heavy particles (
 $\rho _r=1.5$
) at
 ${\textit{Ga}} = 60$
. The results closely mirror those observed for light particles (
 $\rho _r=0.5$
), as indicated by the black markers in figure 16. Additionally, simulations with stronger negative thermal buoyancy (
 ${\textit{Ri}} = -0.75$
) for the light particle (
 $\rho _r=0.5$
) at
 ${\textit{Ga}}=100$
confirm further suppression of particle velocity, though the motion remains steady (see the purple star in figure 16). To further illustrate the flow behaviour, figure 17 presents instantaneous contours of vertical fluid velocity during the rising process. With increasing
 ${\textit{Ga}}$
, convective heat transfer intensifies, resulting in a thinner and more elongated thermal wake. The zero-relative vertical velocity isosurface tightly concentrated around the particle surface, indicating that the downward motion of cold fluid nearly eliminates the recirculation zone. Furthermore, a larger
 $|{\textit{Ri}}|$
leads to faster descent of the cold fluid. Particles attain a steady and axisymmetric regime in all the cases studied. We did not observe the 3-D regimes (
 $m \geqslant 1$
modes) reported by Kotouč et al. (Reference Kotouč, Bouchet and Dušek2009) in their §7, likely due to the relatively low particle Reynolds number in the present simulations.
Instantaneous contours of vertical fluid velocity in the X–Y plane of light particles
 $(\rho _r=0.5)$
under negative thermal buoyancy at various
 ${\textit{Ga}}$
and
 ${\textit{Ri}}$
: (a)
 ${\textit{Ga}}=40$
and
 ${\textit{Ri}}=-0.5$
; (b)
 ${\textit{Ga}}=60$
and
 ${\textit{Ri}}=-0.5$
; (c)
 ${\textit{Ga}}=100$
and
 ${\textit{Ri}}=-0.5$
; (d)
 ${\textit{Ga}}=100$
and
 ${\textit{Ri}}=-0.75$
. White solid lines indicate zero relative vertical velocity (
 $u_{v,r}=|U_v-v|=0$
), which are closely aligned with the particle surface. Black solid lines represent temperature contours ranging from –0.1 to –0.9.

Time-averaged particle Reynolds number (
 $\widetilde {{\textit{Re}}_p}$
) and Strouhal numbers (
 ${\textit{St}}$
) for particles at
 ${\textit{Ga}} = 40$
and
 $60$
. Here NA indicates that no dominant frequency could be identified.

Spectrum of the fluctuation of horizontal velocity of particles for different
 ${\textit{Ri}}$
: (a)
 ${\textit{Ga}}=40$
; (b)
 ${\textit{Ga}}=100$
.

Horizontal velocity oscillations exhibit monotonic amplification with increasing
 ${\textit{Ri}}$
as shown in figure 18, demonstrating direct correlation between the intensity of thermal buoyancy and path instability. Notably,
 ${\textit{Ga}}=100$
particles transition to chaotic motion occurring more immediately than
 ${\textit{Ga}}=40$
particles. The transitional stages (e.g. planar oscillations, spiralling trajectories) are negligible for particles with higher
 ${\textit{Ga}}$
. Furthermore, the spectra indicate that particles at lower
 ${\textit{Ga}}$
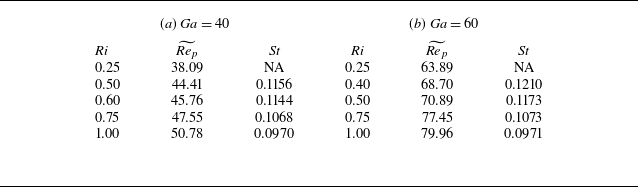
exhibit more distinct periodic or quasiperiodic behaviour. Accordingly, we also evaluated the Strouhal numbers for these cases. The time-averaged particle Reynolds number and Strouhal number for particles at
 ${\textit{Ga}} = 40$
and
 $60$
under various Richardson numbers are summarized in the table 5. As
 ${\textit{Ri}}$
increases, the Reynolds number increases while the Strouhal number exhibits a slight decrease. This trend is consistent with the observations reported by Kotouč et al. (Reference Kotouč, Bouchet and Dušek2009) in their §8.
As discussed in the above, particles with higher
 ${\textit{Ga}}$
exhibit reduced destabilization thresholds under identical
 ${\textit{Ri}}$
condition compared with the particles with lower
 ${\textit{Ga}}$
. To isolate gravitational effects, we perform comparative analysis of vertical ascent velocities and horizontal velocity spectrum under fixed
 ${\textit{Ri}}=\{0.25,0.5\}$
across varying Galileo numbers
 $(40 \leqslant {\textit{Ga}} \leqslant 120)$
, as shown in figure 19. We also examine several cases with the same classification but distinct dynamics, i.e.
 $({\textit{Ga}},{\textit{Ri}})=(40,0.5)$
,
 $(60,0.5)$
and
 $(100,0.25)$
. Although all fall within the spiralling regime in the regime map (figure 10), their vertical velocity (figure 19
a,b) reveal notable differences. The case of
 $({\textit{Ga}}, {\textit{Ri}}) = (40, 0.5)$
develops more slowly, with weak periodic oscillations in vertical velocity appearing only after
 $tU_C/L_C \approx 250$
, and with limited amplitude. By contrast, the
 $({\textit{Ga}}, {\textit{Ri}}) = (60, 0.5)$
case shows clearer periodicity and stronger deviations, while the
 $({\textit{Ga}}, {\textit{Ri}}) = (100, 0.25)$
case exhibits irregular, non-periodic oscillations, consistent with stronger vortex shedding and enhanced flow unsteadiness. The horizontal frequency spectra (figure 19
c,d) further support these observations, highlighting differences in dominant spectral peaks. With constant buoyancy forcing
 $({\textit{Ri}})$
, increasing
 ${\textit{Ga}}$
amplifies ascent velocities and modifying path instability progressions. Lower
 ${\textit{Ga}}$
particles exhibit periodic zigzagging or spiralling motions characteristic of buoyancy-modulated vortex shedding. While particles with higher
 ${\textit{Ga}}$
transition to chaotic ascent at reduced thermal buoyancy intensities. The stability of particle trajectories is governed by the synergistic interplay between gravitational forcing and thermal buoyancy, and the accelerated chaotic onset at elevated
 ${\textit{Ga}}$
suggests gravitational amplification of thermal convection effects through momentum advection.
Vertical velocities (a,b) and horizontal velocity spectrum (c,d) under different Richardson number: (a,c)
 ${\textit{Ri}}=0.25$
; (b,d)
 ${\textit{Ri}}=0.5$
.

We also examine the magnitude of the horizontal hydrodynamic force (not shown), which exhibits similar trends to that of the horizontal particle velocity. For a given Galileo number, the horizontal force increases with stronger thermal buoyancy (larger
 ${\textit{Ri}}$
), and the force signal becomes more periodic at lower
 ${\textit{Ga}}$
. In contrast, for larger
 ${\textit{Ga}}$
, the particle experiences enhanced horizontal forcing accompanied by augmented chaotic motions.
3.3. Heat transfer coefficient
Complementary heat transfer analysis examines the time-averaged particle Reynolds numbers
 $(\widetilde {{\textit{Re}}_p})$
and corresponding Nusselt numbers
 $(\widetilde {\textit{Nu}})$
during the ascent of light particles
 $(\rho _r = 0.5)$
across varying
 ${\textit{Ri}}$
and
 ${\textit{Ga}}$
, as shown in figure 20. Nusselt number
 $\textit{Nu}$
, measuring the efficiency of heat transfer between fluid and particle, is defined as
 \begin{equation} \textit{Nu}(t) = \frac {\int _S \textit{Nu}_{loc} {\textrm d}S}{\pi D_p^2 } = \int _S(- \bar {\boldsymbol{\nabla }} \theta \boldsymbol{\cdot }\boldsymbol{n}) {\textrm d}\bar {S}. \end{equation}
Time-averaged (a) particle Reynolds number
 $(\widetilde {{\textit{Re}}_p})$
and (b) corresponding Nusselt number
 $(\widetilde {\textit{Nu}})$
during the rising of light particles
 $(\rho _r=0.5)$
under varying thermal buoyancy
 $({\textit{Ri}})$
and Galileo number
 $({\textit{Ga}})$
. (c) Projection of the data onto the
 $(\widetilde {{\textit{Re}}_p}, \widetilde {\textit{Nu}})$
plane. (d) Three-dimensional representation of the coupled dependence of
 $\widetilde {\textit{Nu}}$
on
 $\widetilde {{\textit{Re}}_p}$
,
 ${\textit{Ga}}$
and
 ${\textit{Ri}}$
.

The dimensionless temperature gradient distribution
 $\bar {\boldsymbol{\nabla }} \theta$
on the particle surface is mainly influenced by convective transport and thermal conduction. For the isothermal case
 $({\textit{Ri}}=0)$
, the Nusselt numbers
 $(\textit{Nu})$
align closely with classical empirical correlations, such as the Ranz–Marshall equation (Rans & Marshall Reference Rans and Marshall1952),
 $\textit{Nu} = 2.0 + 0.6\textit{Re}^{0.5}{\textit{Pr}}^{0.33}(10 \lt \textit{Re} \lt 10^4,{\textit{Pr}} \gt 0.7)$
, validating the baseline of heat transfer. Figure 20(d) presents a 3-D diagram illustrating the relationship among
 ${{\textit{Ga}}}$
,
 $\widetilde {{\textit{Re}}_p}$
and
 $\widetilde {\textit{Nu}}$
, with figure 20(a–c) corresponding to its projections onto the respective parameter planes. As shown in figure 20(a), positive thermal buoyancy (
 ${\textit{Ri}} \gt 0$
) increases
 $\widetilde {{\textit{Re}}_p}$
relative to the isothermal case (
 ${\textit{Ri}} = 0$
), consistent with the recirculation-induced particle velocity enhancement mechanism discussed previously. In contrast, for negative thermal buoyancy (
 ${\textit{Ri}} = -0.5$
),
 $\widetilde {{\textit{Re}}_p}$
is significantly reduced, aligning with previous observations that stabilizing thermal buoyancy suppresses the average particle vertical velocity. At a fixed
 ${\textit{Ga}}$
, the Nusselt number
 $\widetilde {\textit{Nu}}$
generally increases with
 ${\textit{Ri}}$
(figure 20
b), reflecting the strengthened convective transport induced by thermal-buoyancy-enhanced recirculation. However, a different trend emerges when viewed at equivalent Reynolds numbers
 $\widetilde {{\textit{Re}}_p}$
, as in figure 20(c). For
 ${\textit{Ri}} \gt 0$
, particles with low
 ${\textit{Ga}}$
exhibit slightly lower
 $\widetilde {\textit{Nu}}$
than the empirical predictions at the same
 $\widetilde {{\textit{Re}}_p}$
, highlighting the complex interplay between thermal buoyancy and heat transfer. Conversely, for
 ${\textit{Ri}}\lt 0$
, the
 $\widetilde {\textit{Nu}}$
consistently exceeds empirical values at equivalent
 $\widetilde {{\textit{Re}}_p}$
.
When considering thermal-buoyancy effects with
 ${\textit{Ri}} \gt 0$
on heat transfer, there are two competing mechanisms: thermal buoyancy enhanced wake recirculation amplifies near surface flow velocities, compressing thermal boundary layers and augmenting forced convection, while heat accumulation in vortex cores may establish reverse thermal gradients that suppress conductive heat transfer. At low
 ${\textit{Ga}}$
, the introduction of positive thermal buoyancy
 $({\textit{Ri}} \gt 0)$
increases
 $\widetilde {{\textit{Re}}_p}$
while paradoxically reducing
 $\widetilde {\textit{Nu}}$
below isothermal values at equivalent
 $\widetilde {{\textit{Re}}_p}$
, as recirculation redistributes temperature through vortex-mediated flows. In contrast, higher
 ${\textit{Ga}}$
regimes exhibit chaotic rising that enhances heat transfer efficiency through turbulent mixing. For negative thermal buoyancy
 $({\textit{Ri}} \lt 0)$
, convective heat transfer is substantially suppressed due to reduced particle velocity. However, interestingly, these cases exhibit higher
 $\widetilde {\textit{Nu}}$
at equivalent
 ${\textit{Re}}_p$
than predicted by empirical models. This enhancement is attributed to the formation of a downward cold wake, as opposed to upward heated plumes for light particles with
 ${\textit{Ri}} \gt 0$
, which maintains stronger local temperature gradients near the particle surface. As a result, thermal conduction near the particle surface is more pronounced, becoming the dominant heat transfer mechanism under stabilizing thermal buoyancy conditions.
These observations indicate that
 $\widetilde {\textit{Nu}}$
is no longer a sole function of
 $\widetilde {{\textit{Re}}_p}$
under thermal buoyancy. To further explore this point, we compare two cases with similar particle Reynolds numbers
 $\widetilde {{\textit{Re}}_p}$
but differing
 ${\textit{Ga}}$
and
 ${\textit{Ri}}$
: Case A with
 $({\textit{Ga}},\ {\textit{Ri}}) = (120, 0)$
, and Case B with
 $({\textit{Ga}},\ {\textit{Ri}}) = (100,\ 0.5)$
, both yielding
 $\widetilde {{\textit{Re}}_p} \approx 130$
. Despite the matched Reynolds number, the wake dynamics vary significantly. Case A exhibits a relatively stable wake characterized by an axisymmetric vortex ring and a recirculation length of approximately
 $1.62$
, with
 $\widetilde {\textit{Nu}} \approx 8.54$
. In contrast, Case B displays a more extended and chaotic recirculation region (
 $\widetilde {L_v} \approx 2.87$
) due to enhanced vortex stretching and unsteadiness, yet its Nusselt number is slightly lower (
 $\widetilde {\textit{Nu}} \approx 8.48$
). This comparison suggests that enhanced recirculation may lead to heat accumulation in the wake, which suppresses conductive transport and reduces heat transfer. Therefore,
 $\widetilde {{\textit{Re}}_p}$
alone cannot uniquely determine the Nusselt numbers for particles with thermal buoyancy. Accurate characterization of heat transfer instead requires accounting for the coupled effects of
 ${\textit{Ga}}$
and
 ${\textit{Ri}}$
, as they collectively modulate wake structure and near-surface temperature gradients.
4. Conclusions
This study investigates the motion of a single sphere freely rising or settling under thermal buoyancy using direct numerical simulations with the IBM. Through parameter exploration spanning density ratios
 $0\leqslant \rho _r \leqslant 4$
, Richardson numbers
 $-0.5\leqslant {\textit{Ri}} \leqslant 1.0$
and Galileo numbers
 $40\leqslant {\textit{Ga}}\leqslant 120$
at a fixed Prandtl number
 ${\textit{Pr}}=1$
, we uncover three mechanisms governing path transitions: particle inertia effect, thermal buoyancy destabilization and gravitational–thermal competition.
Particle inertia plays a crucial role in determining the path instability of particles. We perform comparative simulations for particles with varying density ratios
 $(0.0 \leqslant \rho _r \leqslant 4)$
under fixed buoyancy conditions
 $({\textit{Ga}}=60, {\textit{Ri}}=0.5)$
, revealing a strong dependence of path stability on particle inertia. Higher inertia particles exhibit delayed vortex-induced oscillations with suppressed amplitudes, while lower inertia particles show amplified oscillations. Particle inertia critically modulates the time duration before path instability onset, while the steady-state motion before instability at fixed
 ${\textit{Ga}}$
and
 ${\textit{Ri}}$
remains independent of particle inertia.
Thermal buoyancy significantly influences the dynamics and path instability of particles by enhancing recirculation zones and promoting wake instability, particularly for light particles. Therefore, we further examine light particles
 $(\rho _r =0.5)$
with various Galileo numbers
 $(40\leqslant {\textit{Ga}}\leqslant 120)$
and Richardson numbers
 $(-0.5\leqslant {\textit{Ri}} \leqslant 1.0)$
to analyse the interplay between thermal buoyancy and gravity. We observed that thermal buoyancy can both stabilize and destabilize particle paths, depending on the alignment of thermal buoyancy-driven convection with the gravity-dominated motion. For cases with positive
 ${\textit{Ri}}$
, thermal buoyancy can lead to an earlier onset of path instability. We identify four distinct motion regimes: stable vertical, periodic zigzagging, spiralling and chaotic regimes, and summarize them in a regime map.
Compared with the cases without thermal buoyancy, our results indicate a significant reduction in the critical Reynolds number for path instability and the disappearance of oblique wake regimes. This destabilization arises from thermally induced convection, which alters vortex shedding and triggers wake instability. Interestingly, thermal buoyancy enhances the particle Reynolds number but could suppress the Nusselt number due to competing effects of enhanced convection and reduced thermal conduction, especially for low
 ${\textit{Ga}}$
particles. This suggests that heat transfer in flows with thermal buoyancy is not simply a function of Reynolds number but is also influenced by the complex thermohydrodynamic interactions.
In future work, it will be important to explore a few key problems to further advance our understanding of these two-phase flows. Extending the current study to multiparticle systems will clarify how the thermal buoyancy influences particle spatial clustering and flow motions induced by particle–fluid interactions. Moreover, it is of interest to examine how the turbulence is modulated due to the presence of particles and thermal buoyancy in turbulent particle-laden flows, which are closer to realistic industrial scenarios. Furthermore, this study employs the Boussinesq approximation, which is only applicable for the cases with small temperature differences. Incorporating non-Boussinesq models would enable to investigate flows with significant temperature variations. The insights would gained provide foundational knowledge for optimizing particle-laden thermal systems ranging from solar receivers to pollutant dispersion mitigation.
Funding
This work was supported by the National Natural Science Foundation of China (grant nos. 12388101, 12472224 and 92252104).
Declaration of interests
The authors report no conflict of interest.
Appendix A. Validation of numerical methods
The second-order finite difference method with an IBM implementation for our simulation is described in §2. The validations for temperature field and light particle with thermal buoyancy are given as follows.
A.1. Validation of flow solver
To validate the proposed algorithm for solving 3-D flows with thermal buoyancy, we considered a 3-D Rayleigh–Bénard convection problem in a cubic box with side length
 $L=1$
. The top and bottom walls in the Y direction are kept at constant cold
 $(\theta _c=0)$
and hot
 $(\theta _h=1)$
, respectively. The other four vertical walls are adiabatic. All six walls impose no-slip velocity boundary condition. Here
 ${\textit{Pr}}=0.7$
, and
 $Ra=g\beta (\theta _h-\theta _c)L^3/\nu \kappa = 1e^6, 3e^6, 1e^7$
with
 $N_1=N_2=N_3=128, 192, 256$
, respectively. We also define the following Péclet numbers and Nusselt numbers measured in Xu, Shi & Xi (Reference Xu, Shi and Xi2019) and Pan et al. (Reference Pan, Kim and Choi2019):
 \begin{align}{\textit{Pe}}({\textrm{u}}) &=\sqrt {\frac {Ra}{{\textit{Pr}}}(u^2+v^2+w^2)_{V,t}},\nonumber \\[-9pt] \end{align}
 \begin{align}{\textit{Pe}}({\textrm{u}}_2) &=\sqrt {\frac {Ra}{{\textit{Pr}}}(v^2)_{V,t}},\nonumber \\[-9pt] \end{align}
 \begin{align}\textit{Nu}_{\varOmega } &=1+\sqrt {\textit{PrRa}}(v \theta )_{V,t},\nonumber \\[-9pt] \end{align}
 \begin{align}\textit{Nu}_{h,c} &=-0.5(\partial _y \theta |_{y=0} + \partial _y \theta |_{y=1}),\nonumber \\[-9pt] \end{align}
 \begin{align}\textit{Nu}_{\textit{kin}} & = 1+\sqrt {\textit{PrRa}}(0.5 \nu \varSigma _{ij} (\partial _i u_j + \partial _j u_i)^2)_{V,t},\nonumber \\[-9pt] \end{align}
 \begin{align}\textit{Nu}_\theta &=1+\sqrt {\textit{PrRa}}(\kappa \varSigma _i (\partial _i \theta )^2)_{V,t}. \end{align}
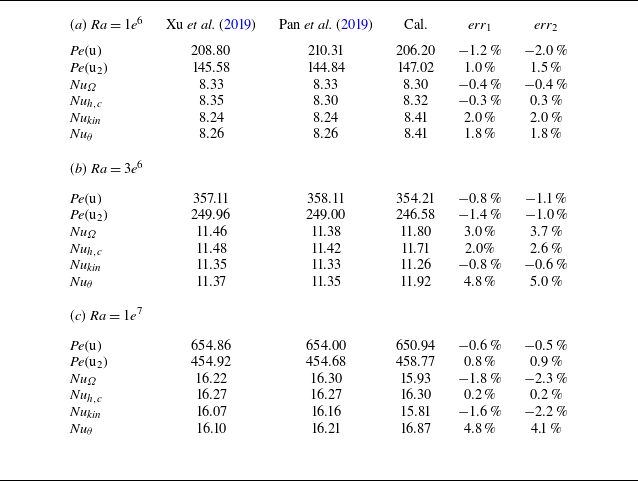
These characteristic quantities describe the heat transfer properties of different aspects of the 3-D box Rayleigh–Bénard convection, and the comparison of specific values is summarized in table 6.
Comparison of characteristic values obtain from Xu et al. (Reference Xu, Shi and Xi2019) and Pan et al. (Reference Pan, Kim and Choi2019), for the cases (a)
 $Ra = 1e^6$
, (b)
 $Ra = 3e^6$
and (c)
 $Ra= 1e^7$
. Here ‘Cal.’ represents the calculated values of the code used in this paper, and ‘
 $\textit{err}_{1}$
’ and ‘
 $\textit{err}_{2}$
’ are the relative errors with the results of the two references, respectively.

A.2. Validation of particle solver
Our first validation of particles is a hot stationary sphere in the middle of a cubic box filled with a quiescent cold fluid. The size of domain is
 $L=8D_p$
, and the numbers of the mesh are
 $N_1=N_2=N_3=128$
. The initial temperature of fluid is
 $\varTheta _f=0$
and the temperature of the particle is fixed as
 $\varTheta _p=1$
. The analytical solution of the fluid temperature as a function of the radial position and the time for an infinitely large domain is
 \begin{equation} \theta (r,t)=\frac {R_p}{r}\left (1-\textit{erf} \left ( \frac {r-R_p}{\sqrt {4t\kappa }} \right )\right )\!. \end{equation}
Here
 $R_p$
is the radio of the sphere. Figure 21(a) compares the calculated fluid temperature (thick dashed line) with the analytical solution (thin solid line) at different times. Excellent agreement was observed.
(a) Comparison with analytical solution for a single hot sphere in the stationary fluid. (b) Validation of Nusselt number for fixed particle in a uniform flow (Rans & Marshall Reference Rans and Marshall1952; Whitaker Reference Whitaker1972; Feng & Michaelides Reference Feng and Michaelides2000; Tavassoli et al. Reference Tavassoli, Kriebitzsch, Van der Hoef, Peters and Kuipers2013).

Then we consider a uniform flow over a fixed hot sphere. Here
 ${\textit{Pr}}=1.0$
and thermal buoyancy is neglected. The size of the computational domain is
 $16D_p\times 8D_p\times 8D_p$
with a spatial resolution of
 $h=D_p/16$
. The particle Nusselt number is computed at different Reynolds numbers ranging from 20 to 250. Our results are compared with the following correlations in the literature:
-
(i) Rans & Marshall (Reference Rans and Marshall1952)
(A8) \begin{equation} \textit{Nu}=2.0+0.6\textit{Re}^{0.5}{\textit{Pr}}^{0.33} \quad (10 \lt \textit{Re} \lt 10^4, {\textit{Pr}} \gt 0.7); \end{equation}
-
(ii) Whitaker (Reference Whitaker1972)
(A9)
\begin{equation} {\textit{Nu}}=2.0+(0.4\textit{Re}^{0.5}+0.06{\textit{Pr}}^{2/3}){\textit{Pr}}^{0.4}\quad ( 3.5 \lt \textit{Re} \lt 7.6\times 10^4, 0.7\lt {\textit{Pr}}\lt 380); \end{equation}
-
(iii) Feng & Michaelides (Reference Feng and Michaelides2000)
(A10)
\begin{equation} {\textit{Nu}}=0.992+(\textit{RePr})^{1/3}+0.1\textit{Re}^{2/3}{\textit{Pr}}^{1/3} \quad (0.1 \lt \textit{Re} \lt 4000, 0.2 \lt {\textit{Pr}}\lt 2000). \end{equation}


As can be seen from figure 21(b), our results are in good agreement with Feng & Michaelides (Reference Feng and Michaelides2000). Differences between our results and other correlations may be due to fitting errors in the correlation over a particular parameter range, as the correlation was derived from numerical simulations over a wider parameter range.
After verifying the heat transfer of the fixed particles, we need to verify the motion of the particles under the action of buoyancy. The settlement of spherical particles at constant temperature studied by Dan & Wachs (Reference Dan and Wachs2010) was used to verify our method. The size of the computational domain is
 $20D_p\times 8D_p\times 8D_p$
with a spatial resolution of
 $h=D_p/24$
. With periodic boundary conditions, the computational domain follows the particle in the vertical direction. Here
 ${\textit{Pr}}=1$
, and three Grashoff numbers were chosen to account for thermal buoyancy:
 $100$
(hot particles),
 $0$
and
 $-100$
(cold particles). As shown in figure 22, the ultimate velocity
 $\boldsymbol{U}_t$
of the particle and the drag coefficient
 $C_D$
were tested for
 ${\textit{Ga}}$
from 20 to 100. We also compare the calculation results of Majlesara et al. (Reference Majlesara, Abouali, Kamali, Ardekani and Brandt2020) and Fan et al. (Reference Fan, Lin, Xu and Yu2023) together, and our results are basically consistent with the previous results.
Since there are few examples on the rising of light particles considering thermal buoyancy, we verify the rising behaviour of light particles without thermal buoyancy. Figure 23 shows the temporal evolution of the rise velocity of a particle with
 $\rho _r = 0.5$
. The size of the computational domain is
 $20D_p\times 12D_p\times 12D_p$
with a spatial resolution of
 $h=D_p/32$
. The boundary conditions are consistent with the previous problem. Our calculation results are in good agreement with those of Tschisgale et al. (Reference Tschisgale, Kempe and Fröhlich2017) and their references’ data.
Validation of (a) the terminal velocity
 $\boldsymbol{U}_t$
and (b) the drag coefficient
 $C_D$
for a settling particle (Dan & Wachs Reference Dan and Wachs2010; Majlesara et al. Reference Majlesara, Abouali, Kamali, Ardekani and Brandt2020; Fan et al. Reference Fan, Lin, Xu and Yu2023).

The evolution of the rise velocity for a light particle
 $(\rho _r = 0.5)$
(J. Dušek personal communication 2015; Schwarz, Kempe & Fröhlich Reference Schwarz, Kempe and Fröhlich2015; Tschisgale et al. Reference Tschisgale, Kempe and Fröhlich2017).