Inadequate retirement income, fear, and 401(k) plan features
Individuals are increasingly responsible for securing their own retirement assets and defined contribution (DC) plans are one the most important financial vehicles American workers use to accrue retirement assets (Lusardi and Mitchell, Reference Lusardi and Mitchell2011). Among workers who participated in a retirement plan, 78% considered their DC (401(k) type) plan to be their primary plan (Copeland, Reference Copeland2013). The size of DC accounts depends crucially on employer and employee decisions to contribute to the plan.
Findings from psychology, behavioral finance, and other social science disciplines suggest that well-designed retirement plans can exploit the tendency for people to follow the ‘path of least resistance’ and boost retirement savings (Madrian, Reference Madrian2014). Automatically enrolling workers and automatically escalating their plan contributions require little in the way of active decision making so these features effectively increase asset accumulation.
However, the pension literature may have swung too far in emphasizing inertia as a key behavior trait explaining savings behavior at the cost of ignoring other powerful influences on human decisions. Fear is one of the most powerful human motivators. Fear and the anxiety it engenders create a psychological, physiological, and behavioral human state induced by threats to wellbeing or survival. Specific behavior patterns facilitate coping with an adverse or unexpected situation (Steimer, Reference Steimer2002). As a result, negative economic shocks will trigger a different reaction than positive shocks.
This study evaluates the determinants of employee 401(k) contributions and analyzes whether workers who experience negative economic shocks exhibit different retirement savings behaviors than those who do not. The hypothesized pathway is that negative economic shocks provoke fear and fear triggers protective and less expansive behavior.
Using data from the Survey of Income and Program Participation (SIPP) linked to Social Security Administration (SSA) administrative records from 2009 to 2012, this study finds employee 401(k) contributions and their determinants depend on whether times are good or bad. If workers did not have a drop in real earnings and did not suffer any unemployment spells between 2009 and 2012, their contribution rates would have been 5% higher than they were, and they would have contributed an average of $193 more toward their DC plan accounts.
The study concludes that policy makers and pension plan designers need to understand that fear and anxiety can overcome inertia and exert a powerful influence on saving. Negative economic shocks induce frequent adjustments to voluntary 401(k) contributions and may reduce retirement savings for people with more uncertain economic lives.
The debate on inertia and action biases in 401(k) plans
Various studies (Madrian and Shea, Reference Madrian and Shea2001; Choi et al., Reference Choi, Laibson and Madrian2004, Reference Choi, Laibson, Madrian, Metrick, McCaffrey and Slemrod2006; Beshears et al., Reference Beshears, Choi, Laibson, Madrian, Weller and Siegfried2010) identify inertia as an important behavioral regularity in retirement savings behavior. Workers make decisions consistent with behavior that takes ‘the path of least resistance’ because it is the ‘easiest’ thing to do. Employers and policy makers have used this widespread behavioral traitFootnote 1 to boost savings in voluntary 401(k) plans through auto-enrollment and sophisticated default options that manipulate (but not coerce) workers to save and invest adequately (Vanguard, 2013).
More recent studies find that under some circumstances workers are biased toward action, not inertia. Dushi and Iams (Reference Dushi and Iams2015) find job changes and earnings losses lead workers to stop or decrease their contributions; their study merges cross-sectional data from the SIPP with administrative data on earnings records, which include job changes and earnings histories. Butrica and Smith (Reference Butrica and Smith2014) use similar data to conclude employees vary their participation and contributions depending on general unemployment levels. In a closely related study, Tamborini et al. (Reference Tamborini, Purcell and Iams2013) conclude that workers in industries with large unemployment losses were more likely to reduce their DC plan contributions in the 2007–2009 recession even if they did not experience unemployment themselves. Because these studies use cross-sectional SIPP data, they do not control for unobservable behavioral differences between workers; they also cannot identify the impacts of changes in pension plan features and other employer characteristics on employee contribution behavior. On the other hand, Muller and Turner (Reference Muller and Turner2011) use panel data from the Panel Study of Income Dynamics (PSID) to conclude workers buy stocks when values are rising and sell or stop buying when values fall – an indicator of herd behavior. The PSID data are longitudinal, which allow the authors to control for unobservable differences among workers, but the PSID data lack information on key retirement plan features that can affect contribution behavior.
This study advances Dushi and Iams (Reference Dushi and Iams2015), Butrica and Smith (Reference Butrica and Smith2014), and Tamborini et al. (Reference Tamborini, Purcell and Iams2013) by using a longitudinal data sample to analyze changes in retirement contribution behavior controlling for idiosyncratic differences in preferences across workers. The data also have information on retirement plan features and employer characteristics at two periods in time, permitting an analysis of how changes in retirement plan features and employer characteristics affect employee contribution responses.
This study takes the concept that macroeconomic shocks affect savings one step further. In addition to changing employee contribution behavior, we hypothesize that negative economic shocks affect the sensitivity of employee contribution behavior to changes in the factors that affect retirement saving. This introduces the possibility that fear, generated by negative earnings experiences, explains part of employee retirement savings behavior.
The model
We regress employee contribution rates on workers’ demographic and economic traits, and on controls for retirement plan features and workplace characteristics to identify the determinants of employee contribution behavior (see equation (1)).
 $$Y_{it} = \alpha + \beta X_{it} + \gamma Z_{it} + \varepsilon _{it}, $$
where Y is worker i’s employee contribution rate at time t, X is a vector of demographic and economic traits, Z is a vector of retirement plan features and workplace characteristics and ε is an individual specific error term. The regression is applied to pooled data from 2009 and 2012. The coefficients, β and γ’s, indicate which factors significantly influence how much employees contribute to their retirement plan.
In order to identify the impacts of negative economic shocks on employee contribution rates, we use panel data on workers in 2009 and 2012 and apply a fixed-effects regression on changes in employee contribution rates, as defined in equation (2). We use a fixed-effects model instead of a random effects model because unobservable differences among workers are likely correlated with behavioral responses to changes in pension plan details and employer characteristics. The proxy for negative economic shocks is the length of unemployment spells experienced by an employee and an indicator of whether they experienced a decline in their real earnings between 2009 and 2012.
 $$\Delta Y_i = \phi \Delta X_i + \rho \Delta Z_i + \lambda (\Delta Z_i {^\ast}\delta _i ) + \nu _i, $$
where ΔY is the change in the employee's DC contribution rate for worker i; ΔX is a vector of changes in demographic and economic traits that determine employee contribution rates (including a measure of the number of weeks spent unemployed); ΔZ are retirement plan features and workplace characteristics; δ is an individual specific 0–1 indicator of whether real earnings fell or grew from 2009 to 2012; and ν is an individual-specific error term.
For those whose real earnings grew or remained stable, δ = 0, and the impact of changes in Z is ρ. For those whose real earnings fell, δ = 1, and the impact of changes in Z is ρ + λ. When the estimated λ coefficient is significantly different from zero, the impact of a change in retirement plan features and workplace characteristics differs by a worker's earnings experience. This regression is applied to panel data of employees in 2009 and 2012.
In addition to identifying how changes in factors affect changes in employee DC contribution rates, the fixed-effects regression eliminates unmeasured worker-specific traits that often confuse cross-sectional results.
Contribution rates equal total contributions divided by total earnings, which may change passively when earnings change, not when employees actively change their minds. We address this possible distortion by applying the same fixed-effects regression to changes in contribution levels. This application is the first robustness test. A second robustness test conducts a fixed-effects regression of the log of changes in employee DC contribution rates on changes in X and Z, to ensure that the findings are meaningful, and not a result of the form of the equation.
Data and methodology
Scholars correct the well-documented (Dushi and Iams, Reference Dushi and Iams2010) discrepancy between self-reports and employer reported contribution rates and earnings by linking the SIPP data with administrative earnings records from the SSA. The merging of these two samples allows scholars to identify changes in workers’ 401(k) contributions controlling for earnings shocks and other factors determining employee contribution behavior. The SIPP is a nationally representative survey conducted in panels with sample sizes ranging from 14,000 to 52,000 households. Respondents are surveyed every 4 months (every 4-month period is referred to as a wave) for the duration of the panel, which ranges from 2½ years to 4 years. Each wave consists of core questions asked in each wave, and additional modules, specific to that wave.
Within the SIPP data, the retirement expectations module was fielded twice: once in wave 3 (April–July 2009, which was at the official end of the recession); and again, in wave 11 (December 2011–March 2012, 3 years into the recovery),Footnote 2 which creates a longitudinal dataset on pension plan features, workplace characteristics and employee behavior for respondents who remained in the sample from wave 3 through wave 11. The 401(k) decisions made by employees and employers in 2009 are compared with those made in 2012.
The SIPP does not report on automatic enrollment and sample sizes were too small to study how marital status affects savings behavior. We limit the sample to private sector workers with linked earnings records who are between ages 21 and 68 years in 2009, were employed in only one job in 2009 and 2012, and were eligible to participate in their employers’ 401(k) plan in both years.Footnote 3 Results did not differ if the sample was restricted to full time workers.
Equation (1) is applied to pooled data from waves 3 to 11 to identify the factors influencing 401(k) contribution rate behavior. The dependent variable is the employee DC contribution as a percentage of salary. Demographic characteristics include sex, race, citizenship status, marital status, and number of own children younger than 18 living in the family (because children affect savings behavior [Butrica and Smith, Reference Butrica and Smith2014]).
Economic factors include the unemployment rate as a proxy for fear of job loss. The length of job tenure and hours of work control for job attachment, which has been associated with higher participation and contribution rates (Tamborini et al., Reference Tamborini, Purcell and Iams2013). Whether the employee participates in a defined benefit (DB) plan or a DC plan from a previous job likely affect the workers’ contributions conditional on retirement contribution limits. Workers with no health insurance may not save as much as a precaution against health emergencies. Means-tested benefits may indicate chronic low incomes and a chronic state of hardship.
Retirement plan features include whether the employer's contribution depends on the employee's contribution, the amount of the employer's contribution, whether the pension plan allows participants to take out a loan against retirement balances, and whether participants can choose how funds in the retirement account are invested (Choi et al., Reference Choi, Laibson and Madrian2004). Firm size is correlated with higher participation in pension plans.
A second set of regressions identifies factors influencing changes in employee DC contribution rates and contribution levels and tests for asymmetric responses to factors determining workers’ contribution rates when real earnings fall or are increasing. In these regressions, all the variables are included in changes, so that unvarying traits, like gender and race drop out. In addition to the variables included in the cross-sectional regression, changes in earnings, changes in real household net worth, as well as the number of weeks spent unemployed or out of the labor force between 2009 and 2012 are added. Fear of job loss is captured by the number of weeks a worker spent unemployed,Footnote 4 and the change in the unemployment rate.
Data description and cross-tabulations
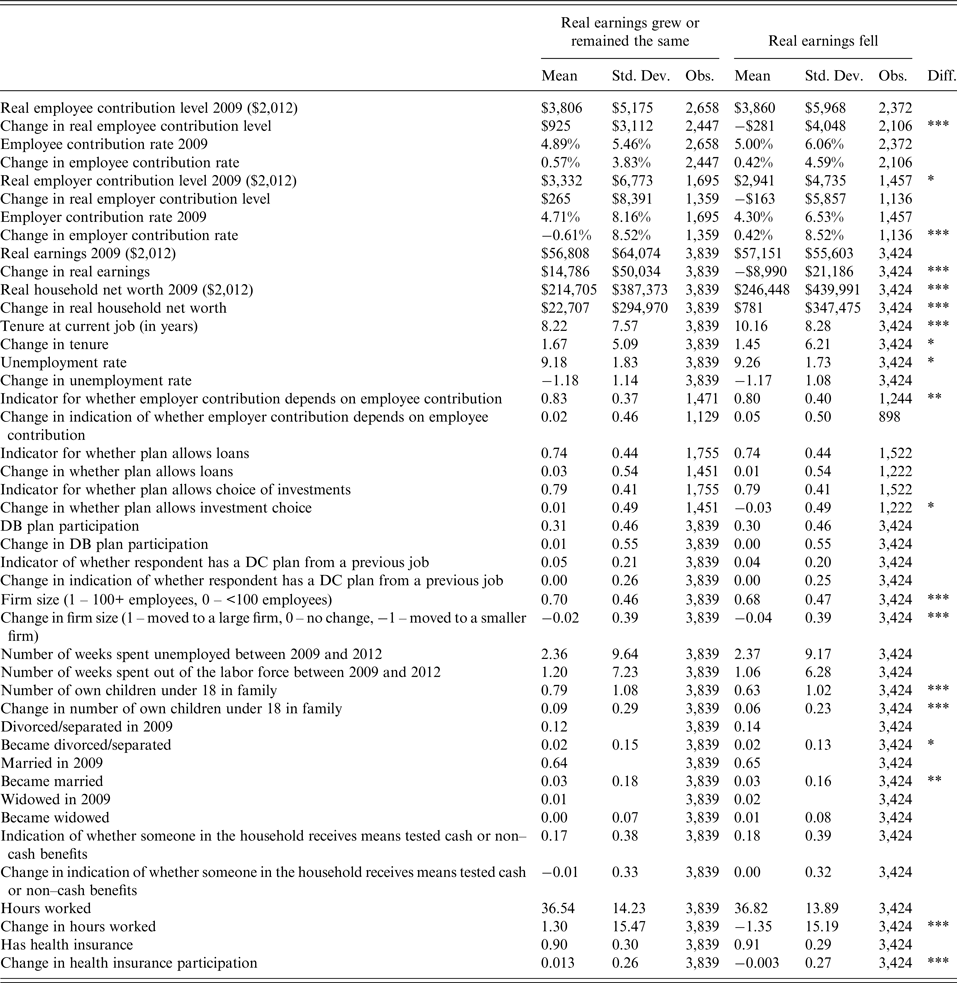
This study contributes to the literature on voluntary retirement savings (Browning and Lusardi, Reference Browning and Lusardi1996; Choi et al., Reference Choi, Laibson, Madrian and Metrick2002) by finding that employees respond differently in terms of 401(k) contributions to certain retirement plan features and workplace characteristics depending on whether their real earnings fell or rose. Just over half of the sample (53%) experienced stable or increasing real earnings between 2009 and 2012; the remaining 47% experienced a drop in real earnings (see Table 1, below).
Summary statistics of all variables by earnings experience.

*** Indicates that the difference in means is significant at the 1% level or better, ** indicates that the difference in means is significant at the 5% level or better, * indicates that the difference in means is significant at the 10% level or better. Sample is limited to the respondents ages 21–68 who were working only one job in the private sector and had non-negative earnings in 2009 and 2012, and whose SIPP data were matched to administrative earnings records.
Workers whose real earnings dropped were not very different from their more fortunate peers whose real earnings grew or remained stable. Both sets of workers had similar initial employee contribution amounts and rates, employer contribution amounts and rates, DB plan participation rates and participation rates in DC plans from previous employers. Those whose real earnings fell and those whose real earnings grew or remained constant initially worked similar hours, were just as likely to have health insurance or to have a household member receiving means-tested benefits. They both faced similar unemployment rates and experienced a similar number of weeks unemployed or out of the labor force. They all had the same retirement plan features, except that those who experienced declining real earnings were less likely to have their employer match depend on the employee's contribution. Also, workers whose real earnings fell had slightly higher initial real household net worth and job tenure, were less likely to work in large firms and had fewer children under age 18 living in the family.
Despite the similarities between the two groups of workers, the more fortunate workers experienced increases in their earnings and lived in households whose real net worth grew by $22,707 on average, compared with a much smaller increase of $781 for those whose real earnings fell. Workers who experienced a drop in real earnings experienced a 1.35 h decline in work compared with a 1.30 hours increase for those who experienced rising real earnings. The earnings losers had a smaller increase in job tenure than the latter group (1.45 compared with 1.67 years) indicating more of them lost jobs. Not only were there changes in hours and job tenure, but a larger share of those whose earnings fell moved to a small firm than those whose earnings grew or remained stable (+4 percentage points (pp) compared with +2 pp). Earnings losers had a 0.3 pp drop in health insurance coverage rates, whereas a larger share of the fortunate group (+1.3 pp) had health insurance. Workers whose real earnings fell became less likely to be given the choice of where to invest their pension contributions (−3 pp), compared with real earnings gainers who became more likely to be offered that choice (+1 pp), and the employer contribution rate fell (−0.61%) for the latter group while increasing (+0.42%) for the former. The change in employer contribution rates is counter intuitive, but since the change in employer contribution levels was not different across the groups, it likely reflects an automatic change in rates when the denominator (earnings) changes.
As a result of the different earnings experiences, a larger fraction of the fortunate workers got married, divorced or separated, and had more children over the 3-year period, probably because all these life events are costly. At the same time, real employee contribution amounts fell by $281 for those whose real earnings decreased, while employee contribution levels increased by $925 for those whose real earnings grew, and the employee contribution rate grew by 0.57% for the latter group while only increasing by 0.42% for the former.Footnote 5 This supports the interpretation that employee 401(k) contribution behavior differed by earnings experience.
Results
Cross-sectional results
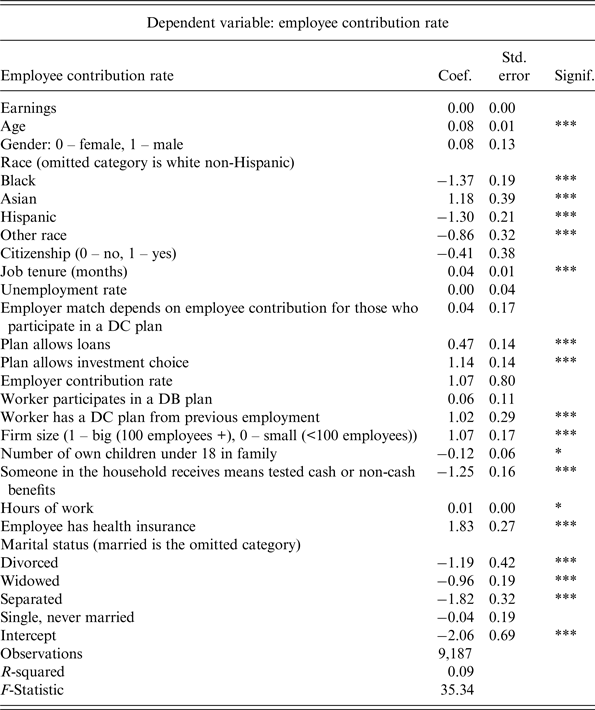
We run equation (1) on pooled cross-sectional data from 2009 to 2012 to identify the baseline determinants of employee 401(k) contribution rates (see Table 2). Being widowed, divorced, or separated lowers contribution rates compared with being married, even after controlling for earnings. Working in a large firm boosts contribution rates, as do longer hours of work, and having more job tenure. The cross-sectional results do not clarify whether these results reflect a true impact of firm size and job attachment on savings behavior, or merely indicate a selection effect whereby workers who have relatively long job tenure and work long hours in large firms are more likely to save. Having health insurance coverage and being part of a DC plan from a previous job both increase contribution rates.
Cross-sectional regression on pooled data with standard errors clustered at the individual level.

*** Indicates that the estimated coefficient is significant at the 1% level or better, ** indicates that the estimated coefficient is significant at the 5% level or better, * indicates that the estimated coefficient is significant at the 10% level or better. Sample is limited to the respondents ages 21–68 who were working only one job in the private sector and had non-negative earnings in 2009 and 2012, and whose SIPP data were matched to administrative earnings records.
We find that certain features of the retirement plan increase contribution rates: allowing loans from the DC plan and allowing employees to choose their investments. Surprising, but consistent with other studies, is the finding that an employer match and the size of the employer match are not significantly correlated with employee contributions (Kusko et al., Reference Kusko, Poterba, Wilcox, Mitchell and Schieber1998; Choi et al., Reference Choi, Laibson and Madrian2004; Mitchell et al., Reference Mitchell, Utkus and Yang2005; Dworak-Fisher, Reference Dworak-Fisher2008).Footnote 6 Earnings levels also do not have a significant impact on employee contribution rates. Finally, receiving government benefits and having children under the age of 18 lead to smaller employee contribution rates (see Table 2, below).
Asymmetric effects: workers respond differently when earnings increase and decrease
Cross-sectional results do not control for individual differences in respondents’ propensity to contribute to their retirement plan. Examining the behavior of the same people over time controls for unobserved individual differences and helps distinguish cause and effect. The next regressions use longitudinal data to determine the impact of changes in life events, job, and retirement plan features on changes in employee 401(k) contribution rates for the same individuals across two time periods.
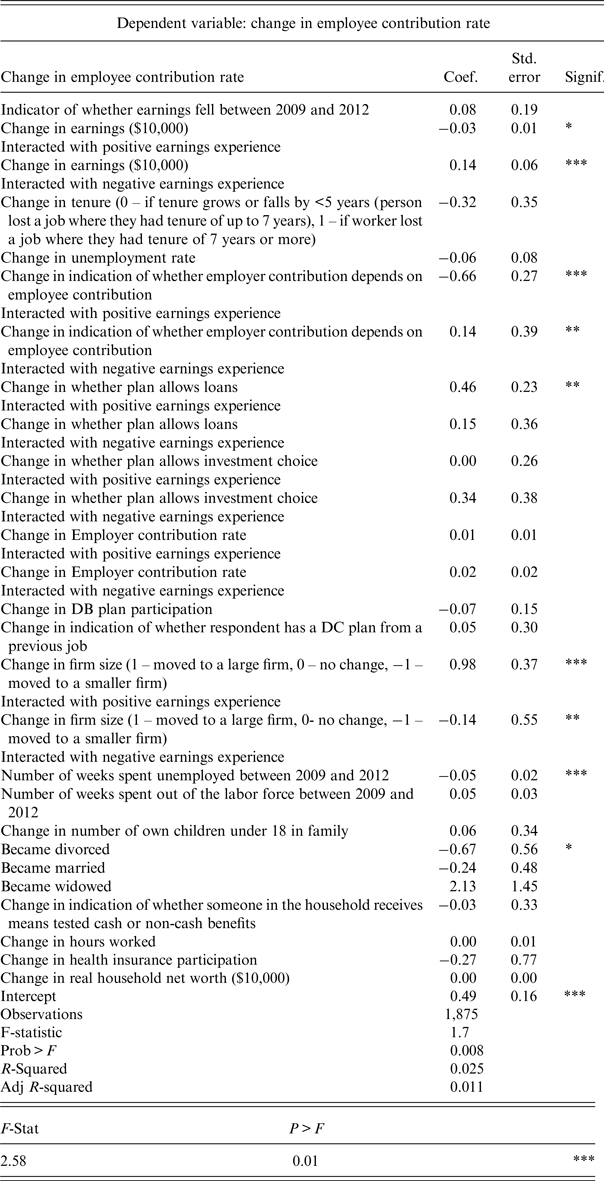
As mentioned above, one of this study's most important contributions is the finding that workers react asymmetrically to changes in retirement plan features and workplace characteristics depending on whether their real earnings were stable, increasing, or falling. To illuminate this asymmetry, we apply a fixed-effects regression on equation (2) (see Table 3, below).
Fixed effects regression.

*** Indicates that the estimated coefficient is significant at the 1% level or better, ** indicates that the estimated coefficient is significant at the 5% level or better, * indicates that the estimated coefficient is significant at the 10% level or better. Sample is limited to respondents aged 21–68 years in 2009 who were working only one job in the private sector and had non-negative earnings in 2009 and 2012, and whose SIPP data were matched to administrative earnings records.
H0: effects of change in earnings, changes in plan details and changes in firm size are identical whether earnings experience was negative or positive.
Employees whose earnings remain the same or rise – those with a positive earnings experience – decrease their contribution rates slightly when their earnings change. A $10,000 increase in earnings leads to a decrease in employee contribution rates by 0.03 percentage points (see the 0.03 coefficient for the variable ‘change in earnings ($10,000) interacted with positive earnings experience’ in Table 3). Their mean contribution rate is 4.89%, so a drop of 0.03 percentage points represents a 0.6% drop in contribution rates. Although the 0.03 percentage point drop is statistically significant, the magnitude is very small. The findings for employees with a positive earnings experience support an ‘inertia interpretation’ – workers’ retirement plan contribution behavior is relatively stable.Footnote 7
Conversely, contribution behavior seems not to be inertial for employees with a negative earnings experience. The coefficient for the variable that interacts a $10,000 change in earnings with a dummy for whether a person experiences falling earnings is 0.14. This result means that for employees with a negative earnings experience, contribution rates and changes in earnings are positively related to each other. Faced with a $10,000 increase in earnings, these workers would increase their contribution rates, and if their earnings fall by $10,000, they would reduce their contribution rates by a considerable amount – 0.14 percentage points or by 3% (the mean contribution rate for these workers is 5%, so a change of 0.14 percentage points represents a 3% change in contribution rates.) Fear, rather than inertia, may be a better way to describe the contribution response when employees are hit with a negative economic shock (Fenwick and Tausig, Reference Fenwick and Tausig1994; Flatau et al., Reference Flatau, Galea and Petridis2000; Ruhm, Reference Ruhm2006; Diette et al., Reference Diette, Goldsmith, Hamilton, Darity and Appelbaum ed Kalamazoo2012; Milner et al., Reference Milner, Page and LaMontagne2014).
Whether an employer match is contingent on employees’ contributions also impacts workers’ behavior depending on workers’ past earnings experience. For employees with a positive earnings experience, contribution rates are inversely related to whether the employer's match depends on their contribution. The coefficient for the independent variable ‘change in indication of whether employer contribution depends on employee contribution interacted with positive earnings experience’ is −0.66. This result means that workers with a positive earnings experience decrease their contribution rates by 13% when their employer conditions their match on the employee contribution and increase their contribution rates by 13% when their employer stops conditioning their match behavior on the employee contribution. This is a large effect. (The mean contribution rate of workers whose real earnings grew or remained the same is 4.89%, so 0.66 percentage points – see the 0.66 coefficient in Table 3 – represents a 13% change in contribution rates.) Workers increase contributions when the employer's match is not contingent and they decrease their contributions when the employer's match is contingent. This result implies that workers try to offset changes in their employer's matching behavior. Regardless of the interpretation of the result, we emphasize the effect of this plan design is the opposite for workers who lost earnings.
For employees with a negative earnings experience, contribution rates are positively related to whether the employer's match depends on employees’ contributions. See the size of the coefficient – 0.14 – for the variable ‘change in indication of whether employer contribution depends on employee contribution interacted with a dummy for a negative earnings experience’. Workers with a negative earnings experience would increase their contribution rates by 0.14 percentage points when their employer makes their contribution contingent on employees’ contribution, and would decrease their contribution rates by 0.14 percentage points when their employer stops making their contribution contingent. (The mean contribution rate for workers with a negative earnings experience is 5% and a 0.14 percentage point change represents a 3% change in contribution rates.) Unlike employees with a positive earnings experience, these employees likely decrease their contributions when employers stop conditioning their matching because they cannot afford to make up for the shortfall in employer contributions.
When workers with a positive earnings experience are allowed to take out loans against their retirement savings, they increase their contribution rates by 0.46 percentage points (this represents a 9% change from a mean initial contribution rate of 4.89%). Therefore, allowing loans does incent workers with a positive earnings experience to save more. But employees with a negative earnings experience do not respond to employers changing their policy to allow 401(k) loans, perhaps because they are liquidity constrained.
Further, employees who move to a larger firm or whose firms expandFootnote 8, increase their contribution rates by 0.98 percentage points (a 20% increase from an initial mean contribution rate of 4.89%) but, again, only if they have a positive earnings experience. Those with a negative earnings experience whose firm size grows contribute 0.14 percentage points less (a 3% drop from an initial mean contribution rate of 5%). The effect of firm size is contingent on what happens to workers’ real earnings.Footnote 9
Last, an F-test affirms that employees’ sensitivity to changes in retirement plan features and firm size depends crucially on workers’ real earnings experience as we hypothesized. The test (reported in Table 3) rejects at the 1% level the null hypothesis that the effects of a change in earnings, changes in plan details and changes in firm size are identical whether earnings experience was negative or positive.
The number weeks spent unemployed between 2009 and 2012 decreases contribution rates by 0.05 percentage points for each week spent unemployed, for all workers regardless of real earnings experience. A worker who spent 3 months unemployed would have reduced their contribution rate by 0.6 percentage points, which represents a 12% drop in contribution rates from an initial mean contribution rate of 4.89–5.00% depending on earnings experience. Unemployment spells may weaken workers’ motivations to save for retirement even after the spell is completed because they worry they will need the cash in case they lose their jobs again. This may be an example of a bad experience engendering fear of a repeat experience and thereby triggering protective future behavior.
Changes in household wealth, health insurance coverage, marital status, or the number of children under the age of 18 years do not affect employee contributions (in 3 years these factors had little variation).
We conclude that if workers with negative economic shocks between 2009 and 2012 had not experienced a drop in real earnings they would have contributed 0.13 percentage points more.Footnote 10 And, had they not experienced unemployment from 2009 to 2012, their average contribution rate would have been 0.12 percentage points higher.Footnote 11 In other words, if workers with negative economic shocks did not experience falling earnings or unemployment between 2009 and 2012, their contribution rate would have been 0.25 points higher – a 5% increase from their baseline contribution rate of 5%; this translates into an extra $193 contribution toward their retirement accounts given their baseline contribution amount of $3,860.
Robustness checks
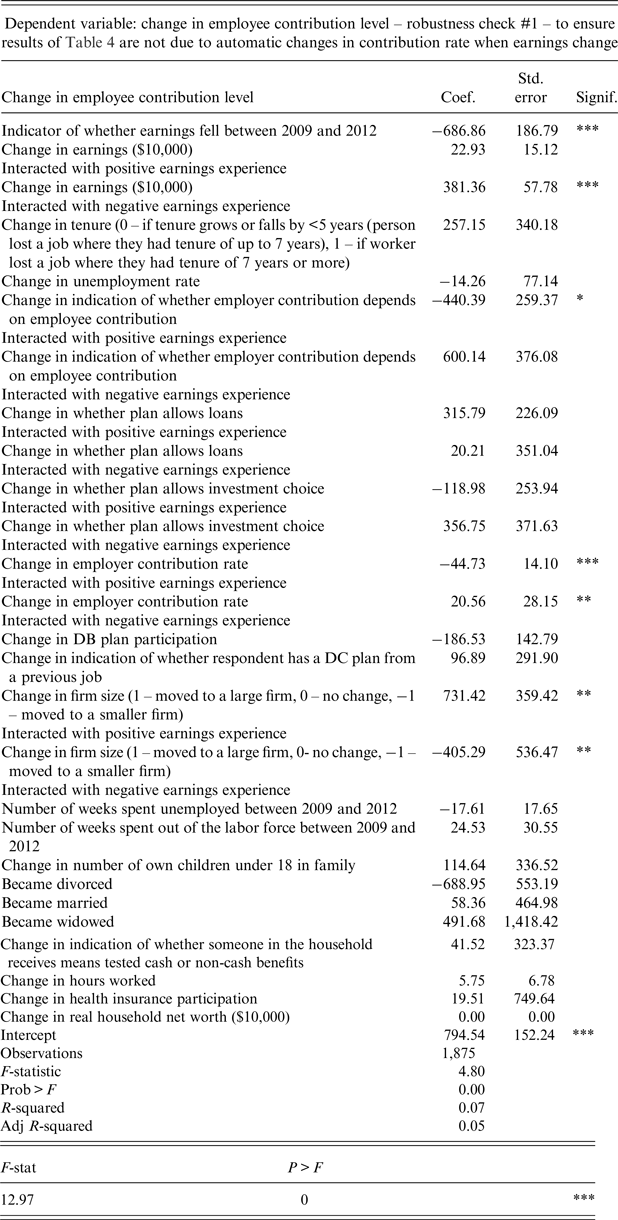
Since contribution rates are calculated as total contributions divided by total earnings, observed changes in contribution rates may be the result of arithmetic, where changes in earnings, not a change in behavior, raise or lower rates. To address this concern, the first robustness test is a fixed-effects regression applied to changes in contribution levels, instead of contribution rates (see Table 4, below).
Fixed effects regression.

***Indicates that the estimated coefficient is significant at the 1% level or better, ** indicates that the estimated coefficient is significant at the 5% level or better, * indicates that the estimated coefficient is significant at the 10% level or better. Sample is limited to respondents aged 21–68 years in 2009 who were working only one job in the private sector and had non-negative earnings in 2009 and 2012, and whose SIPP data were matched to administrative earnings records.
Ho: effects of change in earnings, changes in plan details and changes in firm size are identical whether earnings experience was negative or positive.
Results indicate that employees whose real earnings fell over the time period contribute $687 less to their DC accounts. A $10,000 increase in earnings has no impact on contribution levels, but a $10,000 drop in real earnings elicits a drop in contributions of $381; this supports the interpretation that contribution behavior is inertial with respect to changes in earnings for those who have a positive earnings experience but not for those who experience a decline in earnings.
When the employer match is contingent on employees’ contributions, it lowers the employee contribution by $440 for those with a positive earnings experience, but has no statistically significant impact on contributions for those with a negative earnings experience. A $1,000 increase in the employer contribution level leads to a decrease in employee contributions of $45 for those with a positive earnings experience. In contrast a $1,000 decrease in the employer contribution leads to a $21 decrease in employee contributions for those whose real earnings fell, which is similar to the employer match's impact on the employee's contribution rates in the main fixed-effects regression.
Finally, moving to a large firm is associated with a $731 increase in contributions for those with a positive earnings experience, but those who moved to a large firm while experiencing a drop in real earnings reduce their contributions by $405. All these effects are consistent with findings in the employee contribution rate regressions. However, the impacts of allowing loans and of the number of weeks spent unemployed are no longer significant.
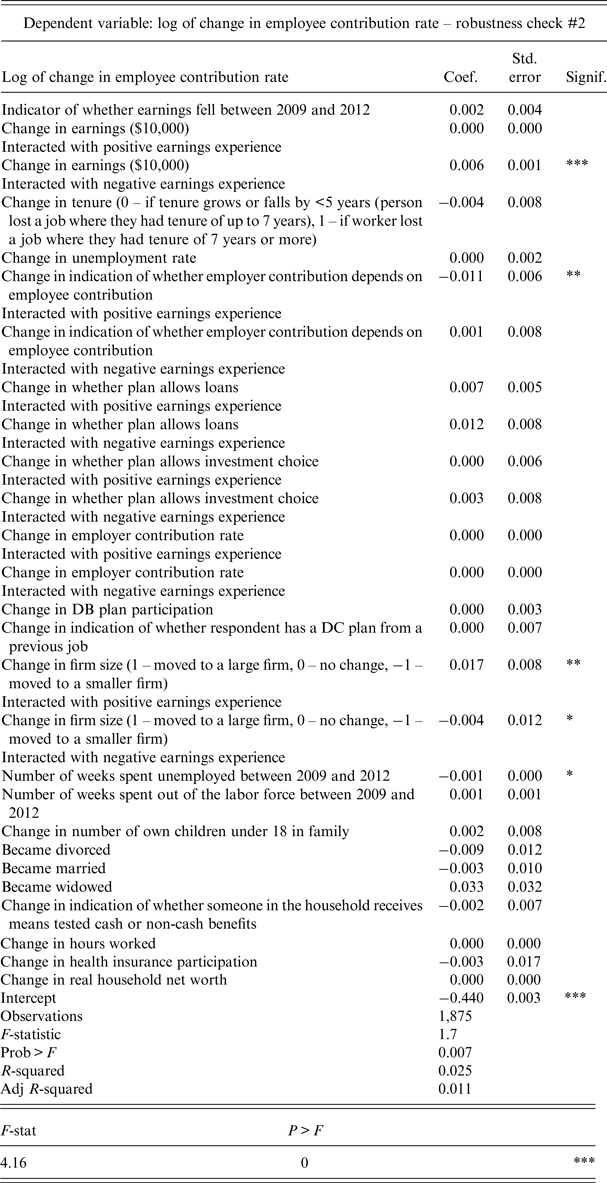
A second test of robustness investigates whether our results are due to the functional form of the dependent variable. To address this possibility, we convert the dependent variable to the log of changes in contribution rates and run the same fixed-effects regression. One obstacle to taking logs of the change in contribution rates is that many of the changes are negative or zero. To get around this problem, we transform all changes in contribution rates into positive values by adding to them the greatest negative value found in the data. Then we take logs and run the regression (see Table 5, below).
Fixed-effects regression.

*** Indicates that the estimated coefficient is significant at the 1% level or better, ** indicates that the estimated coefficient is significant at the 5% level or better, * indicates that the estimated coefficient is significant at the 10% level or better. Sample is limited to respondents aged 21–68 years in 2009 who were working only one job in the private sector and had non-negative earnings in 2009 and 2012, and whose SIPP data were matched to administrative earnings records.
Ho: effects of change in earnings, changes in plan details and changes in firm size are identical whether earnings experience was negative or positive.
Again, in this regression a $10,000 change in earnings has no impact on employees with a positive salary experiences. In contrast, a $10,000 change is associated with a 0.6% drop in the change in contribution rates for employees who experienced a drop in earnings. In cases where the plan is designed so that the employer match depends on the employee contribution, the change in employee contribution rates falls by 1% but only for those with a positive earnings experience. Moving to a larger firm is associated with a 1.7% drop in the change in contribution rates for those with a positive earnings experience, while being associated with a drop in the change in contribution rates of 0.4% among those with a negative earnings experience. Finally, each additional week spent unemployed decreases the change in contribution rates by 0.1%. Because a transformation was applied to the change in contribution rates in order to compute logs, the coefficient levels are not important. However, we interpret the significance of the interaction terms to mean that workers behave differently with respect to saving for retirement depending on their unemployment and earnings shocks.
Conclusion and policy implications
Workers with a positive earnings experience do not change their retirement planning, consistent with the inertia hypothesis – a $10,000 increase in earnings has practically no impact on their contribution rates. However, for workers with negative earnings experiences, an earnings drop of $10,000 leads to a 3% decline in their contribution rates. The impact of changes in retirement plan features also differs depending on a worker's exposure to earnings shocks. When employers stop making their contribution contingent on employee contributions, those with a positive earnings experience increase their contributions by 13%, while those with a negative earnings experience decrease their contributions by 3%. And when employers allow employees to take out loans from their DC plans, workers with a positive earnings experience increase their contribution rates by 9%, but the loan feature does not influence workers with a negative earnings experience.
The number of weeks spent unemployed between 2009 and 2012 decreases contribution rates by 1% for each week of unemployment for all workers regardless of earnings experience. A worker who spent 3 months unemployed would have reduced their contribution rate by 12%. In other words, unemployment reduces workers’ retirement savings well beyond the event itself. A bad experience may produce trauma and reduce savings rates for an extended period of time.
One of this study's most important contributions is finding workers’ savings behavior reacts asymmetrically to changes in earnings, firm size, and plan design features depending on whether real earnings are stable, increasing, or falling and whether workers had previous unemployment experiences.
Advocates for more retirement savings hope the automatic enrollment and investing features would work to increase retirement savings accumulations because employees are passive savers. The SIPP does not report automatic enrollment features but we find employees are responsive and active, not passive, to changes in earnings, retirement plan features, firm size, and unemployment spells. We suggest these factors can overcome human inertia.
We confirm what others have suspected, that inertia as it is related to retirement savings behavior may only apply to people in stable situations. Once economic lives are disrupted, plan design features that depend on passivity may be ineffective. Ironically, relying on these features means that the present day voluntary, individual – directed 401(k) type plans are more effective for those in the best economic situations. We find fear and anxiety may affect 401(k) contributions because the contributions depend crucially on whether workers’ real earnings grew, stayed the same, or fell over the preceding time period.
Policy makers who rely on incentives and other standard features to prod workers to save enough for their retirement needs will have to consider that unfortunate life and market events affect some and not others. Mandatory retirement plan savings features found in defined benefit plans, and to some extent Social Security, extended to DC plans may help ensure consistent retirement savings for all workers, not just those in stable conditions.
Data Appendix
The administrative earnings records from SSA give total personal earnings for each individual. In order to identify each respondent's DC plan contributions as a percentage of earnings, we limited the sample to workers who had only one job.
Employee contributions were from the administrative record. Respondents were coded as having a zero contribution if they stated in the SIPP sample that they did not participate in the pension plan for voluntary reasons (reasons 6–14). Respondents were also coded as having zero contributions if they stated that they did participate in a DC plan, but there was no record of a contribution in the administrative record.
The data comes from the 2008 panel of the SIPP, waves 3–11, matched with administrative earnings records from SSA. First, wave 3 data were merged with administrative records. In that process, 46,433 observations were not matched (27,653 from the SIPP sample, 18,780 from the administrative data sample), leaving us with 67,599 observations. Of these observations, only 21,565 had information on DC plan contributions (they responded to the contribution question or they did not respond but indicated that they were eligible to participate in a DC plan).
Next, wave 11 data were merged with administrative records. In that process, 56,960 observations were not matched (24,341 from the SIPP sample, 32,619 from the administrative data sample), leaving us with 53,760 observations. Of these observations, only 18,316 had information on DC plan contributions (they responded to the contribution question or they did not respond but indicated that they were eligible to participate in a DC plan).
When the wave 3 sample was merged with the wave 11 sample, 25,787 observations were not matched (19,813 were no longer in the sample – sample attrition), leaving us with 47,786 observations. Of these, 15,607 had responses to the employee contribution question in 2009, and 16,364 had information on employee contributions in 2012. In additional 24,066 observations were dropped because there was no information about their employment status for all the waves in between waves 3–11, and 47 more observations were dropped because they did not match with waves 4 and 10, which we use to record assets information. The final sample size is 37,784. These respondents are in the SIPP sample and the administrative data from 2009 through 2012, and had assets information and employment status recorded.
Once we limit the sample to those who were working in both waves 3 and 11, we drop 17,981 observations. The age restriction costs an additional 1,507 observations, and the requirement that respondents have only one job both periods costs 7,488 observations. Finally, limiting to private sector workers leaves us with 3,545 fewer observations. At that point, the weighted sample size is 15,686,766, of whom only 10 million are eligible to participate in a DC plan at work both years.