PREVIOUS STUDIES AND THEIR METHODOLOGIES
S-lenition is perhaps the most studied phenomenon in Spanish. Ferguson (Reference Ferguson, Croft, Denning and Kemmer1990:64) went so far as to state that “the aspiration and deletion of /s/ in dialects of Spanish may be the most extensively treated of all sound changes being investigated from an empirical, variationist perspective.” Lipski (Reference Lipski1994) reported that high rates of s-lenition in syllable-final position are found in Andalusian and other Peninsular varieties, the Caribbean zone, including coastal Mexico, Colombia, and Panama and throughout Central America (excepting Costa Rica and Guatemala), the Pacific coast of Colombia and Ecuador, coastal Peru, Chile, Paraguay, Eastern Bolivia, Uruguay, and most of Argentina. Syllable-initial s-weakening, which has received much less attention than its syllable-final counterpart, has been analyzed in several dialects, including New Mexico and Southern Colorado (E. L. Brown, Reference Brown2005), Chihuahua, Mexico (E. L. Brown & Torres Cacoullos, Reference Brown, Torres Cacoullos, Núñez-Cedeño, López and Cameron2003), and Cali, Colombia (E. K. Brown & E. L. Brown, forthcoming). In addition to geographic origin, it has been shown that a multitude of other factors influence differences in the weakening rates of /s/, including language internal and external factors.
Variation in the distribution of /s/ has been explained in terms of sociolinguistic characteristics of the speakers, such as socioeconomic status and education level, age, gender, and whether the speaker resides in an urban or rural location. Variation in s-realization is generally a marker of social class, with upper-class and more-educated speakers tending toward less weakening, whereas lower-socioeconomic class and less-educated speakers favor more lenition. Terrell (Reference Terrell, Sankoff and Cedergren1981) examined the distribution of /s/ in Santo Domingo and found that education level, task, and gender were significant in explaining the realization of /s/. Guillén Sutil (Reference Guillén Sutil1992), Cedergren (Reference Cedergren1973), and Poplack (Reference Poplack1979) found that the age of the speaker could also affect the rate of s-lenition, with younger speakers displaying more weakening than older speakers did. Furthermore, in general, male speakers show higher levels of lenition than female speakers do, as the latter are more likely to retain /s/ when lenition is stigmatized (Fontanella de Weinberg, Reference Fontanella de Weinberg and Maria Beatriz1973).
The realization of /s/ covaries with register such that the frequency of retention is greater in formal speech styles and in reading tasks (Alba, Reference Alba2004; File-Muriel, Reference File-Muriel2009); the influence of register can often be difficult to disentangle from speaking rate, given that informal registers are often characterized by more accelerated speaking rates than are found in more formal registers. Increasing the rate of speech has profound effects on the duration of all segments and, not surprisingly, tends to occasion higher incidences of reduction in the form of lenition and assimilatory processes. Accelerated speech rates increase the frequency of stop lenition in Spanish, vowel harmony in Brazilian Portuguese, and flapping in American English, among other phenomena. Lipski (Reference Lipski1985) found that style and/or speed of delivery figure into explaining /s/ variation, by comparing sports commentaries with other forms of broadcasting. It is unclear, however, whether speed of delivery, style, or a combination of both factors contributed to the variation.
In the usage-based model of phonology and in exemplar theory (Bybee, Reference Bybee2001, Reference Bybee2006), the claim is made that high-frequency lexical items or phrases generally undergo regular sound change before low-frequency words. In the case of Spanish /s/ lenition, a number of recent studies (Bybee, Reference Bybee2002; E. K. Brown, Reference Brown, Collentine, García, Lafford and Marín2009a, Reference Brown2009b; E. L. Brown, Reference Brown2005; E. L. Brown & Torres Cacoullos, Reference Brown, Torres Cacoullos, Johnson and Sanchez2002, Reference File-Muriel and Diaz-Campos2003; File-Muriel, Reference File-Muriel2009, Reference File-Muriel2010; Minnick Fox, Reference Minnick Fox2006) have demonstrated that /s/ is more likely to be lenited in more frequent words.
Most quantitative studies that examine s-lenition have relied exclusively on transcription via auditory analysis (see Erker, Reference Erker2010; File-Muriel & E. K. Brown, Reference File-Muriel and Brown2010; Minnick Fox, Reference Minnick Fox2006, for exceptions). Terrell (Reference Terrell1979) suggested that a fine-grained phonetic transcription of /s/ is possible, but it would hinder the replicability of results for future investigations. For this reason, most sociolinguists and phonologists have adopted a tripartite system for distinguishing between the innumerable phonetic manifestations of /s/ as one of three variants: [s], [h], and Ø. Based on this categorization of /s/, two kinds of varieties of Spanish have been identified in the Hispanic linguistics literature:
1. Retention: Speakers generally produce /s/ as [s] in most contexts, whereas aspiration (i.e., [h]) and deletion (i.e., Ø) are almost nonexistent. This is the standard variety spoken in the capital of Colombia (Bogotá), though to our knowledge, this variation in Bogotá has yet to be addressed quantitatively.Footnote 1
2. Aspiration/deletion: Speakers tend to produce /s/ as [h] or Ø. Although [s] appears in some formal registers, it is infrequent in informal speech. This is the standard variety spoken in the Atlantic coastal region of Colombia.
JUSTIFICATION FOR THIS STUDY
The inherently subjective nature of audio transcription, which to date has been the preferred approach, has not gone unnoticed in the literature. Poplack (Reference Poplack1979:66) described what she saw as a methodological concern: “Researchers looking at similar Caribbean dialects have reported grossly different proportions of the same variants. These discrepancies are more likely due to [one researcher] counting the assimilated variants as instances of deletion, while [another researcher] considered them aspiration.” In short, researchers make subjective decisions about what they hear (or think they hear), which becomes highly arbitrary due to the gradient nature of lenition (see Erker, Reference Erker2010, on some of the perceptual issues).
The fact that transcription is subject to bias based on the expectations and experience of the transcriber is well documented in the literature (cf. Boucher, Reference Boucher1994; Erker, Reference Erker2010; Mann & Repp, Reference Mann and Repp1980; Pouplier & Goldstein, Reference Pouplier and Goldstein2005). Several studies show that the surrounding phonetic context can influence the perception and categorization of segmental phenomena. For example, vowel durations affect the perception of syllable-final stop consonants, which are easier to perceive and categorize when the preceding vowel is shorter in duration (Repp & Williams, Reference Repp and Williams1985). Specific to /s/, File-Muriel and Díaz-Campos (Reference File-Muriel and Diaz-Campos2003) examined the perception and categorization of different variants of /s/ using synthesized speech and found that listeners categorized the aspirated and deleted variants in prepausal position at only 46% accuracy. An error matrix indicated that the participants experienced the most difficulty categorizing the [h] and Ø variants as either [h] or Ø. However, participants rarely miscategorized these variants as [s].
Furthermore, capturing the acoustic variation in different manifestations of /s/ is not possible using the traditional transcription approach, as it limits the representation of this gradient phenomenon to symbolic units of the International Phonetic Alphabet (IPA). An obvious consequence of symbolic representation is that it reduces the chances of understanding not only which factors influence a particular sound, but also how different aspects of the sound are affected. Upon representing a sound symbolically, the researcher chooses between one or more available devices (e.g., /s/ as [s], [z], [h], Ø). Clearly, these symbols are unable to provide more than a binary or (at best) ternary categorization of important features that comprise the sound, such as temporal, spectral, and energy characteristics. For example, the classification of voicing is reduced to “presence or absence,” when in reality, voicing is quite gradient. Furthermore, the gradient temporal and spectral properties are ignored entirely with categorization.
Widdison (Reference Widdison1991, 1994, Reference Widdison1995) showed conclusively that subtle acoustic properties influence perception in lexical decision tasks, even if the listeners are not conscious of the material in the signal that influences such decisions. Erker (Reference Erker2010) demonstrated that, in the Spanish of Dominicans in New York, a strictly segmental description of coda /s/ productions groups together tokens that are significantly different from one another acoustically, thus concealing important patterns present in speech. He reported that, within the class of tokens that were coded as [s], there are significant differences in both of the acoustic measurements used in the study—duration and centroid. Specifically, he reported the longest s-duration before pauses, shortest before consonants, and intermediate before vowels. His centroid measurements displayed this same pattern. Furthermore, these differences were produced in a structured way and were correlated with several language-internal variables, some of which promoted weakening only in one dimension of the subsegmental description. For example, [s] tokens occurring word-finally were significantly longer than those occurring word-internally, whereas centroid was higher in word-final than in word-medial position.
In light of these methodological concerns, we abandon symbolic representation and instead analyze s-realization in gradient terms. By so doing, we remove subjectivity in the coding process as much as possible and also capture the subtle acoustic information that is relevant to our understanding of the s-lenition process. We suggest that the subtle differences between relatively similar sounds (sounds that might be coded as the same sound in a categorical classification) are crucial to our understanding of the nature of sound variation and correlate with many of the same independent variables that have been previously examined, as well as several as yet unexplored. For example, if it is found that the sound /s/ has a shorter duration, lower centroid, and higher degree of voicing before a given consonant, we can predict that /s/ is more likely to lenite than in other environments in which more robust measurements are observed.
METHODS
Data collection/corpus
The data used in the present study come from sociolinguistic interviews conducted in Cali, Colombia. The participant pool in this study deliberately represents a relatively homogeneous group of speakers: eight female residents of Cali, between 20 and 26 years of age. The participants were natives of Cali and reported no speech or hearing disorders. All of the participants in the study pertained to approximately the same socioeconomic class (i.e., all had the equivalent of a bachelor's degree or were currently enrolled in university courses). The interviews, approximately 30 minutes each, were conducted by a native of Cali, Colombia, who met the same criteria as the participants she interviewed. The interviews included topics such as vacation and travel plans, diversions, schooling, food, dangerous situations, local shopping. The interviews took place in a quiet setting and were recorded using a solid-state Marantz PMD 670 (Mahwah, N.J.) compact flash recorder with a head-mounted unidirectional microphone.
Dependent variables
The three dependent variables described in this study—s-duration, centroid, and percent voicelessness—intend to capture temporal, spectral, and energy properties and have been used in previous studies looking at the identification and classification of fricative consonants (cf. Forrest, Weismer, Milenkovic, & Dougall, Reference Forrest, Weismer, Milenkovic and Dougall1988; Jesus & Shadle, Reference Jesus and Shadle2005; Silbert & de Jong, Reference Silbert and de Jong2008). A sequential set of at least 200 tokens was selected, starting at least 10 minutes into each interview. The decision to exclude tokens from the first 10 minutes of each interview is because speakers tended to be most conscious of their speech early on in a recorded conversation and, therefore, were more likely to display a more careful style at the beginning. The total number of tokens in this study is 1777, which are drawn from both syllabic positions: 1177 syllable-initial (66% of the data) and 600 syllable-final (34%). With regard to the distribution of tokens across word position, the data in this study included 416 word-initial (23% of the data), 956 word-medial (54%), and 405 word-final (23%) cases.
It was necessary to exclude tokens that were produced with two s-realizations, which were impossible to disambiguate. For example, in utterances such as los sacerdotes ‘the priests’, where two s-realizations are produced as a coalesced whole, it is impossible to distinguish them. Other examples include the reduction of entonces ‘then’, whose variable production includes forms such as [en-tõs] and [tõs] among a long list of others. Such cases were also excluded because of the impossibility of determining which /s/ was reduced or retained.
The researchers used Praat (version 5.0.31 for Mac) to assist in coding the tokens and to take all of the acoustic measurements. The first of the three dependent variables, s-duration, was coded by manual delimitation. As with traditional categorical analysis, the delimitation techniques employed here are not immune to human error. Thus, the researchers adhered to strict operational procedures to ensure a uniform coding process, as well as to allow future investigators to replicate this study. The researchers attended to both the waveform and the spectrogram to delimit the left and right boundaries of the visible high-frequency noise associated with the /s/, which generally is concentrated in the 4–11 kHz range of the spectrogram. Ladefoged (Reference Ladefoged2003:103) suggested that “spectrograms cannot give such precise information in the time domain as expanded scale waveforms, which readily permit measurements in milliseconds.” When clear aperiodic frication was present in both the spectrogram and the waveform, which is typical of the more robust cases of s-retention, the researchers relied on the waveform to delineate the boundaries. Specifically, the onset of /s/ sequences was delineated at the zero-intercept point closest to the first sign of aperiodic noise in the waveform, whereas the offset was set at the zero-intercept point closest to the cessation of the aperiodicity.
Because fricative consonants produce highly variable noise, statistical techniques are quite useful in investigating the variation in fricative spectra. The second dependent variable in this study includes one of the spectral moments (Forrest et al., Reference Forrest, Weismer, Milenkovic and Dougall1988), namely, centroid (sometimes variably referred to as center of gravity), which measures the central tendency (i.e., the mean) of the spectrum. Simply put, the centroid is a weighted average of the frequency peaks over a specified duration. Lowering of the centroid is interpreted as a weakening tendency.
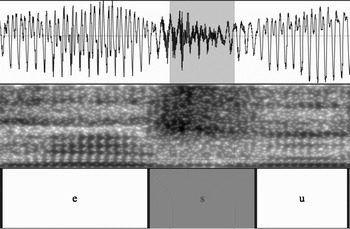
To calculate centroid, the script located the manually delimited interval and then divided it by 10 so that the middle 6 of 10 parts, that is 60%, could be used to calculate the centroid. The decision to use only the middle 60% of each sibilant was based on the desire to avoid the influence of surrounding segments at the transitional boundaries.Footnote 2Figure 1 displays the word-initial sibilant in suspiro, within the phrase le dice suspiro ‘one calls it suspiro’. The highlighted gray portion in the waveform represents the middle 60% of the delimited sibilant from which centroid was calculated.Footnote 3
Centroid calculated from middle 60% of duration.

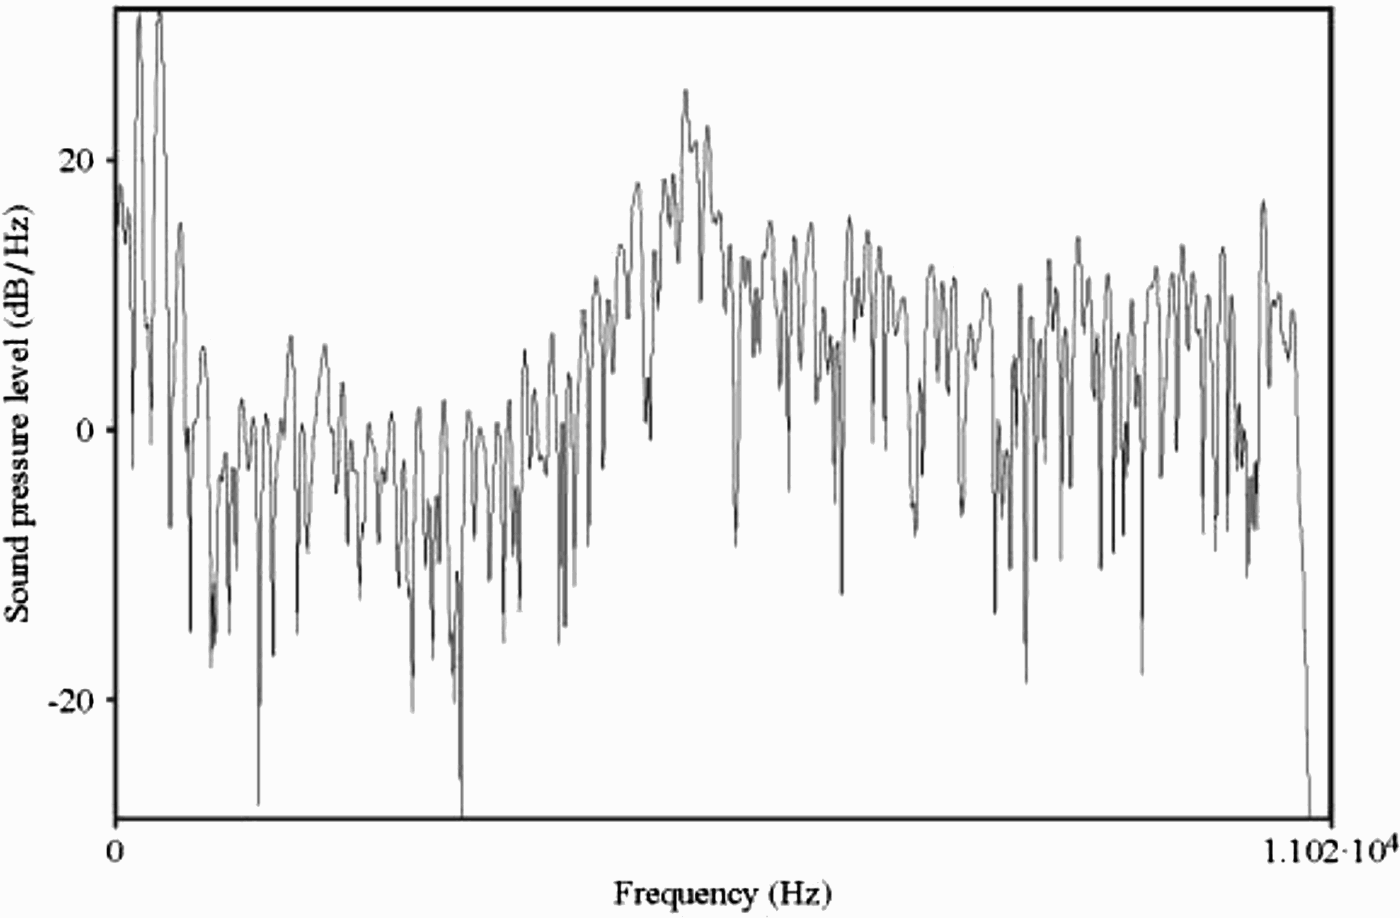
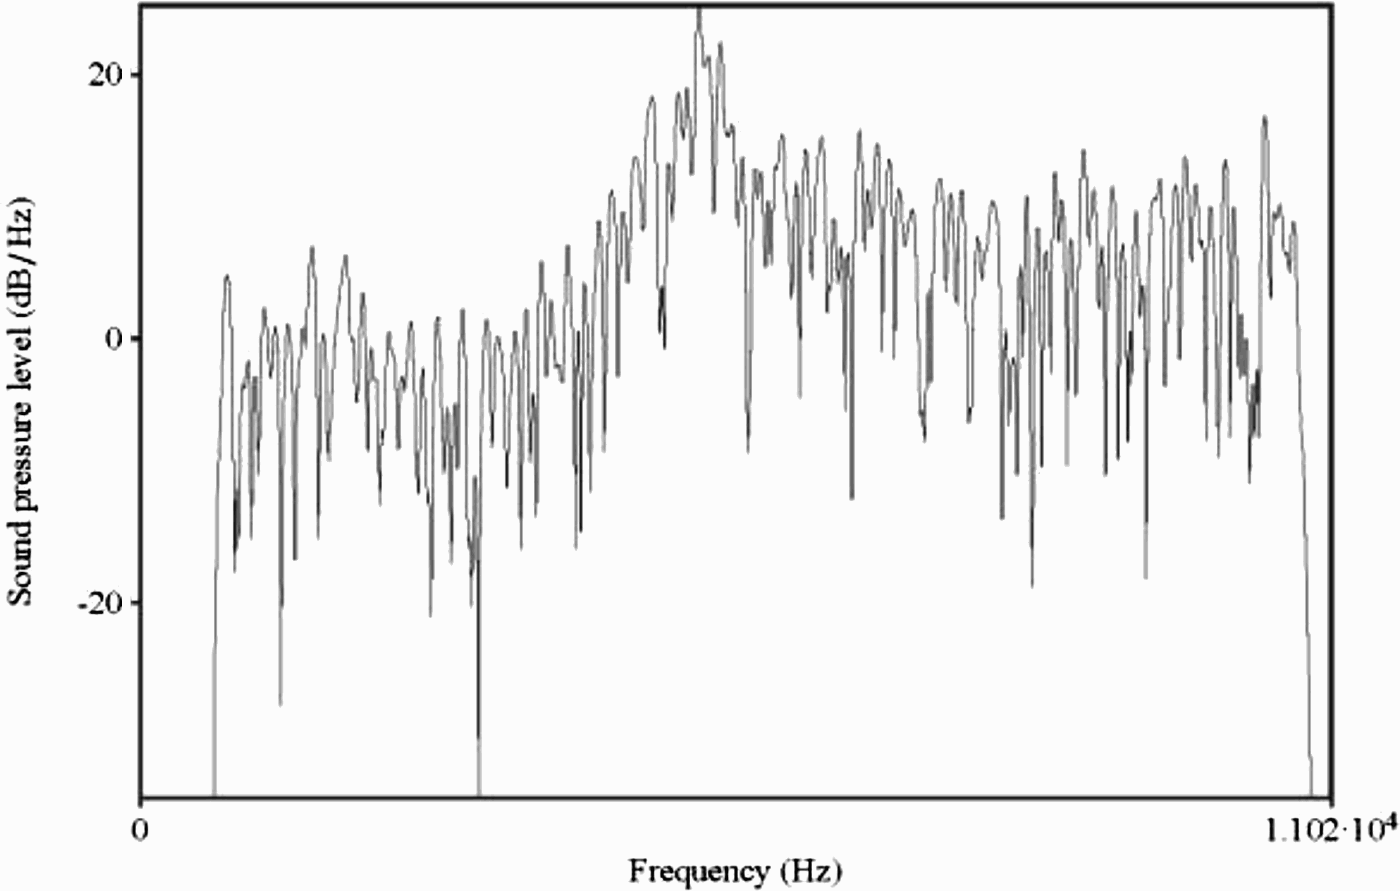
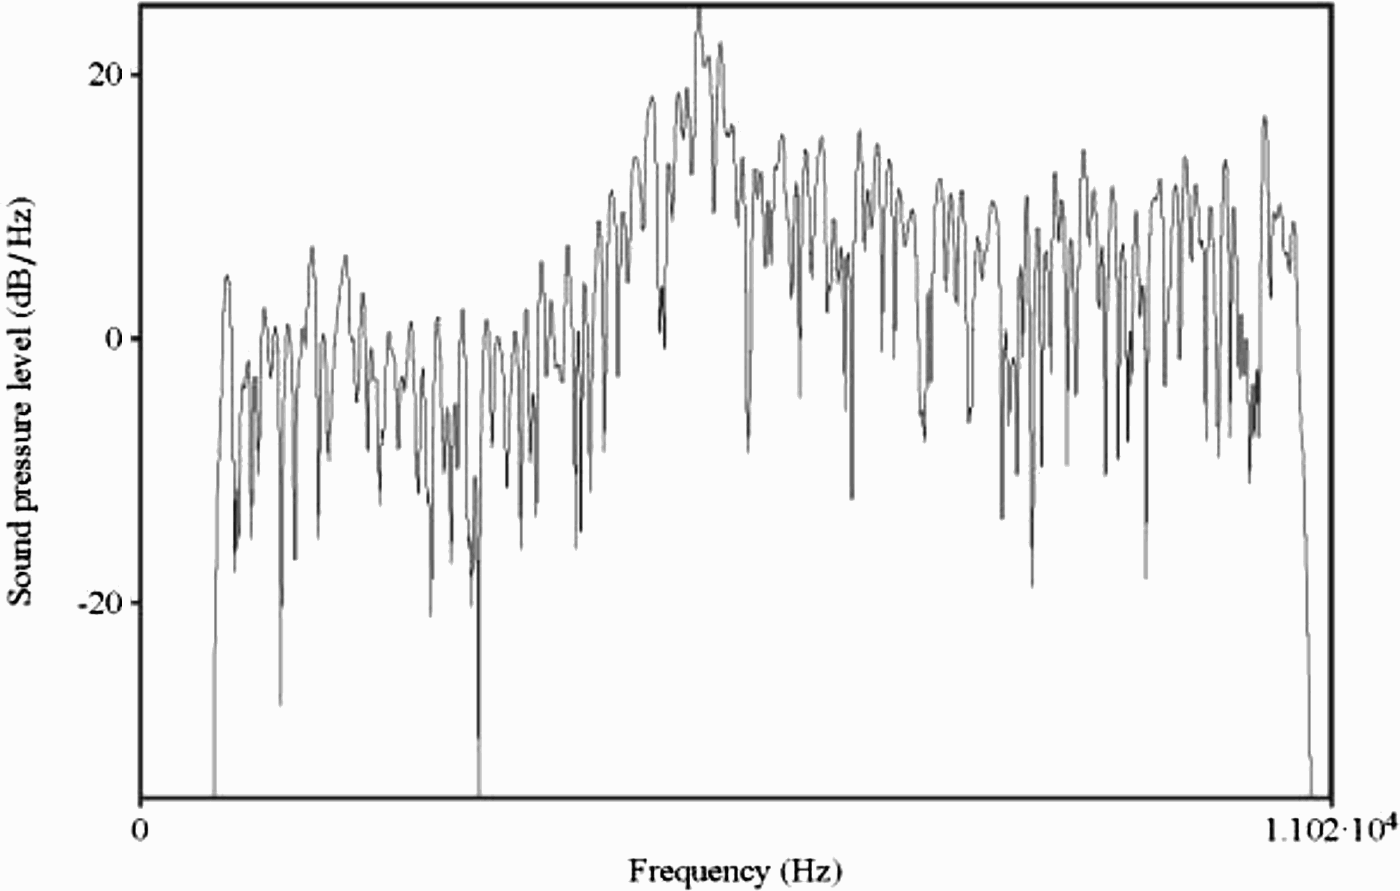
Following Silbert and de Jong (Reference Silbert and de Jong2008:2772), the calculation of centroid was limited to frequencies above 750 Hz with a pass Hann band filter, as this was intended to capture only the noise component of the fricatives and not the energy produced by glottal pulsing (i.e., voicing), which is located predominantly in the lower frequency range (below 750 Hz). The inclusion of voicing in this measurement would lower the overall centroid, masking the distribution of high-frequency noise in the 4–11 kHz range. Figure 2 shows a spectral slice of the same delimited interval from Figure 1, which includes the whole frequency range of 0–11 kHz. This can be compared to Figure 3, which shows the spectral slice after the pass Hann filter was applied (750 Hz–11 kHz).
Spectral slice of word-initial /s/ of suspiro ‘suspiro’ (0–11 kHz).
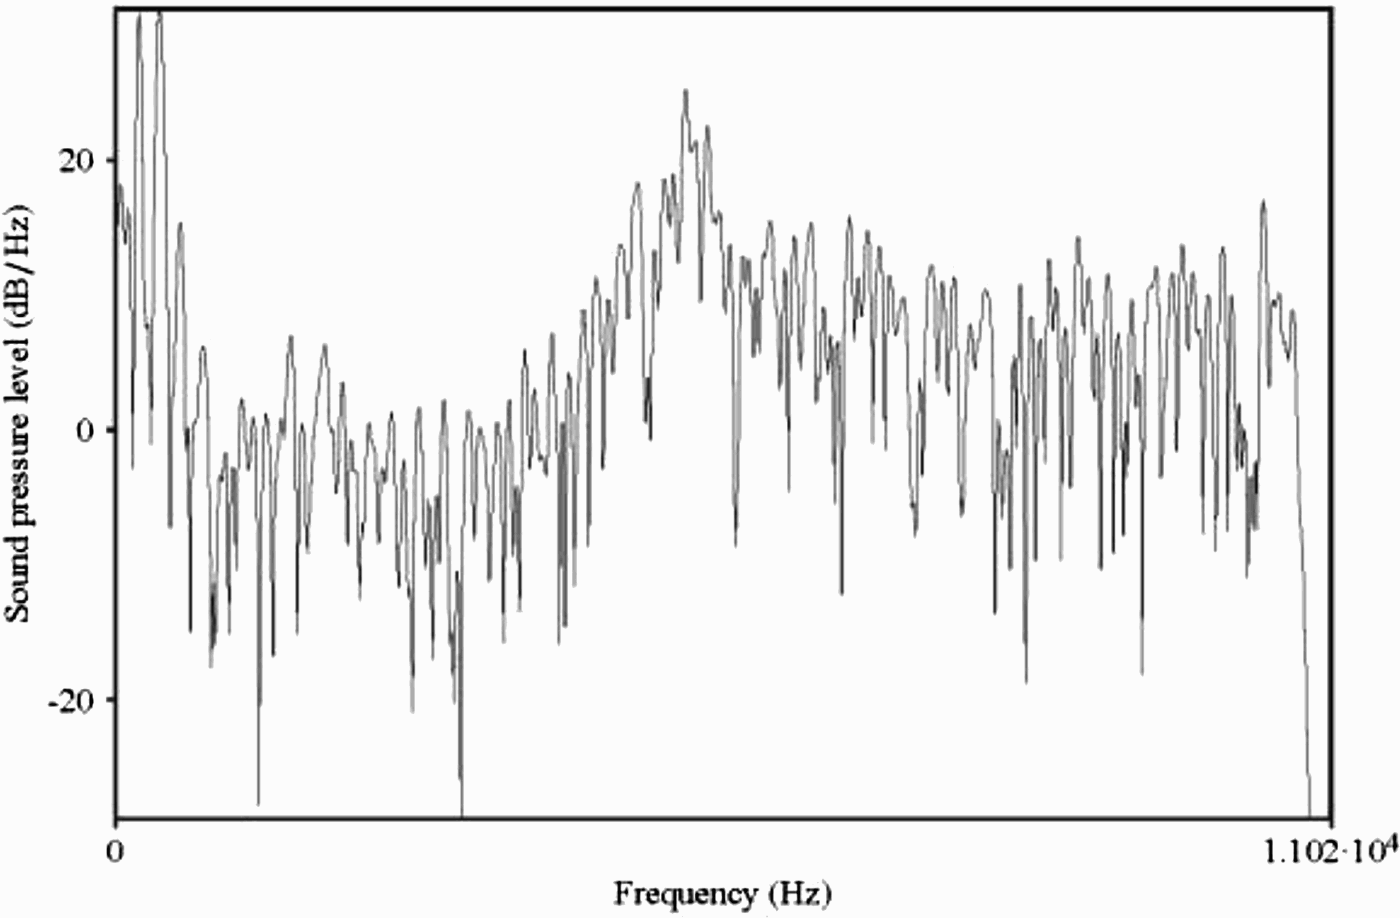
Spectral slice of word-initial /s/ of suspiro ‘suspiro’ with filter (750 Hz–11 kHz).
The third dependent variable, percent voicelessness, was taken from the Voice Report in Praat. This measurement was automated with the script so that each sibilant filled exactly two-thirds of the Editor Window, something difficult to do by hand. It is important to create uniformity across the tokens as the amount of the Editor Window filled by a given sound can affect the Voice Report. Voicing is regarded as a weakening tendency, as it is incompatible with the high airflow necessary for strong sibilance noise; any degree of voicing will weaken the intensity of the spectra of [s] and therefore erode the perceptual acuity of the sound.Footnote 4
The dependent variables proposed in this study are also perceptually motivated. Widdison (Reference Widdison1991:92–97) identified a number of cues in the acoustic signal that have traditionally been associated with the perception and categorization of the sounds [s] and [h], including the distribution of acoustic frequency, amplitude, and duration of the sibilance present. However, he indicated that although all of this information is available to the listener, not all of it might be of equal significance in sound recognition and categorization: “Some cues undoubtedly serve a primary function in decoding the signal while others offer secondary support. However, all cues are necessarily integrated in speech perception since supporting criteria may help disambiguate a sound whose principal cues either conflict or have been degraded” (Widdison, Reference Widdison1991:92).
With regard to the perceptual importance of s-duration, most researchers (cf. Krieg, Reference Krieg1980:52) point out that a long interval of intense high-frequency noise is one of the important distinguishing features that set an [s] apart from an [h]. Similar observations have been made with respect to the perceptual importance of the quality of the frication, pointing out that the frequency ranges of the energy during frication represent the necessary and crucial cues for the identification of fricatives (Harris, Reference Harris1958:5; Jesus & Shadle, Reference Jesus and Shadle2005; Silbert & de Jong, Reference Silbert and de Jong2008; Widdison, Reference Widdison1991:93). Finally, voicelessness is also motivated in terms of perceptual salience and the sonority hierarchy (Clements, Reference Clements, Kingston and Beckman1990). Voiced sounds are considered to be more lenited, or further down the lenition cline, than are voiceless sounds. Thus, the degree of s-voicelessness is important to our understanding of the extent of lenition of each token.
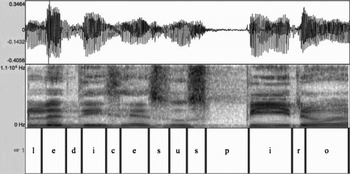
Figure 4 provides a clear illustration of several s-realizations that were unambiguously transcribed as [s] by seven graduate students enrolled in a Spanish Phonology course at the University of New Mexico with one semester of training using the IPA.Footnote 5 The phrase uno le dice suspiro, loosely translated as ‘one calls it suspiro’ contains three different s-realizations. The first instantiation, which is found in the orthographic c of the word dice, was produced with a duration of 43 msec, a centroid of 6743 Hz, and is voiced throughout its production (0% voiceless). This can be contrasted with the second two occurrences in the word suspiro, which have durations of 61 and 56 msec, centroids of 6520 and 6110 Hz, and voiceless measures of 0% and 40%, respectively. This illustrates how the researcher, by employing instrumental measurements, is able to capture gradient differences across individual tokens of /s/ that were categorized as “identical” within a symbolic account. In other words, if a categorical approach is adopted, the underlying assumption is that these intercategory differences are irrelevant.
Waveform and spectrogram of le dice suspiro ‘one calls it suspiro'.Footnote 6

Not all cases of /s/ are realized with the clear aperiodic onsets and offsets shown in Figure 4. For example, during the closure of a following voiceless stop there is often aperiodic ambient noise, which is visible in the waveform, but which shows no high-frequency noise in the spectrogram. In these cases, the researchers relied on the spectrogram to delineate the offset at the point where the high-frequency noise ceased. Another example that required special consideration was postvocalic aperiodicity. To maintain uniformity, the researchers elected to consider only the frication between 4 and 11 kHz as noise associated with /s/. If frication did not occur within this range, the token was coded as deleted.Footnote 7
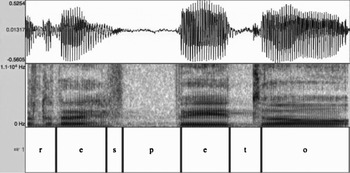
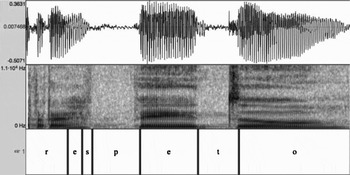
Figures 5 and 6 illustrate weakened realizations of /s/ in two separate utterances of the word respeto ‘respect’, which were produced by the same informant. Both of these tokens were unambiguously transcribed as “weakened” by the same seven graduate students. However, there was wide disagreement as to whether or not there was residual frication present in the signal. This ambiguity can be resolved by appealing to instrumental measurements. The first example (Figure 5) was produced with a duration of 37 msec, a centroid of 3451 Hz, and was 25% voiceless. This can be contrasted with the second example (Figure 6), which had a duration of 26 msec, a centroid of 2098 Hz, and a measure of 0% voiceless. The advantage of appealing to instrumental measurements seems apparent. We are able to capture and articulate gradient differences across even the weakened realizations of /s/, which are difficult (if not impossible) to categorize systematically using a symbolic account. Figures 5 and 6 (i.e., weakened /s/) can be contrasted with the s-realizations in Figure 4 (i.e., retained /s/), in which the gradient differences are captured across all three dependent variables.Footnote 8
Waveform and spectrogram of respeto ‘respect' (Token 1).

Waveform and spectrogram of respeto ‘respect' (Token 2).

Independent variables
This study analyzes the conditioning effect of 11 independent variables (or factor groups), most of which have been analyzed in previous studies: (1) local speaking rate, (2) prosodic stress, (3) word position, (4) syllabic position, (5) preceding phonological context, (6) following phonological context, (7) word length, (8) lexical frequency, (9) bigram-one frequency, (10) bigram-two frequency, and (11) informant.
The local speaking rate was calculated by dividing the number of phonemes in the three-word phrase surrounding /s/ by the duration of that phrase, resulting in a scalar measurement of phonemes per second immediately around each token of /s/. The /s/ segment itself was taken out of this calculation to avoid a circular definition (Maddieson, personal communication). When a pause preceded or followed the word in which /s/ occurred, the number of words in the surrounding phrase decreased accordingly, so that only two words, or occasionally one, were employed in the calculation of the local speaking rate.Footnote 9
The prosodic stress was coded as either tonic (e.g., persona [peɾ-ˈso-na] ‘person') or atonic (parecen [pa-ˈɾe-sen] ‘they appear'). When word-final /s/ was followed by a vowel (with no intervening pause), resyllabification was assumed (e.g., dos años ‘two years' > [do-ˈsa-ɲos]) and stress was coded accordingly. Word position was coded as initial, medial, or final, as in señora ‘woman/ma'am', hasta ‘until' or casa ‘house', and lunes ‘Monday', respectively. Similarly, syllabic position was coded as either initial or final. In only word-initial position is there overlap between word position and syllable position, as word-initial /s/ is always in syllable-initial position, but word-medial and word-final /s/ can be in either syllable position. Both the preceding and following phonological contexts were coded as pause, high vowel (/i, u/), nonhigh vowel (/a, e, o/), coronal consonant, or noncoronal consonant. The vowels were grouped by height as Brown and Torres Cacoullos (Reference Brown, Torres Cacoullos, Johnson and Sanchez2002, Reference Brown, Torres Cacoullos, Núñez-Cedeño, López and Cameron2003) and E. L. Brown (Reference Brown2004, Reference Brown2005) have shown a significant conditioning effect from this variable, such that /s/ is more likely to be reduced when there is an adjacent nonhigh vowel rather than a high one. Word length was measured by the number of phonemes in the word, which created an ordinal variable with a range of 2–18 phonemes.Footnote 10
Lexical frequency was measured by calculating the number of occurrences of each s-word in a combined corpus of Caleño Spanish, the corpus from which the tokens for this study were extracted, as well as a corpus of spontaneous conversations from 38 speakers between the ages of 21 and 55 (Travis, Reference Travis2005). The total number of words in the combined corpus is 177,722. Bigram-one frequency measures the number of occurrences of the two-word string in which the s-word is preceding by another word (e.g., no sabía ‘she/he didn't know'). Bigram-two frequency measures the number of occurrences of the two-word string in which the s-word is followed by another word (e.g., sabía que ‘she/he knew that'). The open source programming language R (R Development Core Team, 2010) was used to calculate both lexical frequency (i.e., the number of occurrences of the individual words) and the bigrams (i.e., the two-word strings) from the combined corpus.
Finally, the informant was entered into the statistical analyses to control for interspeaker variation caused by stylistic and physiological differences.Footnote 11
RESULTS
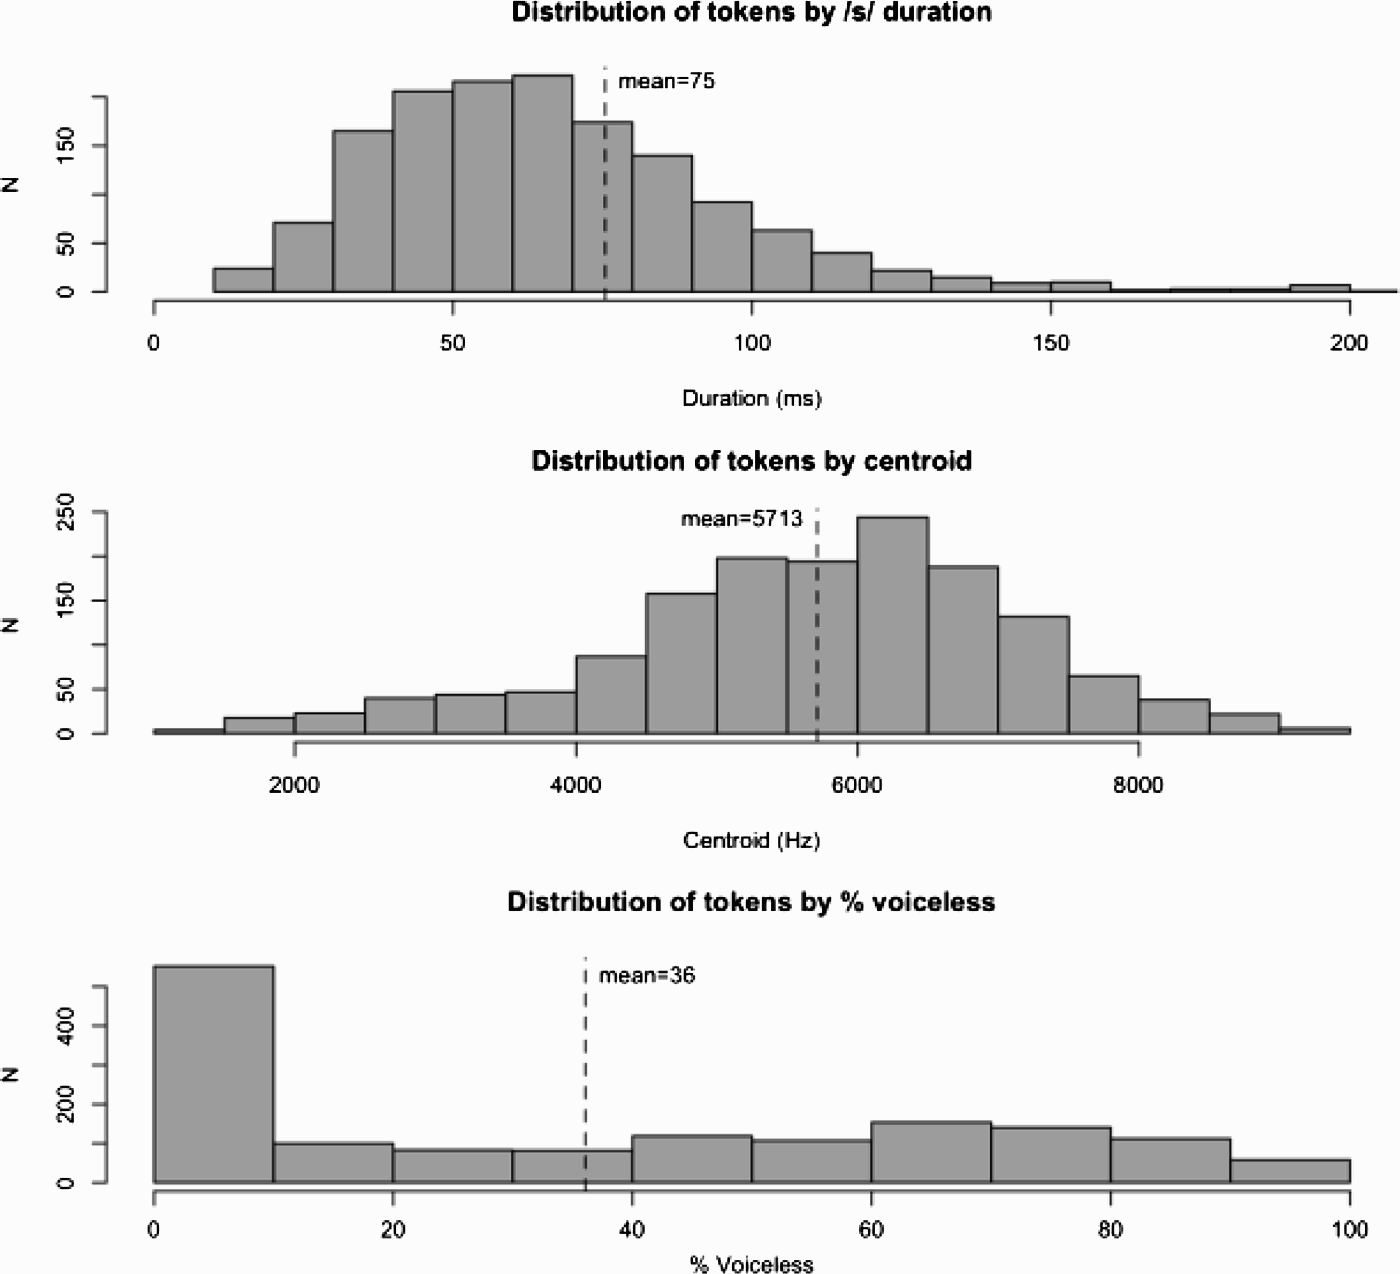
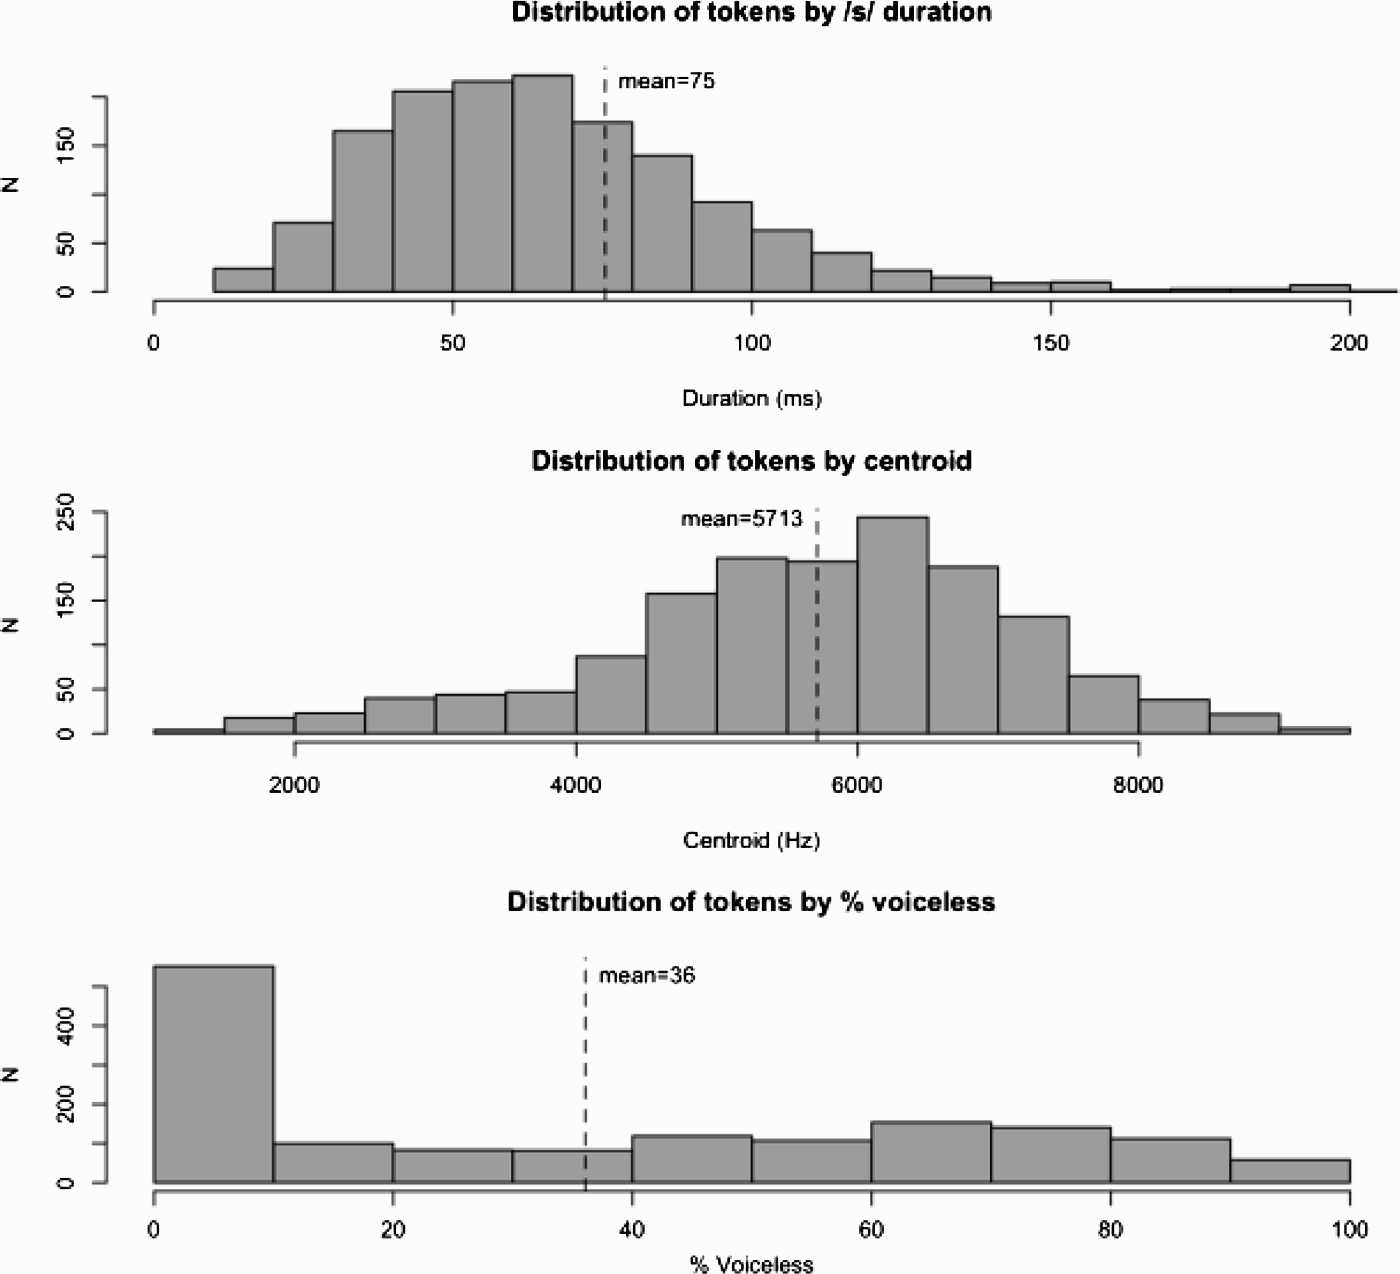
Figure 7 provides us with a general understanding of how the retained tokens (N = 1,508) were distributed across the three dependent variables. The 269 outliers (i.e., tokens that registered s-durations of 0 msec or exceeded 200 msec) are not included in the histograms. The means and standard deviations for each dependent variable including the outliers are as follows: s-duration (X = 64 msec; SD = 49 msec), centroid (X = 5046 Hz; SD = 2067 Hz), and %-voiceless (X = 31%, SD = 33%). When the outliers are excluded, the means increase slightly, while the standard deviations either decreased or remained unchanged: s-duration (X = 75 msec; SD = 44 msec), centroid (X = 5713; SD = 1449), and voicelessness (X = 36%; SD = 33%). One fact that stands out is that there is much more voicing of /s/ in Caleño Spanish than that acknowledged in traditional phonological descriptions of Spanish.
Distribution of retained tokens /s/ in three dependent variables.
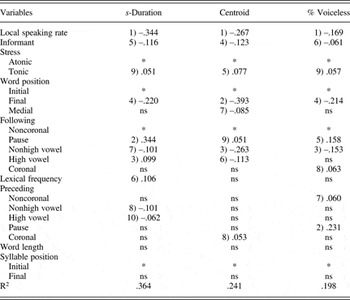
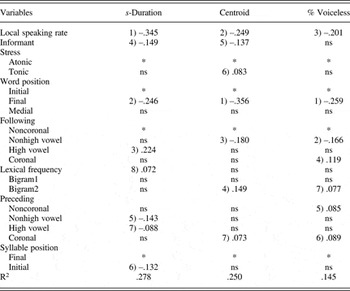
Linear regressions were run with SPSS (version 16.0 for Mac, SPSS, Inc., Chicago, Illinois) for each of the three dependent variables (s-duration, centroid, and voicelessness) using a forward stepwise selection procedure, in which the independent variables are sequentially entered into the model based on which ones have the largest correlation with the dependent variable. The coefficients indicate whether the corresponding independent variables significantly contribute (at an alpha level of p < 0.05) to the dependent variable under investigation. These numbers are used to interpret both the strength and direction of influence. The order of each variable's inclusion in the model precedes the coefficient and indicates the degree of correlation with the dependent variables. The coefficients farthest from 0 indicate the strongest influence on the dependent variables. The selection variables appear with asterisks (*), whereas “ns” indicates that the variables were “not selected” as significant predictors.
The first set of linear regressions (reported in Table 1) do not include the bigram frequencies, as their inclusion excluded several hundred tokens in which the s-word was either preceded or followed by a pause, as a pause followed by a word or a word followed by a pause are not bigrams. The influence of the bigram frequencies will be addressed in the second set of regressions (reported in Table 2).
Coefficients from three linear regressions (bigram frequencies excluded)

Note: * = selection variable; ns = not selected.
Coefficients from three linear regressions (bigram frequencies included)

Note: * = selection variable; ns = not selected.
The results in Table 1 allow us to make several fundamental observations. First, several independent variables are powerful predictors of s-realization. They are local speaking rate, word position, following phonological context, stress, and individual informant. Each of these variables (or one or more of their subcategories) were selected as significant predictors for all three dependent variables and, with one exception (i.e., following high vowel), show the same direction of influence. The independent variable “local speaking rate” was selected first in all three regressions and has coefficients relatively far from 0, suggesting that it is the most influential independent variable in s-realization. As speaking rate increases, all three acoustic measures weaken (i.e., duration decreases, centroid lowers, and voicing increases). Similarly, when /s/ occurs in word-final position or is followed by a nonhigh vowel, the same weakening tendency is apparent across all three dependent variables. On the other hand, when /s/ is realized in a tonic syllable or is followed by a pause, the opposite effect holds: s-duration, centroid, and voicelessness increase, indicating that these factors strongly favor fortition (i.e., s-retention).
Another interesting finding deals with the location of /s/ with respect to a pause. Not surprisingly, a following pause (e.g., íbamos pues #) strongly correlates with an increase in s-duration caused by the absence of any segment that could impede its articulation. This is not the case with a preceding pause (e.g., son locos), which is likely the reason that this variable was not selected as significant. However, a preceding pause significantly conditions voicelessness, because the vocal chords are relatively inactive following a pause.
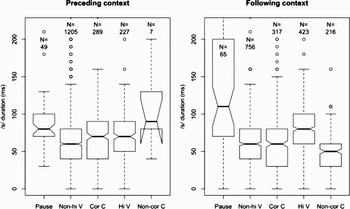
Similarly, the conditioning effect of a high vowel on s-duration seems to reverse depending on whether the high vowel precedes or follows /s/, as the coefficients straddle the zero threshold: –.062 for preceding position and .099 for following. This discrepancy is due to the drastic fluctuation of the conditioning effect of the selection variable (noncoronal consonants). The mean duration of /s/ is shorter when preceded by a high vowel than by a noncoronal consonant (71 msec vs. 107 msec). Consequently, in comparison to noncoronal consonants, high vowels in preceding position favor a shorter duration of /s/ and, hence, the negative coefficient number. However, in following position, the opposite is true. The mean duration of /s/ is longer when followed by a high vowel than by a noncoronal consonant (81 msec vs. 45 msec). The reason for the high fluctuation of s-duration when preceded and followed by noncoronal consonants (107 msec and 45 msec, respectively) seems to be a simple matter of the low number of tokens of noncoronal consonants in preceding position as compared to following position (7 tokens vs. 216). See Figure 8.
Duration of /s/ according to the preceding and following context.

Syllabic position was not found to be a significant predictor of any dependent variable. Although on the surface this finding seems to contradict previous research (see Lipski, Reference Lipski, Gutiérrez-Rexach and Martínez-Gil1999; Terrell, Reference Terrell1979),Footnote 12 it is worth noting that most of the s-leniting dialects considered in previous research are characterized as varieties in which s-weakening is restricted primarily to implosive position; thus, such studies generally limit their analyses to syllable-final and word-final positions because of the scarcity of s-weakening in the syllable-initial context. On the other hand, in a recent study that looks at a large sample (N = 11,517) of Caleño Spanish impressionistically, E. K. Brown and E. L. Brown (forthcoming) report that syllable-initial /s/ is quite vulnerable to weakening, with overall reduction rates at 13% in spontaneous speech. The present study corroborates these findings instrumentally and suggests that, in general, Caleño Spanish is a variety characterized by intervocalic s-weakening (i.e., where /s/ is realized in syllable-initial position). For example, a following nonhigh vowel significantly lowers voicelessness (–.153), centroid (–.263), and duration (–.101); following high vowels lower centroid (–.113); and preceding vowels shorten s-duration (–.101 for nonhigh vowels and –.062 for high vowels).Footnote 13 Our results regarding the weakening effects of following nonhigh vowels reflect the same pattern reported in Chihuahua, Mexico, for a following low vowel [a] (Brown & Torres Cacoullos, Reference Brown, Torres Cacoullos, Núñez-Cedeño, López and Cameron2003:28).Footnote 14
Word length, which has been reported as significant in past studies (Alba, Reference Alba and Alba1982; File-Muriel, Reference File-Muriel2007; Poplack, Reference Poplack1979), was not found to be a significant predictor of any of the three dependent variables in the present study. One possible explanation is that this variable may correlate with one (or more) of the other independent variables. A logical hypothesis is that longer words are uttered with an accelerated speaking rate in order to meet some rhythmic constraint. We tested this hypothesis with a Pearson's product-moment correlation test, which, indeed, indicated a positive significant correlation, albeit slight (cor = 0.13), between speaking rate and word length (t = 5.6729, df = 1775, p = 1.63e–08), such that as word length increases, speaking rate also increases. To our knowledge, the previous studies that found word length as a significant predictor of s-realization did not control for speaking rate, such that the interaction between these two variables was unknown.
Despite the relative homogeneity of this sample, s-realization varies significantly among the eight speakers in our sample. The variable “informant” was selected fifth for s-duration, fourth for centroid, and sixth for voicelessness, indicating significant influence. The fact that there are differences in centroid measurements between the speakers is not surprising, as these are likely caused by the characteristics of frication noise depend (to an unknown degree) on the unique shape of a speaker's vocal tract. For example, Silbert and de Jong (Reference Silbert and de Jong2008:2771) argued that the source spectrum for coronal fricatives depends, in part, on the shape and position of the lower teeth.
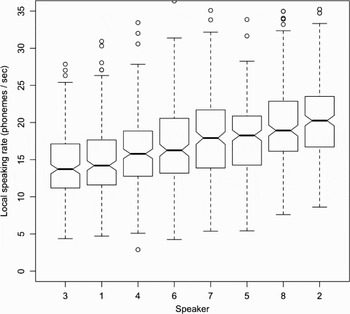
With regard to s-duration and voicelessness, a one-way analysis of variance was used to test speaking rate differences between the eight participants. Local speaking rate differed significantly between the participants (F(7, 1769) = 31.767, p = 0.000). Several Tukey post hoc comparisons of the participants indicate that Informant 2 (M = 20.475, 95% confidence interval [CI] [19.796, 21.154]) and Informant 8 (M = 20.780, 95% CI [19.687, 21.873]) had significantly higher local speaking rates than the other informants. They can be contrasted with Informant 1 (M = 15.141, 95% CI [14.337, 15.946]), Informant 3 (M = 14.512, 95% CI [13.919, 15.105]), and Informant 4 (M = 16.124, 95% CI [15.519, 16.729]), who generally employed a more deliberate local speaking rate. The local speaking rates of Informants 5, 6, and 7 are located between the two extremes. Figure 9 elucidates these differences visually with box plots.
Distribution of local speaking rate according to speaker.

Although this figure clearly illustrates the differences in local speaking rates between the eight speakers, the assumption that the local speaking rate is only a consequence of the overall speaking rate of a given speaker is not supported in these data. A series of linear regressions of the same independent variables tested individually analyzed the tokens from each speaker. The results show that the local speaking rate is, indeed, a highly significant predictor of s-duration in all eight speakers. With concern to centroid and voicelessness, the local speaking rate again shows a strong conditioning effect, as it was found to be significant in the speech of seven of the eight speakers.
As mentioned, the linear regressions reported in Table 1 exclude the bigram frequencies to allow the inclusion of all the tokens in this study (N = 1,777). To address the influence of the bigram frequencies, three more linear regressions were run in which these frequency measures were included, even though it meant the exclusion of several hundred tokens. As was the case in the original linear regressions, the lexical frequency of the word in which /s/ occurs was selected as significantly contributing to s-duration, but not to centroid or voicelessness. Although, the bigram-two frequency (e.g., sabía que ‘she/he knew that') was selected as a significant predictor of both centroid and voicelessness, bigram one was not selected as significant, as seen in Table 2.
DISCUSSION
When viewed in gradient terms, the results suggest that s-realization in Caleño Spanish is influenced by a variety of factors, including local speaking rate, word position, surrounding phonological context, stress, informant, lexical frequency, and bigram-two frequency. Of all the factors examined, local speaking rate appears to be the most significant predictor of s-realization in these data, as it was selected first in the three regressions reported in Table 1, and the coefficients indicate a strong influence. These findings provide more evidence that an increased rate of speech tends to occasion higher incidences of lenition and assimilatory processes.
Concerning the surrounding phonological context, the tendency for /s/ to weaken in word-final position is an illustrative example of phonological asymmetries across positions; certain word positions (e.g., word-final) are more vulnerable to weakening processes than others (e.g., word-initial) because of the differential role that such positions play in lexical retrieval (cf. Beckman, Reference Beckman1999, for the importance of positional faithfulness in explaining phonological asymmetries). The fact that s-weakening occurs when followed by a nonhigh vowel in these data supports results from studies of initial s-reduction in New Mexican Spanish (E. L. Brown, Reference Brown2004, Reference Brown2005) and Chihuahua (Brown & Torres Cacoullos, Reference Brown, Torres Cacoullos, Núñez-Cedeño, López and Cameron2003). With regard to stress and following pause, our results are interpreted as supportive of previous studies that report the strengthening effect of tonic stress (Alba, Reference Alba and Alba1982; Beckman, Reference Beckman1999) and following pause (Poplack, Reference Poplack1979). Although the preceding context is significant and relevant to s-realization, its influence is substantially less than that exerted by the following phonological context, which supports the broad general claim that Spanish is a language characterized more by regressive assimilatory processes than progressive ones (Schwegler, Kempff, & Ameal-Guerra, Reference Schwegler, Kempff and Ameal-Guerra2010:243–246).
This study highlights a few of the advantages of using instrumental acoustic measurements in lieu of traditional auditory analysis. The gradient approach allows us to make detailed observations regarding the temporal, spectral, and energy properties of /s/. First, certain independent variables appear to have consistent tendencies (of reduction and maintenance) across all three dependent variables. Thus, accelerated speaking rate, atonic stress, word-final position, and following nonhigh vowel show consistent reductive tendencies, whereas reduced speaking rate, tonic stress, word-initial position, and following pause manifest predictable tendencies for maintenance. Additionally, this study provides quantitative evidence that an accelerated speaking rate occasions higher incidences of reduction and assimilatory processes. Furthermore, our results with regard to speaking rate highlight the importance of controlling for this variable and its correlation with other independent variables, such as word length.
The gradient approach also permits more nuanced observations. The acoustic correlates are not affected equally by all the independent variables and may in fact go in opposite directions, which, to our knowledge, is a novel finding regarding s-lenition in Spanish. For example, the presence of a following high vowel tends to increase s-duration (indicator of fortition), lower the centroid (indicator of lenition), while not affecting the voicing (neutral effect).
The fact that the independent variables do not show the same magnitude of effect on all of the dependent variables has an important implication regarding our ability to identify the source of variation, which might ultimately undergo sound change. For example, when /s/ follows a pause (e.g., [#] sea también ‘like also'), the preceding pause creates an environment relatively resistant to sonorization, whereas neither the centroid nor the duration are affected. The source of variation for this particular example, then, lies in articulatory phonetics. Following a pause, the vocal chords are inactive, making the target sound impervious to voicing assimilation. This is a clear example in which important generalizations would otherwise be impossible to capture using traditional IPA categories, which collapse all relevant acoustic cues into several categorical labels (i.e., [s, z, h, Ø]).
Similarly, by employing gradient measurements of both dependent and independent variables, we gain a more accurate account of the conditioning factors previously reported in the literature. For example, Terrell (Reference Terrell1979) proposed that word length significantly conditions s-realization in Cuban Spanish. Specifically, he employed a binary distinction of word length and shows that polysyllabic words are more likely than monosyllabic words to have a lenited /s/. However, when analyzed as a gradient variable by the number of phonemes (which in these data range from 2 phonemes [e.g., es ‘be'] to 18 [e.g., internacionalizado ‘internationalized']), word length was not selected as a significant predictor of any of the acoustic measures of /s/ reported in Table 1.
In conclusion, we have proposed that scalar acoustic measures (when available) are preferred to symbolic representation. First, scalar variables allow the researcher to address the actual acoustic parameters that are immeasurable with categories, making possible the detailed study of gradient phenomena. Second, by analyzing s-realization in terms of three dependent variables, we are able to observe the variable influence of the independent factors that have long been studied in the literature. Third, scalar measures analyzed with software (such as Praat) are less vulnerable to transcriber bias, as transcription encourages the researcher to impose segmentation on inherently gradient phenomena.