

1. Introduction
Gender inequities afflict large parts of the world (Dilli et al., Reference Dilli, Rijpma and Carmichael2015). Female genital mutilation wreaks havoc on women's health and sexual autonomy in many African countries. Recent data suggests that in at least 10 countries more than 65 percent of women between the age of 15–49 have suffered genital mutilation. In Guinea, the number was 96.8 percent.Footnote 1 Laws discriminating against women exist in 155 countries and effectively reduce women to second-class citizens. In 32 countries, a woman cannot apply for a passport without the consent of her husband. In Saudi Arabia, every woman must have a male guardian (father, brother, or husband).Footnote 2
Gender equality is therefore high on the international community's list of priorities, and it is seen as both intrinsically and instrumentally important. To the United Nations, gender equality is a ‘fundamental human right’ and a necessary foundation for a peaceful, prosperous, and sustainable world;Footnote 3 to the World Bank, gender equality is a ‘core development objective’ and smart economics, enhancing productivity and improving other development outcomes;Footnote 4 and to the International Monetary Fund, gender equality is an ‘important development goal’ and contributes to broader economic development, for instance through higher levels of school enrollment for girls.Footnote 5 In 2015 gender equality was institutionalized as Sustainable Development Goal (SDG) #5.
But how is gender equality best instigated on a global scale? A leading candidate causal influence on gender equality is the institution of democracy (Jones, Reference Jones2006; Fallon, Reference Fallon2008; Beer, Reference Beer2009; Blankenship and Kubicek, Reference Blankenship and Kubicek2018). Theoretically, democracy and gender equality should go hand in hand. While numerous structural factors in developing countries put women at a disadvantage vis-à-vis men, and while democratization will not alleviate all these factors, democratization does create political opportunity structures that women benefit from. Women's organizations can organize and become more active with little retribution. External actors focusing on equity, human rights, and good governance can help women's organizations increase their activities and gain visibility. Women's organizations can also use elections to engage the state in addressing women's concerns. Empirically, Beer (Reference Beer2009) and Sundström et al. (Reference Sundström, Paxton, Wang and Lindberg2017) indeed find that measures of democracy predict gender equality in country panels.Footnote 6 In a case study of South Korea, Jones (Reference Jones2006) finds that democratization has enabled women to secure significant policy, institutional, and representational changes. Fallon (Reference Fallon2008) paints a comparable picture for Ghana.
Proponents of modernization theory remain skeptical of a causal link between democracy and gender equality.Footnote 7 Inglehart et al. (Reference Inglehart, Norris and Welzel2002) argue that the process of modernization leads to both democratization and a concurrent rise in the proportion of women in public life. Put another way, economic modernization brings unforeseen cultural changes that transform gender roles and make the emergence of democratic institutions increasingly likely. Modernization will remove traditional constraints on women and change the traditional sexual division of labor, thereby fostering the emancipation of women (Park, Reference Park1993). On this view, the correlation between democracy and gender equality documented by Beer (Reference Beer2009) and Sundström et al. (Reference Sundström, Paxton, Wang and Lindberg2017) is spurious.Footnote 8 Looking at sub-Saharan African countries from 1990 to 2014, for example, Blankenship and Kubicek (Reference Blankenship and Kubicek2018) find that stronger democratic records do not translate into superior records with respect to gender equality.
To move the discussion forward, I offer (to the best of my knowledge) the first design-based empirical evidence that democracy causes gender equality in a global sample.Footnote 9 I adopt a shock-based instrumental variables panel data design to span plausibly exogenous variation in democracy.
Building on the work of Huntington (Reference Huntington1991) and Andersen and Jensen (Reference Andersen and Jensen2019), I use the completely unexpected Second Vatican Council (1962–65), or simply Vatican II, as an instrument for democracy. Vatican II transformed the Roman Catholic church from defender of the ancien régime into apostle of religious freedom, human rights, and democracy. Vatican II recognized the right of every person to religious freedom and acknowledged the principle of separation of church and state. The church's support of the modern human rights discourse allowed it to play a critical role during the third wave of democratization (Payne, Reference Payne1984; Mainwaring, Reference Mainwaring1986; Huntington, Reference Huntington1991; Fleet and Smith, Reference Fleet and Smith1997; Weigel, Reference Weigel2003). Therefore, what drives my plausibly exogenous variation in democracy is the fact that Vatican II, econometrically speaking, was a shock that both brought forward in time transitions to democracy that would have happened anyway and triggered transitions to democracy that would not otherwise have occurred (Huntington, Reference Huntington1991).
The empirical measure of gender equality that I use is women's political empowerment, which Sundström et al. (Reference Sundström, Paxton, Wang and Lindberg2017: 322) define as ‘a process of increasing capacity for women, leading to greater choice, agency, and participation in societal decision-making’. When women become more empowered politically, they make choices that are desirable for children, women, and society. Aidt and Dallal (Reference Aidt and Dallal2008) find that women prefer more social spending than men; Chattopadhyay and Duflo (Reference Chattopadhyay and Duflo2004) find that political leaders invest more in infrastructure that is directly relevant to the needs of their own genders; and Alexander et al. (Reference Alexander, Bagenholm and Charron2020) find that female voters are less tolerant of corruption than male voters. Progress on the Sundström et al., measure of women's political empowerment represents more gender equality per se (direct effect); but, for the reasons mentioned, women's political empowerment may also produce other societal outcomes that are more gender equal (indirect effect). This echoes the fact that many see gender equality as both intrinsically and instrumentally important, as explained above.
The empirical measure of democracy that I use is the dichotomous coding of Boix et al. (Reference Boix, Miller and Rosato2013), where a country is considered a democracy if political leaders are chosen through free and fair elections and a majority of adult men are allowed to vote. In the present context, the coarseness of the democracy measure is a feature, not a bug. If aspects of gender equality are simply contained in the definition of democracy, I risk ending up regressing gender equality on gender equality.
Having described the two main empirical variables, I can narrow down my research question to the following: Does being a democracy that features contestation and a minimal threshold for participation lead to higher gender equality as measured by women's political empowerment? My results suggest that it does.
I structure the discussion as follows: Section 2 describes data and empirical strategy, section 3 presents results, section 4 sketches a causal mechanism, and section 5 offers concluding remarks.
2. Data and empirical strategy
In this section, I describe the empirical strategy and the data.
2.1 Specification
I bring the following simple empirical specification to the data:

GEit and DEMit are gender equality and democracy in country i at time t; the vector ${\bf x}_{{\rm it}}^{\rm {\prime}}$ includes three modernization controls: income per capita, average years of education, and the urbanization share. μt and δi are year and country-fixed effects. I motivate equation (1) by two observations.
First, modernization theory argues that countries that have experienced societal modernization are more likely to be democracies (Teorell, Reference Teorell2010). At the same time, modernization likely exerts a direct influence on gender equality. By including income per capita, education, and urbanization, I seek to isolate the effect that democracy exerts on gender equality from key modernization determinants. The literature has identified other (more structural) modernization determinants. A partial list includes state involvement in the economy, income inequality, natural resource abundance, country size, religious composition, societal fractionalization, colonial heritage, social capital, and mass political culture (Teorell, Reference Teorell2010). Much of the variation in these structural determinants is cross sectional and picked up by the country-fixed effects in (1). Furthermore, many time-varying structural determinants are largely governed by a limited set of deep causes, several of which are time-invariant geography and bio-geography variables (Spolaore and Wacziarg, Reference Spolaore and Wacziarg2013). The variation in these geography and bio-geography variables is also cross sectional and picked up by country-fixed effects.Footnote 10
Second, sociological literature emphasizes a transnational influence on (aspects of) women's political empowerment springing from the international women's movement (Paxton et al., Reference Paxton, Hughes and Green2006). From just a few organizations in Western countries in the early 20th century, by the 21st century the international women's movement had become a global influence that worked with international organizations such as the United Nations and various NGOs to diffuse global norms on gender equality (Paxton et al., Reference Paxton, Hughes and Green2006). The inclusion of time-fixed effects in equation (1) is, among other things, meant to pick up such global influences.
2.2 Identification
Democracy is likely endogenous in equation (1). I therefore use Vatican II (1962–65) to construct an instrument.Footnote 11 Let ${\rm I}_{\rm t}^{1965}$ be a dummy variable that takes the value 1 as of 1965, zero otherwise; and let CATHi be a time-invariant measure of the share of Catholics in country i. The variable $Z_{{\rm it}} = {\rm CAT}{\rm H}_{\rm i} \times {\rm I}_{\rm t}^{1965}$
 will serve as my instrument for DEMit in equation (1).Footnote 12 By using the share of Catholics, I concede that Vatican II can influence countries with even a small minority of Catholics, which (as I explain in section 4.1.1) was the case in South Korea.
As alluded to above, the secular implications of the sea change in official doctrine brought about by Vatican II were immense. Catholic efforts to support and promote democracy gained strength and clarity (Huntington, Reference Huntington1991; Philpott, Reference Philpott2007). John Paul II, Huntington (Reference Huntington1991) explains, had a way of showing up in full pontifical majesty at critical points in the democratization process. Consequently, Vatican II helped trigger the democratization process observed in its aftermath.Footnote 13
While the above suggests the presence of a strong first stage, it does not ensure that the shock forms part of a credible shock-based instrumental variables design (Atanasov and Black, Reference Atanasov and Black2016). For the design to be credible, the shock should preferably satisfy four conditions: (i) shock strength, (ii) shock exogeneity, (iii) only-through condition, and (iv) pretreatment common trends in instrumented variable and outcome variable. While (i) and (iv) are empirical questions to be addressed in a later section (see Figures 2 and 3 below), (ii) and (iii) must be defended. Therefore, I will discuss (ii) and (iii) now.
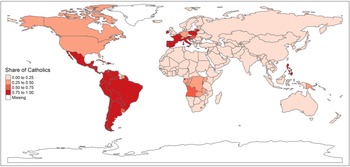
Global distribution of Catholics.
Notes: The figure displays the global distribution of Catholics as an average over the 1965–1995 period. The variable is based on the World Religion Dataset, which is documented in Maoz and Henderson (Reference Maoz and Henderson2013). The dataset can be downloaded from https://thearda.com/.

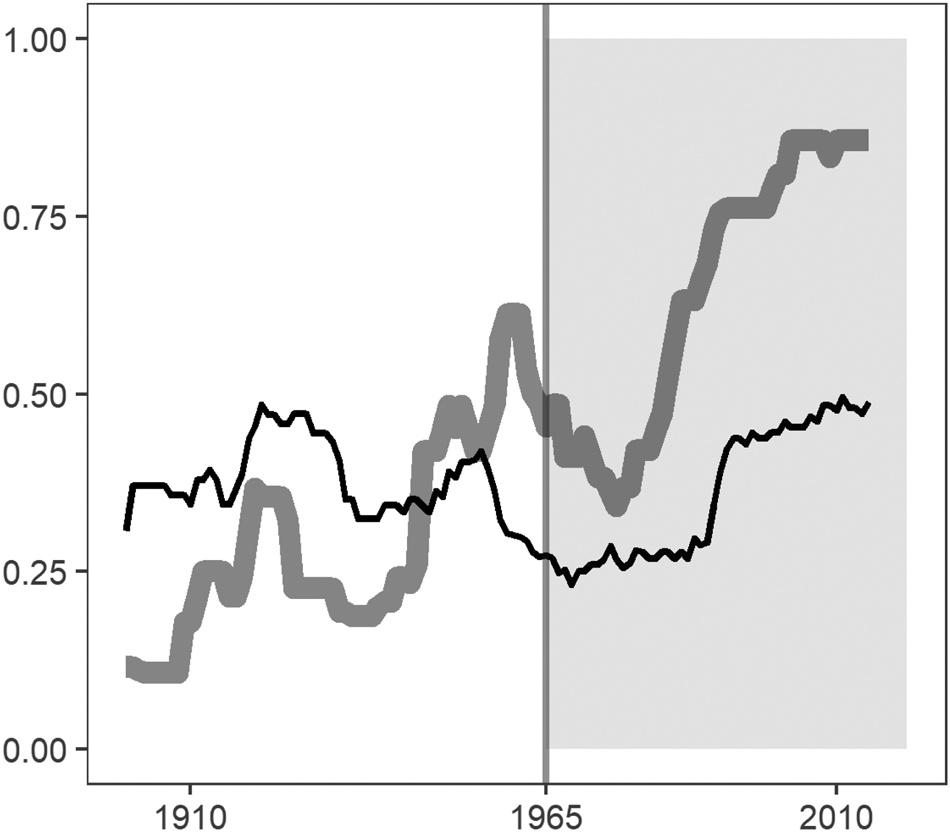
Pre- to post-shock change in the instrumented variable: democracy.
Notes: The figure plots the pre-shock to post-shock change in the instrumented variable, democracy (e_boix_regime), across Catholic (thick/grey line) and non-Catholic (thin/black line) majority countries. The vertical line marks 1965, the year Vatican II ended.

2.2.1 Exogeneity
Vatican II qualifies as an exogenous shock because it was an unlikely occurrence with an unexpected outcome that was only indirectly related to democracy.
Unlikely occurrence. On 25 January 1959, a mere three months into his papacy, Pope John XXIII called the council to the utter surprise of the church and the world at large. Pope Pius XII, the previous pope, died 9 October 1958, and the ensuing conclave had no favorites. Angelo Roncalli, who took the name John XXIII, gradually, but unexpectedly, appeared as the majority vote. Another candidate might not have called a council (Pesch, Reference Pesch2014). Pope John XXIII then died right after the council's first session. According to the 1917 Code of Canon Law, which was authoritative for the council, the sudden death of a pope during a council means that the council automatically ends unless the next pope commands its continuance (Pesch, Reference Pesch2014). With many being opposed to the council, there was a real (perhaps small) risk that the council would have been discontinued early on.
Unexpected outcome. Wilde (Reference Wilde2004: 577) writes that ‘no one expected, could have predicted, or even hoped for what came from the council.’ Most observers (bishops included) expected little from the council, as the preparatory commissions were firmly controlled by the eminently conservative Roman Curia, which did not welcome the council (Pesch, Reference Pesch2014). The preparatory commissions conspired to turn the council into a rubber stamp for the pre-conciliar ecclesiastical structures. Had it not been for the fortuitous opposition of Cardinal Achille Liénart of Lille (France), the curia would have prevailed.
At issue was the selection by vote of members to serve on the various conciliar drafting commissions that would shape the documents on which the bishops would eventually vote. To slant the vote, the Curia had produced a list of its preferred candidates. Cardinal Liénart upended the curia's effort by requesting that voting be postponed by one day, so that an alternative list could be circulated. The result of the cardinal's intervention was that the elected commissions at Vatican II became far more diverse than the curia had intended. And not only did the cardinal's intervention prevent conservatives from gaining control of conciliar commissions, but it also instigated a change of heart in many bishops. According to Bishop Robert J. Dwyer of Reno (USA) this was the moment when ‘[w]e realized that we were a council – not a class of schoolchildren that had been called together’ (Pesch, Reference Pesch2014: 85). Consequently, in the disorganized first few weeks of the council, progressives managed to build an organizational structure that would marginalize the role of the curia going forward (Wilde, Reference Wilde2007; Pesch, Reference Pesch2014).
Only indirectly related to democracy. Prior to Vatican II, the church maintained the doctrine that secular authorities should promote Catholic prerogatives and offer ‘error no rights’. Only truth had a right to exist, and the Catholic church, through the guidance of the Holy Spirit, held the complete and infallible truth. Where the state was Catholic, therefore, the church should demand that the state prevented non-Christian (preferably non-Catholic) expressions of opinion; where Catholics were in a minority, the church should demand that the state guaranteed the dissemination of Catholic doctrine (Andersen and Jensen, Reference Andersen and Jensen2019). Vatican II upended this way of thinking.
The leading document of Vatican II is Dignitatis Humanae, which is also known as the Declaration of Religious Liberty. The declaration had an enormous impact on the post-conciliar church's approach to politics (Weigel, Reference Weigel2003). It teaches that the best system of government is one that allows people to worship as they see fit. It teaches that while natural law requires all states to protect the rights of Catholics where they are a minority, the same obligation is conferred on Catholic states with respect to other minorities. And it teaches that within every human person is a sanctum sanctorum, a holy of holies, which must be respected by the state (Weigel, Reference Weigel2003).
The declaration not only profoundly challenges authoritarianism everywhere (Weigel, Reference Weigel2003), it also suggests a commitment to constitutional democracy (Grasso and Hunt, Reference Grasso and Hunt2005). The first half of the declaration speaks to reason. It makes the case that true faith is found in open and free dialog, which requires psychological freedom and freedom from coercion. The second half of the declaration is rooted in revelation. It makes the case that coercion in faith is the antithesis to Christ. Therefore, constitutional democracy, neutral on matters of religion, is the form of government most in keeping with Christian values (Sigmund, Reference Sigmund1987; Weigel, Reference Weigel2003; Grasso and Hunt, Reference Grasso and Hunt2005).
However, the Vatican was not officially approving a theory of liberal democracy; it was merely forbidding coercive restriction of the pursuit of truth (Philpott, Reference Philpott2004). Pope John Paul II puts it like this: ‘I am not the evangelizer of democracy; I am the evangelizer of the Gospel. To the Gospel message, of course, belong all the problems of human rights; and, if democracy means human rights, it also belongs to the message of the Church’ (cited in Huntington, Reference Huntington1991: 84). In other words, Vatican II was only indirectly related to democracy.
2.2.2 Only-through condition
Direct effect. Vatican II must only influence gender equality through democracy. It is unlikely that Vatican II directly influenced gender equality in any significant way, but I obviously cannot rule it out.Footnote 14 It is true, for example, that the Catholic church began to enlarge its understanding of women, their role in the family, and their social, political, and economic status following Vatican II. It is also true that Gaudium et spes,Footnote 15 one of the four Vatican II constitutions, contains the following passage: ‘For in truth it must still be regretted that fundamental personal rights are still not being universally honored. Such is the case of a woman who is denied the right to choose a husband freely, to embrace a state of life or to acquire an education or cultural benefits equal to those recognized for men’ (Gaudium et spes: 29). But, as noted by Madigan (Reference Madigan, Latinovic, Mannion and Welle2018: 87), until very recently many of the Catholic church's teachings continued to bear the imprint of Augustine of Hippo and Thomas Aquinas. Women are equal to men in the ‘order of salvation’, but they are naturally subordinate to men in the ‘order of creation’. Moreover, ‘although John XXIII and the Second Vatican Council acknowledged the changing role of women in the secular world, too often, both the ecclesial discourse of that time and subsequent discourse continued to feature an emphasis upon the biological functions for women, primarily as mothers and wives.’ In other words, the advancement of women in society must not be made at the expense of women's maternal role (Madigan, Reference Madigan, Latinovic, Mannion and Welle2018). In several Latin American countries, the Catholic church would oppose reforms that challenged its position on the family and reproductive rights (Jaquette, Reference Jaquette2001).
Indirect effect. Vatican II may have influenced cultural attitudes. Williams and Davidson (Reference Williams and Davidson1996), for example, provide evidence from focus group interviews that Vatican II led to a generational shift in faith among Catholics in the United States. Members of the pre-Vatican II generation hold an institutionalized conception of faith, seeing the church as a mediator between the individual and God, and they accept the authority of the church on all matters of religion, whether they concur or not. Members of the post-Vatican II generation are different. They emphasize an individual understanding of faith and a direct (almost friendly) relationship with God. This generation also describes a religious upbringing that differs from the pre-Vatican II generation. Williams and Davidson argue that this is to a significant extent an effect caused by Vatican II.
The link from Vatican II to individualistic cultural values threatens the only-through condition because individualist culture may stimulate demand for gender equality (Davis and Williamson, Reference Davis and Williamson2022). However, there is reason to think that demand for gender equality requires the political incentive structure provided by democracy to instigate a supply of gender equality. As I will show in section 4, the South Korean experience corroborates this view. Moreover, Lemke (Reference Lemke2016: 292) notes that ‘demand will not ensure market-clearing supply when it comes to political markets. Whether or not legislators will be motivated to discover and act upon the preferences of individuals depends upon the particular incentive structure of the political system they are operating within.’ Following an increase in individualistic values, therefore, equilibrium gender equality is more likely to increase in a democracy than in an autocracy. Nevertheless, the said link may interfere with my identification strategy.Footnote 16
2.3 DataFootnote 17
2.3.1 Women's political empowerment
As mentioned earlier, I use the women's political empowerment variable of Sundström et al. (Reference Sundström, Paxton, Wang and Lindberg2017) to measure gender equality. The variable is part of the Varieties of Democracy (V-Dem) Project.Footnote 18 V-Dem gathers information from existing sources and compiles expert ratings for questions that require evaluation. More than 2,600 local and cross-national experts provide judgments. As also mentioned earlier, women's political empowerment is a process of increasing capacity for women, leading to greater choice, agency, and participation in societal decision-making.
Women's political empowerment (v2x_gender in the V-Dem codebook) is based on three indices: civil liberties (v2x_gencl), civil society participation (v2x_gencs) and political participation (v2x_genpp). v2x_gencl combines indicators of women's freedom of domestic movement, freedom from forced labor, property rights, and access to justice. It aims to measure the degree to which women can make meaningful decisions in key areas of their lives. v2x_gencs combines indicators of women's freedom of discussion, participation in civil society organizations, and representation in the ranks of journalists. It aims to measure the degree to which women can express themselves and form and participate in groups. v2x_genpp combines the percentage of lower chamber female legislators and political power distributed by gender. It aims to measure the degree to which women are descriptively represented in formal political positions. v2x_gencl and v2x_gencs are both based on expert judgments, whereas v2x_genpp is also based on existing descriptive data sources. I will report results from both the composite index and its constituent parts.
The women's political empowerment index, v2x_gender, provides many advantages over traditional measures of gender equality (Webster et al., Reference Webster, Chen and Beardsley2019). First, it covers multiple facets of women's rights and participation in society. Second, it is the most comprehensive measure of gender equality; it dwarfs all existing measures in terms of coverage, spatially and temporally. Third, many existing measures have undergone methodological changes, rendering temporal comparisons difficult. Finally, the women's political empowerment index intersects the definition of ‘advances in gender equality’ given by Jones (Reference Jones2006: 18), which includes ‘policy changes that seek to promote women's individual and collective rights’ and ‘improvements in the quantity and quality of women's formal political representation’. It also intersects with SDG #5, which is gender equality and women's empowerment. The description of gender inequalities runs as follows:Footnote 19 ‘Women suffer from lack of access to decent work and face occupational segregation and gender wage gaps. In many situations, they are denied access to basic education and health care and are victims of violence and discrimination. They are under-represented in political and economic decision-making processes.’ The women's political empowerment index therefore captures important aspects of gender equality.
There are different conceptions of feminism, each of which leads to a different notion of gender equality. Women's political empowerment captures the type of gender equality associated with liberal feminism, which for the most part equates individuals' access to sources of power with their empowerment (Sundström et al., Reference Sundström, Paxton, Wang and Lindberg2017). Women become politically empowered when they are integrated into domains and structures historically dominated by males (Arat, Reference Arat2015). While liberal feminism informs the United Nations, it is not without detractors. Arat (Reference Arat2015: 675) critiques liberal feminism because policies ‘that seek gender equality by integrating women into existing institutions ignore the diversity of women and structural foundations of subordination, such as capitalism, race and class systems, and international power differentials’.
2.3.2 Democracy
As noted, I use the Boix et al. (Reference Boix, Miller and Rosato2013) dichotomous democracy measure (e_boix_regime). They define a country as democratic if it meets the following conditions for contestation (i–ii below) and participation (iii below):
(i) the executive is directly or indirectly elected in popular elections and is responsible either directly to voters or to a legislature,
(ii) the legislature (or the executive if elected directly) is chosen in free and fair elections, and
(iii) a majority of adult men has the right to vote.
By adopting this measure, I avoid that democracy marches in lockstep with women's political empowerment simply because aspects of gender equality are contained in the definition of democracy.
2.3.3 Modernization
As argued above, country-fixed effects will pick up persistent (slow-moving) determinants of modernization. In addition, I control for GDP per capita (e_migdppcln), average years of education among citizens older than 15 (e_peaveduc), and the urbanization share (e_miurbani), all included in V-Dem.
2.3.4 Vatican II
To construct the Vatican II instrument, ${\rm Z}_{{\rm it}} = {\rm CAT}{\rm H}_{\rm i} \times {\rm I}_{\rm t}^{1965}$ , I need a variable that measures how ‘Catholic’ a country is. To maximize the number of observations, I will rely on the average share of the population that is Roman Catholic during the third wave, 1965–1995; had I used the share in 1965, results would have been marginally stronger, but the number of observations would have been lower.Footnote 20 The share of Catholics is taken from the World Religion Dataset, which is documented in Maoz and Henderson (Reference Maoz and Henderson2013).Footnote 21
Figure 1 shows the global distribution of the share of Catholics. Inspection of the figure shows that Catholic majority countries are largely a European and a Latin American occurrence.Footnote 22
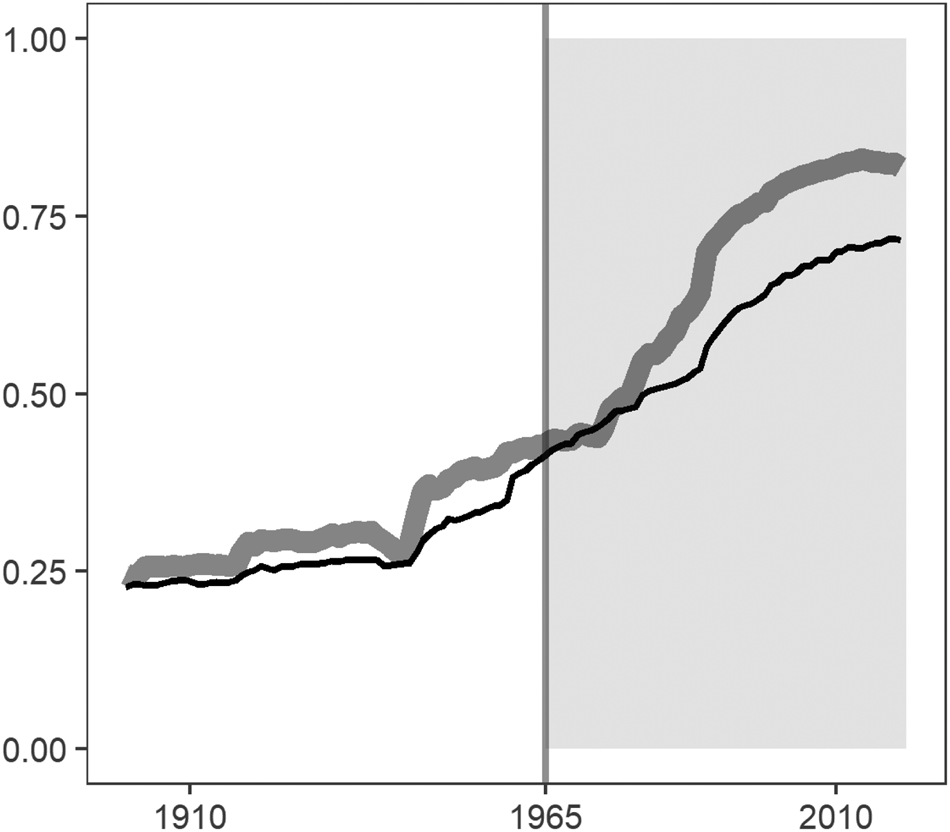
Pre- to post-shock change in the dependent variable: women's political empowerment.
Notes: The figure plots the pre-shock to post-shock change in the dependent variable, women's political empowerment (v2x_gender), across Catholic (thick/grey line) and non-Catholic (thin/black line) majority countries. The vertical line marks 1965, the year Vatican II ended.

3. Results
3.1 Main results
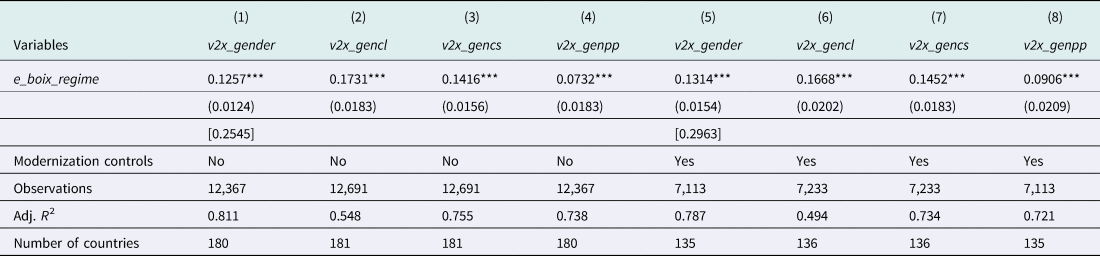
I start by reporting panel fixed effects regressions. Specifically, I estimate equation (1) when the dependent variable is women's political empowerment (v2x_gender) or one of its constituent parts: civil liberties (v2x_gencl), civil society participation (v2x_gencs) or political participation (v2x_genpp). In all regressions in Table 1, democracy predicts women's political empowerment and its constituent parts. With standard errors clustered at the country level, the partial correlations between democracy and the different measures of gender equality are always significant at the one percent level regardless of whether modernization controls are included or not.Footnote 23
Fixed effects regressions

Notes: Country and time-fixed effects are included in all columns. Modernization controls, all lagged one year, include real GDP per capita, average years of schooling, and urbanization rate. Cluster robust standard errors in parentheses.
*** p < 0.01, ** p < 0.05, * p < 0.1. Standardized coefficients in square brackets.
The economic significance of coefficients is best evaluated using beta coefficients (Wooldridge, Reference Wooldridge2013: 181–182).Footnote 24 Using the estimates in column 1 (without modernization controls) and column 5 (with modernization controls) of approximately 0.13, one standard deviation increase in democracy leads to about 0.25–0.30 standard deviation increase in women's political empowerment.
An obvious concern is that the partial correlations in Table 1 do not represent a causal link. I therefore use Vatican II as part of an identification strategy, as explained above.
As a first step, Figure 2 plots the pre- to post-shock change in the instrumented variable, democracy, across Catholic (thick/grey line) and non-Catholic (thin/black line) majority countries. Inspection of the figure reveals that the parallel pre-shock trends assumption is neither completely off nor perfect. The shock is most credible when both the instrumented and the outcome variables satisfy the parallel trends assumption. Therefore, any departure from this assumption is taxing on shock credibility. There is, however, a clear post-shock break of trend in Catholic-majority countries a decade or so after Vatican II.
As a second step, Figure 3 plots the pre- to post-shock change in the dependent variable, women's political empowerment, across Catholic (thick/grey line) and non-Catholic (thin/black line) majority countries. Here, the parallel pre-shock trends assumption is clearer. Moreover, there is a visible post-shock trend break in women's political empowerment. Provided the shock is credible, this reduced form variation is suggestive of a causal impact along the following lines: Vatican II → democracy → gender equality.
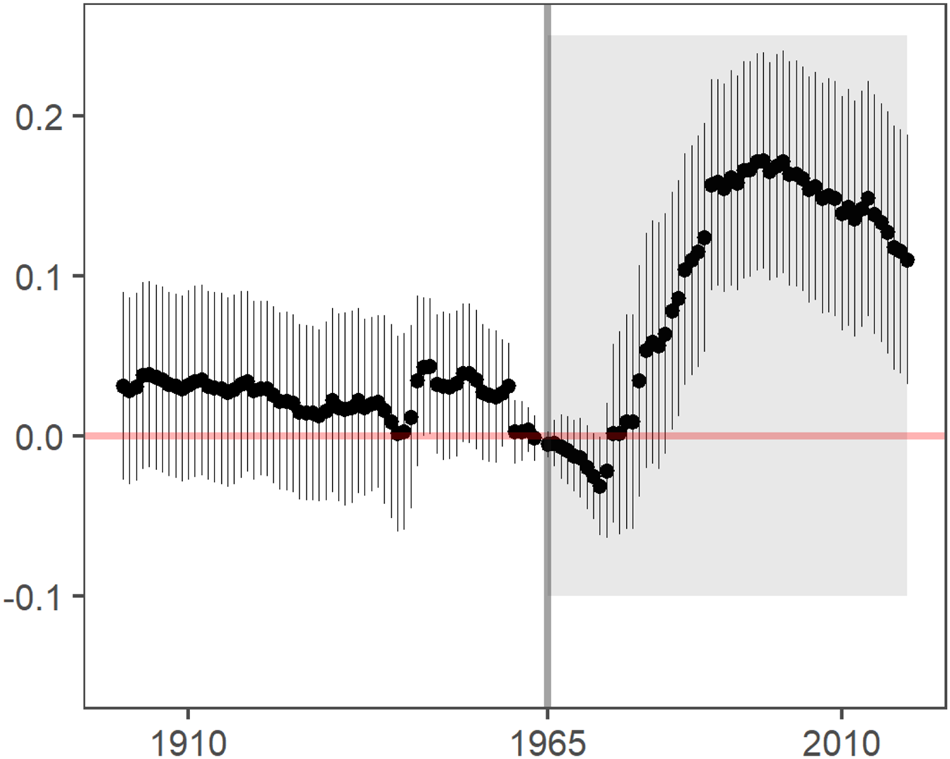
Figure 4 provides the first inferential evidence. It shows that the αj's in

are small and insignificant post shock, where Dj,t is a year-specific dummy variable that takes the value 1 in year j = t, zero otherwise. If the shock is credible, significance of the αj's post-Vatican II implies the existence of a causal link (Chernozhukov and Hansen, Reference Chernozhukov and Hansen2008).
Flexible reduced form.
Notes: The figure shows the αj's from the regression that is equation (2). The vertical line marks 1965, the year Vatican II ended.

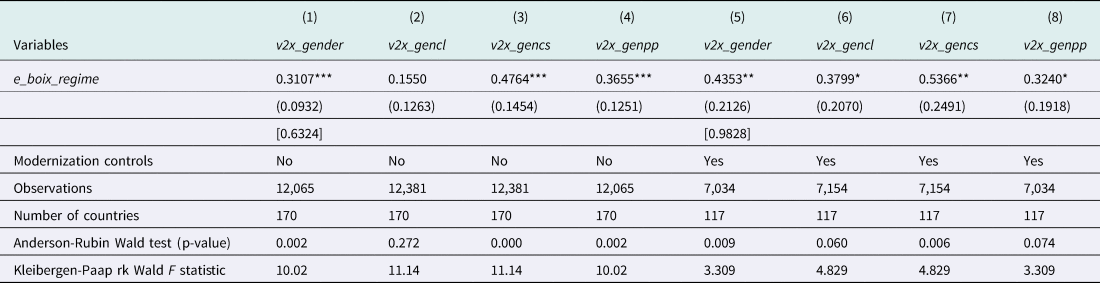
While the reduced form can establish causality if the shock is credible, it cannot identify the size of the effect. Identification requires that we perform the full instrumental variables procedure. Turning therefore to the full IV procedure, Table 2 reports the instrumental variables regressions corresponding to the fixed effects estimations in Table 1. As is clear from Table 2, the effect of democracy on women's political empowerment and its constituent parts is larger under instrumental variables estimation. In columns 1 and 5 the effect on women's political empowerment is more than twice as large under instrumental variables (Table 2) than under standard fixed effects estimation (Table 1).
Instrumental variables fixed effects regression

Notes: Country and time-fixed effects are included in all columns. Modernization controls, all lagged one year, include real GDP per capita, average years of schooling, and urbanization rate. Cluster robust standard errors in parentheses.
*** p < 0.01, ** p < 0.05, * p < 0.1. Standardized coefficients in square brackets.
According to the Kleibergen-Paap F statistic, the instrument is strong without modernization controls (columns 1–4 of Table 2) but becomes weak when they are added (columns 5–8). The Anderson-Rubin test is robust to weak identification, and it suggests that the causal impact of democracy on gender equality is always (marginally) significant, save for column 2.
Evaluating the economic significance of the instrumental variables estimate in columns 1 and 5 of Table 2 as above gives that one standard deviation increase in democracy leads to 0.63 standard deviation increase in women's political empowerment, which is an economically nontrivial effect.
Instead of using the dichotomous democracy measure, e_boix_regime, that I have relied upon so far, it may be of some interest to follow Sundström et al. (Reference Sundström, Paxton, Wang and Lindberg2017) and switch to the Polity measure, which is called e_polity2 in the V-Dem codebook.Footnote 25 Doing so (not reported) produces similar results to those obtained using e_boix_regime in in Table 2.Footnote 26
3.2 Robustness checks
3.2.1 Fertility as an alternative measure of gender equality
Women's reproductive rights have traditionally been a cause of disagreement in the Catholic world. As noted in section 2.2.2, the Catholic church has always felt strongly that the advancement of women in society should not be at the expense of women's maternal role (Madigan, Reference Madigan, Latinovic, Mannion and Welle2018). In Latin America, the church opposed reforms that challenged its position on the family and reproductive rights (Jaquette, Reference Jaquette2001). To the extent that fertility fell after Vatican II, this speaks to the empowerment of women vis-à-vis men. Moreover, some reproductive planning is a precondition for women's labor force participation, the latter being widely seen as a route to women's emancipation (Canning and Schultz, Reference Canning and Schultz2012). For these reasons, fertility is an interesting alternative measure of aspects of gender equality.
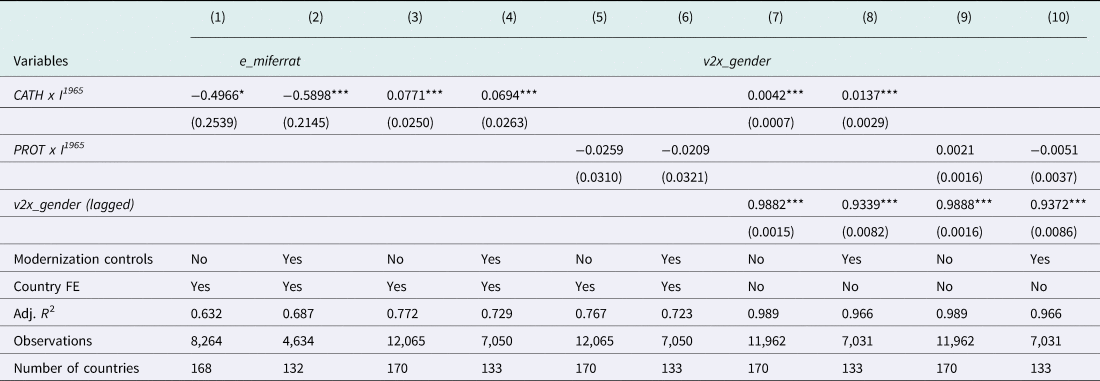
V-Dem includes fertility going back to 1960. Given my empirical design, a longer panel would have been desirable. Keeping this shortcoming in mind, columns 1 and 2 of Table 3 report regression results when fertility (e_miferrat in V-Dem) is regressed on the Vatican II instrument, time-fixed effects, and country-fixed effects; column 2 in addition includes modernization controls. In both columns, the Vatican II instrument predicts fertility: In countries with a higher share of Catholics, fertility fell in the aftermath of the Second Vatican Council. If my interpretation of the role played by fertility is correct, this finding is consistent with my overall argument.
Fertility, placebo tests, and lagged dependent variable in the reduced form

Notes: All columns include year-fixed effects. Modernization controls, all lagged one year, include real GDP per capita, average years of schooling, and urbanization rate. Cluster robust standard errors in parentheses.
*** p < 0.01, ** p < 0.05, * p < 0.1. Standardized coefficients in square brackets.
3.2.2 Placebo test
One way to do a placebo test is to construct a Protestant placebo instrument along the following lines: ${\rm PRO}{\rm T}_{\rm i} \times {\rm I}_{\rm t}^{1965}$ , where PROT is the average share of the population that is Protestant during the third wave, 1965–1995. The share of Protestants is again taken from the World Religion Dataset, documented in Maoz and Henderson (Reference Maoz and Henderson2013). There were no material changes in Protestant doctrine during the post-Vatican II period, so I expect the placebo instrument to be insignificant in the reduced form. This is indeed what I find. While the Vatican II instrument is significant (cf. columns 3–4 of Table 3), the Protestant placebo instrument is not (cf. columns 5–6 of Table 3). Moreover, the sign of the Protestant instrument is negative.
3.2.3 Specification with lagged dependent variable
Another way to check the robustness of my results is to estimate a model with a lagged dependent variable. The autoregressive model is extremely taxing, as it takes out the bulk of the variation in the dependent variable. The upside, as suggested by Wooldridge (Reference Wooldridge2013), is that by including a lagged dependent variable, I am effectively picking up all historical factors that cause current differences in the dependent variable.
Columns 7 and 8 of Table 3 report results from the autoregressive model.Footnote 27 Both with modernization controls (column 8) and without (column 7), the Vatican II instrument predicts gender equality.Footnote 28 Note also that the placebo tests in the autoregressive model (cf. columns 9–10 of Table 3) lead to the same result as the fixed effects specification (cf., columns 5–6 of Table 3). In sum, the autoregressive specification further supports my overall argument.
3.2.4 Excluding regions
Do outliers drive my results? To explore this question, I have re-estimated (not reported) column 1 of Table 2 with geographical regions excluded one by one. The regional classification I use is e_regiongeo from V-Dem, which contains the following 19 geographical regions: Western Europe, Northern Europe, Southern Europe, Eastern Europe, Northern Africa, Western Africa, Middle Africa, Eastern Africa, Southern Africa, Western Asia, Central Asia, Eastern Asia, South-Eastern Asia, Southern Asia, Oceania, North America, Central America, South America, Caribbean.
The result in column 1 of Table 2 survives the successive exclusion of all 19 regions one at a time (not reported).Footnote 29 Most noteworthy is the fact that the result is not driven by either South or Central America.
4. Causal mechanism
In this section, I complement the quantitative analysis with qualitative evidence from the democratization of South Korea. The thinking behind the case selection is simple: I focus on South Korea because it is among the most successful third-wave democratizers and because gender equality improved markedly in the aftermath of democratization. If democracy affects gender equality, I expect to be able to sketch the causal mechanism in the South Korean case.
4.1 The South Korean case
4.1.1 Catholicism in South Korea
The average share of Catholics in South Korea during the third wave was just below five percent. Nevertheless, Vatican II did impact South Korea.Footnote 30 While this is not directly relevant to the identification of a causal mechanism, it is worth briefly setting the record straight.
The Catholic church was thrust into the democratization campaign in 1974 when a cardinal was arrested for his involvement in a large-scale student uprising directed at President Park's new Yushin constitution, which among other things would allow the reelection of the president for an unlimited number of six-year terms. While in custody, the cardinal released a statement in which he condemned the constitution as a device abrogating citizens' inalienable human rights and human dignity (Yun-Shik, Reference Yun-Shik1998).
The arrest of the cardinal prompted a group of young Catholic priests to form the National Conference of Priests for the Realization of Justice. The conference declared that the Catholic church had the right and duty to protect human dignity and to defend the basic right to a decent living, which meant a withdrawal of the Yushin constitution. The Conference of Catholic Laymen Apostles, the Catholic Student Association, and the Catholic Women's Association later joined forces with the priests' conference to protest authoritarianism. The Catholic groups preached that democracy would liberate the people and was the most desirable political system for the achievement of individual freedom and social justice. Furthermore, they proclaimed fortitude in fighting for democracy until the authoritarian regime was overthrown (Yun-Shik, Reference Yun-Shik1998). The influence of the teachings of Vatican II is obvious.
4.1.2 Democracy and gender equality
The new Korean democracy quickly purged the military hierarchy, revised national security laws to limit the power of the intelligence agency, and imprisoned ex-presidents and military cronies for human rights abuses. Such righting of historical wrongs provided the impetus for women's organizations to engage with the state. The Korean Women's Association United (KWAU), an umbrella organization that unites progressive women's groups, registered with the government in 1993 to improve formal political legitimacy and get access to public funds. Local government elections also spurred women's organizations to direct their focus toward demanding full implementation of reform policies (Jones, Reference Jones2006; Lee and Chin, Reference Lee and Chin2007).
KWAU understood very well that while legislative reform is an all-important first step, effective monitoring is also important to make sure that government officials closely follow the spirit of the law. They would therefore allocate considerable time and effort to negotiate with individual government departments as these drew up implementation guidelines. KWAU would organize public hearings and, upon the completion of implementation guidelines, produce monitoring reports. They would also start fresh campaigns to push for revisions of the original law if they were dissatisfied. They would test the practical application of new legislation by filing lawsuits on behalf of female victims, be it of violence, sexual harassment, or workplace discrimination. In cases where rulings were unsatisfactory, KWAU would use these experiences to prepare proposals for legislative revisions. They would also evaluate members of the Korean National Assembly based on their performance on gender-related issues, and they would publicly release their evaluation results (Jones, Reference Jones2006; Lee and Chin, Reference Lee and Chin2007).
The new democracy's engagement with international institutions also added pressure. South Korea joined the United Nations in 1990 and the OECD in 1996. At the same time, the government began a globalization campaign meant to ensure that policy measures would meet international standards while facilitating global competitiveness. The campaign led to greater questioning of authority, increased concern for human rights, and a more favorable view of diversity. Similarly, increased global attention on issues of gender equality, especially in the context of major United Nations conferences and conventions on human rights, population issues, and women (all held in the mid-1990s), gave women's organizations greater legitimacy and best practice frameworks to succeed in their lobbying efforts. In fact, the historically low status of Korean women as well as the country's poor rankings on international gender-related indicators became an embarrassment to the government's quest for greater global legitimacy.
Activists pressured the government to carry out needed reforms by energizing the language of international forums, organizations, and treaties. The increasing popularity of the conception of ‘gender mainstreaming’ illustrates the convergence of women's movement, government, and international gendered discourses. Introduced on the world stage in the early 1990s, gender mainstreaming was endorsed during the 1995 Beijing Platform for Action (Jones, Reference Jones2006; Kim and Kim, Reference Kim and Kim2011). It was immediately adopted by Korean feminists, where it referred to the penetration of gender-sensitive policies in all social arenas.
The Korean government zealously wanted to improve its status within the international community, for which reason ministries were more than ready to learn the new international gender language. State and non-state actors thus came to speak the same language, which nourished the cause of gender equality (Jones, Reference Jones2006).
4.1.3 Sketch of mechanism
A sketch of a causal mechanism therefore runs as follows: Both the women's movement and the international community played important roles in bringing about gender equality in newly democratic South Korea. The women's movement pushed for new reforms, made sure that reforms were implemented, and proposed changes to reforms that were not working as intended. The international community offered peer pressure alongside the prospect of economic integration and international status. Successive Korean governments were therefore eager to learn the new international gender language. Activists in turn made sure that Korean leaders not only talked the gender talk on the international stage but also walked the gender walk at home. Most importantly for purposes of the present paper, it was all preconditioned on the many new political opportunities offered by democratization.
The suggested mechanism squares well with the literature. Beer (Reference Beer2009) notes that given the theoretical connection between democracy and equality, we would expect democracy and gender equality to go hand in hand. Blankenship and Kubicek (Reference Blankenship and Kubicek2018) notes that democratization is no panacea, but it should matter. Fallon (Reference Fallon2008: 76) notes the democratization process in Ghana ‘created the political opportunity needed for women to slowly take advantage of it. As the control of the authoritarian regime dissipated, women realized that they could become more active with little retribution. In addition, once funding began to be focused on good-governance programs in the mid to late 1990s, members of women's organizations were able to increase their activities, as well as their visibility. These changes allowed women to concentrate on elections as a site to engage the state in addressing women's concerns.’
5. Concluding remarks
Causal inference is notoriously difficult in observational studies, and cross-country empirical analyses are fraught with difficulties, both of which mean that my research design is open to a fair share of criticism. Yet, as I hope to have shown in the present paper, a sensible case can be made that democracy is a cause of gender equality.
Democracy is not part of the SDGs. The omission is not difficult to understand in terms of political economy. After all, the modus operandi of the United Nations is consensus, and 193 countries (many of which are autocratic) had to sign the SDGs. Yet the omission of democracy is a problem, since goals that are not on the scorecard risk being diluted (Muller, Reference Muller2019).
Consequently, a policy implication of my study is that the international community should not lose sight of democratization.Footnote 31 Studies even find that democracy has beneficial impacts on other SDGs, economic growth being perhaps the most prominent among them (Acemoglu et al., Reference Acemoglu, Naidu, Restrepo and Robinson2019). As such, the policy implication should not be controversial.
Acknowledgements
I would like to thank four anonymous referees, Lasse Aaskoven, Per Andersson, Peter Sandholt Jensen, Peter Nannestad, Martin Paldam, and participants at the 1st Danish Historical Political Economy Workshop and the 22nd Danish Public Choice Workshop for helpful comments. Remaining shortcomings are all mine.