

Introduction
Background
Since 2000, disasters caused by natural hazards in the United States have caused 4,125 deaths, affected >20 million people, and resulted in >$330 billion in damages.1 Reports the numbers of weather-related injuries and illnesses after events caused by natural hazards have increased from 1,834 in 2005 to 3,733 in 2007.2 Active post-event surveillance of affected populations provides critical information for rapid responses to minimize and prevent morbidity and mortality, allocate resources, and target public-health messaging. Traditional data sources, including pre-established, state-based, reportable disease systems, syndromic surveillance systems, and hospital electronic records, can be used during a disaster. However, in a disaster setting, supplemental active surveillance frequently is required because these traditional systems often are not timely, are easily disrupted, and, if the affected population is displaced, many will seek care outside of typical acute-care settings (e.g., in shelters, medical stations, and mobile clinics) that lack health surveillance and reporting protocols. For example, during Hurricane Katrina, the CDC established active surveillance in New Orleans medical facilities as they re-opened and in approximately 500 shelters throughout Louisiana.3,4 Recent Hurricanes Gustav and Ike displaced approximately 2 million residents into temporary shelters across several US states, including Texas, Arkansas, Mississippi, and Kentucky.5,6 Challenges arose to promptly establish disaster surveillance, especially in temporary shelters with large population densities and persons with special needs. In Kentucky following Hurricane Gustav's landfall, public health officials struggled with rapidly establishing surveillance at the Louisville Fair and Exposition Center for the influx of nearly 1,500 New Orleans residents (Personal Communication, M. Riggs, May 2009). These recent disasters highlight the need for public health authorities to prepare and build capacity to conduct rapid, post-event surveillance in their respective jurisdictions prior to an event occurring.
Predetermining what health conditions should be monitored is an important preparedness aspect of post-event surveillance. Detecting infectious disease outbreaks (e.g., gastrointestinal and respiratory illness) is crucial, especially when large numbers of displaced persons are being sheltered together. However, it is well-documented that non-infectious and chronic disease outcomes are more prevalent than epidemics of infectious etiology after events caused by natural hazards.Reference Floret, Viel and Mauny7–Reference Noji9 Surveillance data collected after Hurricane Katrina showed that 58% of all visits to healthcare facilities were for injuries and that 33% of all visits in evacuation shelters were for the treatment of chronic illnesses (e.g., diabetes, asthma, and cardiovascular diseases).3,4 A secondary analysis of data from New Orleans healthcare facilities found that of the visits for chronic disease and related conditions, 33% were cardiovascular disease, 12% were chronic respiratory disease, and 18% were for obstetrical/gynecological conditions.Reference Sharma, Weiss and Young10 In addition to non-infectious and chronic diseases, health outcomes of vulnerable populations, such as pregnant women, newborns, and those with mental health issues, should be tracked so that resources can be allocated for their acute needs during the responses.11–Reference Pfeiffer, Avery and Benbenek13 Healthcare maintenance needs, including medication refills and blood glucose levels and blood pressure checks, also should be monitored, especially in temporary housing for vulnerable populations (e.g., older adults, those with low socio-economic status, and minorities). Results from two post-Katrina surveys in the Houston Astrodome and the American Red Cross shelters in Louisiana indicated that large proportions—one-third and one-half, respectively—of the evacuees did not have their prescription medications.Reference Brodie, Weitzien and Altman14,Reference Greenough, Lappi and Hsu15
A standardized, universally used surveillance form that captures and characterizes the burden of post-event outcomes (including chronic diseases, injuries, acute illnesses, mental health, and routine treatment) is necessary to provide data for timely public health actions. During the Hurricane Katrina public health responses, multiple morbidity surveillance instruments were developed and deployed.4 This resulted in data variability (e.g., source, variables, level of detail, etc.) and made it difficult to compare and aggregate data across multiple jurisdictions. These data variability underscored the need for a standardized data collection tool. In response, in 2006 the CDC established the Disaster Surveillance Workgroup (DSWG).4 The DSWG is comprised of more than 70 members from CDC centers and agencies, including subject matter experts from the US National Center for Injury Prevention and Control, National Center for Chronic Disease Prevention and Health Promotion, National Institute for Occupational Safety and Health, Division of Reproductive Health, National Center for Preparedness, Detection and Control of Infectious Diseases, and the Coordinating Office for Terrorism Preparedness and Emergency Response (COTPER). The DSWG is a cross-organizational and multi-agency group whose goals are to improve disaster response activities, to develop and evaluate standardized disaster surveillance tools, and to make these tools available to all state and local public health departments to assure the collection of comparable data across multiple jurisdictions. To meet these objectives, the DSWG developed the Natural Disaster Morbidity Surveillance Individual Form (Morbidity Surveillance Form), a standardized form for use in active morbidity surveillance. This single-page form allows for the timely collection of data in a clinical care setting (e.g., hospital, shelter, or medical clinic) and can be completed during triage before a discharge diagnosis or an ICD-9 code is available. Capturing clinical presentations in this manner not only allows for the timely capture of data, but it also allows responders to extract additional information (such as mechanism of injury) that typically is not obtained in such traditional methods as discharge diagnoses or ICD-9 codes. This tool has been designed to supplement or replace impaired or non-existent surveillance systems during a post-disaster event and captures the most common individual clinical presentations seen during disasters.
This study evaluated the Morbidity Surveillance Form by comparing clinical presentations it captured from electronic medical records with its use in the emergency department's (ED) working discharge diagnoses. This evaluation would ensure that the clinical presentations on the Morbidity Surveillance Form at a minimum would reflect the ED's working discharge diagnoses.
Methods
The study assessed the agreement between the data collected using the DSWG's Morbidity Surveillance Form and the working ED discharge diagnoses (the diagnosis given to the patient upon discharge from the hospital, but not necessarily the final billed discharge diagnosis or ICD-9 classification code). The working ED discharge diagnosis was used in order to provide timely surveillance as final discharge diagnosis was not available at the time of data collection (and would not be available during a disaster). The Institutional Review Board at the CDC reviewed this study and found it to be exempt. The CDC and the Georgia Division of Public Health (GDPH) piloted the Natural Disaster Morbidity Report Form in a 186-bed community hospital during a non-disaster setting from 01 August, 2007 through 07 August 2007. Prior to data collection, 26 GDPH public health nurses (PHN) received eight-hours of training that focused on data collection methodology and the specific data elements on the Form. For seven days, a trained PHN completed one Morbidity Surveillance Form for each ED patient visit at the participating hospital. To complete the Morbidity Surveillance Form, the PHN shadowed the ED triage nurse during the patient triage interview and entered data directly onto the Form, contemporaneously. Because there were multiple entry points in the ED and only one PHN capturing information, patients were missed if they required emergent care, were admitted directly to the hospital, or were treated during the night shift, which was not staffed by a PHN for this study. To account for the missed patients, the hospital provided the staff with a daily ED census log of all patients seen during the previous 24 hours. This census log included patient demographic information, chief complaint data, and date and time of visit. Patient data not captured by the PHN were abstracted from the ED census log and entered onto a Morbidity Surveillance Form. At the end of each shift, data from each form were manually entered into a secure database.
The Morbidity Surveillance Form is a single-page form divided into five parts: (I) visit information; (II) patient information/demographics; (III) clinical presentation; (IV) worker or volunteer status information; and (V) disposition. This study used only information collected in Parts I and III. Part I, visit information, includes the hospital location and date and time of the ED visit. Part III captures clinical presentation from a list of 48 variables (in check box format) to describe the patient's reason for seeking treatment. Variables listed on the Form included broad terms (i.e., acute and chronic illnesses, injuries, etc.) and more specific or descriptive attributes of the visit. Multiple variables can be selected to describe the patient's presentation. For example, the variables “injury” and “fall” would be checked if a patient presented with injuries resulting from a fall from a roof. If the patient's clinical presentation did not meet at least one of the listed variables, it was recorded as “other” and an open text field was available for further description.
To evaluate the Morbidity Surveillance Form, this study compared the multiple variables selected on the Form with the working ED discharge diagnoses. The GDPH provided the working ED discharge diagnoses from electronic medical records for the seven days of the study. Because personal identifiers were not collected on the Morbidity Surveillance Form, the electronic data were linked to each Form using age, sex, race, zip code, and date and time of visit.
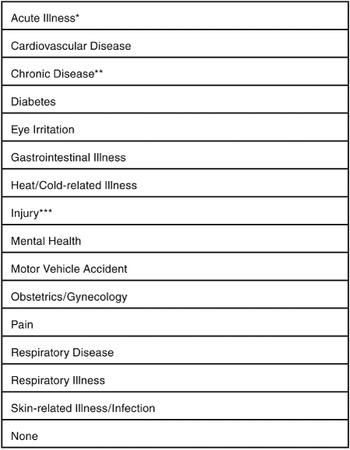
To simplify analysis, working ED discharge diagnoses from the medical records were grouped into 15 major clinical categories (Table 1). These clinical categories represent the most commonly treated conditions during a disaster due to natural hazards.3,4,Reference Noji16 Limiting the number of categories enabled a reasonable number of comparisons between the ED discharge diagnoses and the variables listed on the Morbidity Surveillance Form. Two epidemiologists involved in implementing the study but were blinded to the variables captured on the Morbidity Surveillance Form independently categorized the abstracted ED discharge diagnosis into one of the 15 categories or “none.” A medical doctor served as a “tie-breaker” for the 77 situations (9.2%) in which the two epidemiologists disagreed.
Major clinical categories used to categorize the electronic emergency department (ED) working discharge diagnosis of each patient presenting to a community hospital in Georgia, 01 August 2007–07 August 2007

*any acute illness, excluding eye irritation, gastrointestinal illness, heat-related illness, pain, respiratory illness, and skin-related illness/infection
**any chronic disease, excluding cardiovascular disease, diabetes, and respiratory disease
***any injury, excluding injuries due to motor vehicle accidents
To assess agreement, each Morbidity Surveillance Form was reviewed to determine if at least one of the variables agreed with the clinical category based on the working ED discharge diagnosis. A binary variable was created to indicate whether the data provided on the form agreed or disagreed with the clinical categories.
This study used SAS 9.1 (SAS Institute, Inc., 2008) statistical software to conduct data analysis. Chi-square tests were performed to determine if there was a statistically significant difference between the data captured by the PHNs and the data from the ED census log. The frequencies and percent of agreement between variables selected on the Morbidity Surveillance Form and the clinical categories were calculated. The assigned statistical significance level was p <0.05. Kappa statistics were calculated, and used as an index to compare the agreement against what might be expected by chance. Kappa values range from 1 (perfect agreement) to 0 (no agreement above what is expected by chance). For this study, the Kappa values were interpreted as “poor” (<0.20), “fair” (0.21, 0.40), “moderate” (0.41, 0.60), “good” (0.61, 0.80), and “very good” (0.81, 1.00) based on Altman's Kappa categories.Reference Altman17
Results
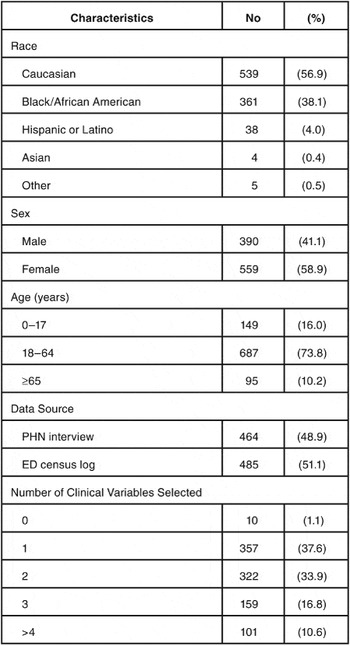
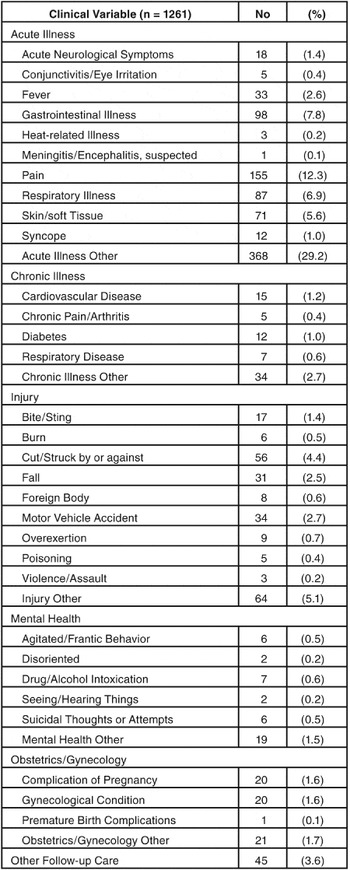
During the seven-day surveillance period, 949 patients sought care at the hospital's ED, an average of 136 patient visits per day. The Morbidity Surveillance Form was completed for every patient who visited the ED during the surveillance period, with data either from patient triage interviews (49%) or from data abstracted from the ED census logs (51%) (Table 2). Fifty seven percent (n = 539) of the patients seen were Caucasian and 41% (n = 390) were male (Table 2). The mean value for the ages was 36 years (range 0–91 years). The number of variables selected per Morbidity Surveillance Form ranged from 0 to 7 (Table 2). A total of 1,261 variables were selected for all 949 patients. The most common reasons for seeking treatment were other acute illness (29%), pain (12%), and gastrointestinal illness (8%) (Table 3). The combined “other” category (acute illness other, chronic illness other, injury other, mental health other, obstetrics/gynecology other, and other follow-up care) accounted for 551 (44%) of the total reasons for seeking treatment.
Description of patient characteristics seen 01 August 2007–07 August 2007 (n = 949) (ED = emergency department; PHN = public health nurse)

Frequency and percentage of times variables were selected on the Morbidity Surveillance Form during the study, 01 August 2007–07 August 2007

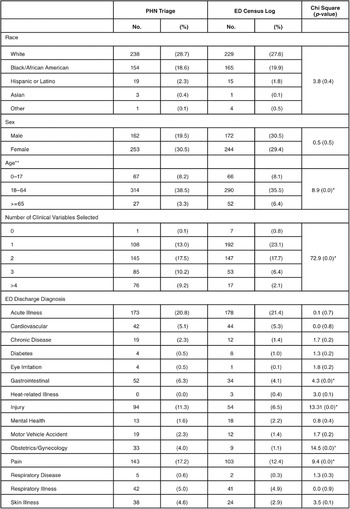
The chi square results showed no statistically significant difference between the data recorded directly from patients by the PHNs and the data recorded from the ED census log for race or sex (p-values 0.40 and 0.62, respectively) or for 11 of the 15 clinical categories (Table 4). However, there was a statistically significant difference between data captured by the PHNs and the data from the ED census log for age, for the number of variables captured on the Morbidity Surveillance Form, and for 4 of the 15 clinical categories (pain, injury, gastrointestinal illnesses, and OB/GYN) (Table 4).
Agreement between data captured on the Morbidity Surveillance Form by public health nurse versus emergency department census log, 01 August 2007–07 August 2007

*The following clinical variables had zero reporting: drowning/submersion, electrocution, undetermined injury, cold-related illness, jaundice, cerebrovascular disease/stroke, unable to care for self, violent behavior, routine pregnancy check-up, and in labor.
* significant at p <0.05
**mean age for the PHN was 34 years and for ED Census log was 38 years (t-test p-value of 0.0)
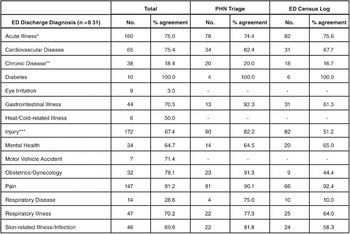
The GDPH matched 831 (88%) of the electronic records to the Morbidity Surveillance Form. Twenty-two percent could not be matched due to records that were incomplete or that lacked a unique identifier. On the basis of the electronic ED records, the most common clinical categories recorded were injury (21%), acute illness (19%), and pain (18%) (Table 5).
Frequency and percent agreement between variables on the Morbidity Surveillance Form and clinical categories, 01 August 2007–07 August 2007

*any acute illness, excluding eye irritation, gastrointestinal illness, heat-related illness, pain, respiratory illness, and skin-related illness
**any chronic disease, excluding cardiovascular disease, diabetes, and respiratory disease
***any injury, excluding injuries due to motor vehicle accidents
The frequency of agreement between the clinical categories and the Morbidity Surveillance Form ranged from 3% to 100% (Table 5). Most categories had agreement above 70%, with the highest being diabetes (100%), pain (91%), and obstetrics/gynecology (78%), and the lowest being eye irritation (3%), chronic disease (18%), and respiratory diseases (29%).
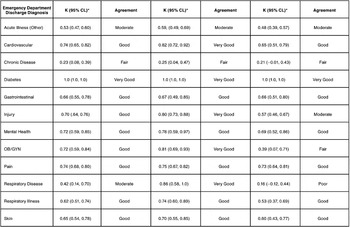
Kappa statistics were conducted on 12 of the 15 clinical categories. Three of the 15 clinical categories were excluded from data analysis because of the small cell size (<10): motor vehicle accident, eye irritation, and heat-related illness (Table 5). Kappa values ranged from 0.23 through 1.0, with 9 of the 12 categories having very good or good agreement (Table 6). Chronic disease, chronic respiratory disease, and acute illness had fair to moderate agreement. The data collected by the PHNs during the triage process had 9 of the 12 clinical categories with very good or good agreement (good = 0.61–0.8; very good = 0.81–1.0), whereas data abstracted from the ED census log had only 6 of the 12 clinical categories with very good or good agreement (Table 6).
Kappa agreement in categorization between clinical categories and the Morbidity Surveillance Form, 01 August 2007– 07 August 2007

* Kappa value interpretation: Poor (<0.20), Fair (0.21, 0.40), Moderate (0.41, 0.60), Good (0.61, 0.80), Very Good (0.81, 1.00)
**any acute illness, excluding eye irritation, gastrointestinal illness, heat-related illness, pain, respiratory illness, and skin-related illness
***any chronic disease, excluding cardiovascular disease, diabetes, and respiratory disease
****any injury, excluding injuries due to motor vehicle accident.
Discussion
The purpose of this study was to evaluate the DSWG's Morbidity Surveillance Form to determine if it accurately captured patients' clinical presentations during patient triage in the ED. Although the ideal circumstance would be to capture ED discharge diagnosis to characterize morbidity, this information is not timely, and therefore, not as useful during disaster surveillance. As a proxy, this study accurately collected health information during patient triage. This approach provides not only timely data collection, but it also captures additional information (i.e., mechanism of injury) not traditionally included with discharge diagnoses.
The Morbidity Surveillance Form successfully captured most of the clinical categories (9 of 12). However, it was moderate or fair at capturing some acute illness and chronic disease categories, indicating that these variables needed to be revised on the Morbidity Surveillance Form. Several factors may explain the poor agreement. The lower agreement could be attributable to the variables on the Morbidity Surveillance Form being too broad to optimally identify and capture the true diagnosis. For example, “pain” is a variable on the Morbidity Surveillance Form that might represent abdominal, chest, or muscle pain. Because the variable is broad and not descriptive, it was difficult to assess if “pain” on the Morbidity Surveillance Form agreed with the discharge diagnosis of “angina.” “Other” was selected for almost half of patients. Currently, the Morbidity Surveillance Form lists “other” six times. This would result in the loss of critical information during a disaster event due to its lack of specificity, and it would require intense resources to manually recode any data written in this open-ended text field.
When the level of agreement between clinical categories and the Morbidity Surveillance Form was calculated, the agreement was greater for all Morbidity Surveillance Forms completed via PHN interview than for data abstracted from the ED census log (ED chief complaint). The mechanism of data collection and the source from which the data were obtained affected the resulting information. This finding implies that contemporaneous observation and recording is more accurate than data abstraction from census logs. Retrospectively collected data are more difficult to interpret as it is less detailed and without the benefit of an interview. This is apparent as more variables were selected for PHN-completed Morbidity Surveillance Forms than for those based on the ED census log. This finding suggests that conducting interview-based surveillance during a disaster would be beneficial if resources (such as staff) are available. However, the ED census log provided good to very good agreement in most categories, demonstrating its value as a data source for post-event surveillance.
This study has some limitations. The Morbidity Surveillance Form is geared toward capturing data in shelters and other non-traditional settings; however, this study was conducted in a traditional setting during a non-disaster situation. Such a setting restricted the ability to evaluate the Morbidity Surveillance Form for specific disaster-related injuries and illnesses (e.g., carbon monoxide poisoning) and its usefulness within the stressful environment of an actual disaster event.
This study had to limit the hundreds of potential ED discharge diagnoses from the electronic medical records to 15 major clinical categories. Therefore, this simplification resulted in broader categories and potentially increased the opportunity for agreement. Unlike electronic medical records, the Morbidity Surveillance Form can capture more than just the chief complaint (i.e., the main symptom or reason for patients seeking medical treatment). During a disaster, all presenting symptoms may be important in the recognition of outbreaks or in decisions about allocation of resources.
Finally, the Morbidity Surveillance Form does not capture every type of clinical presentation (e.g., seasonal allergies), whereas a discharge diagnosis would reflect every clinical presentation seen in the ED. For example, if a patient presented with seasonal allergies, such allergies had to be generally categorized as acute illnesses, a categorization that may have led to lower agreement than would be found with the clinical categories. However, the Morbidity Surveillance Form was designed to characterize morbidity related to disasters caused by natural hazards; characterizing non-disaster clinical presentations is not an objective of the Form.
The study found that the Morbidity Surveillance Form easily can be used to capture data that could be used to assist in resource allocation after a disaster causing event. For example, if in a 24-hour period, the Morbidity Surveillance Form captured numerous gastrointestinal illnesses, such data could indicate a potential outbreak that requires investigation. Additionally, if the Morbidity Surveillance Form captured an increase in the number of patients with diabetes or in those needing blood sugar checks, more medical supplies, such as insulin or blood sugar check test strips, should be distributed.
Conclusion
The Morbidity Surveillance Form is a modifiable, ready-to-go tool that can be used at the time of a disaster to obtain accurate and timely health surveillance data with minimal resources. The Form is in a single-page, check-off box format that is easy to complete and collate—a critical characteristic during disaster responses. Having an existing standardized disaster morbidity surveillance form can assist public health authorities in collecting accurate data, and can improve the timeliness of data analysis during disaster responses. The study results showed that several of the variables on the Morbidity Surveillance Form needed to be modified. Improvements have been made by eliminating the “other” subcategories to decrease this broad label's use as a “catch-all” phrase. In addition to this change, key revisions included the replacement of the “pain” clinical variable with several descriptive ones (i.e., abdominal pain, musculoskeletal pain, and cardiac emergency/chest pain) and the addition of “immunocompromised” to the list of chronic diseases. In the future, the use of a validated, standardized disaster surveillance tool will permit federal, state, and local public health agencies to coordinate the collection and analysis of morbidity data following a disaster caused by natural hazards, allowing for cross-jurisdiction comparison and the timely prevention of additional disaster-related illnesses and injuries. The revised CDC Morbidity Surveillance Form and a companion ACCESS database are available at http://www.emergency.cdc.gov/disasters/surveillance
Abbreviations:
CDC = US Centers for Disease Control and Prevention
DSWG = Disaster Surveillance Workgroup
ED = emergency department
GDPH = Georgia Department of Public Health
PHN = public health nurse