



1 Introduction
Extreme response statistics for wave energy converters are key in determining the possibility of the survival of the device under extreme sea conditions. Previous studies have looked at the effects of extreme responses on the mooring lines, but few studies have been concerned with the extreme response of the device itself, e.g. see Parmeggiani, Kofoed & Friis-Madsen (Reference Parmeggiani, Kofoed and Friis-Madsen2011), Muliawan, Gao & Moan (Reference Muliawan, Gao and Moan2013a ), Muliawan et al. (Reference Muliawan, Karimirad, Gao and Moan2013b ), Ambühl, Sterndorff & Sørensen (Reference Ambühl, Sterndorff and Sørensen2014).
Previous work on the M4 wave energy converter has looked at the design and performance of the M4 machine in laboratory-scale experiments (Stansby, Carpintero Moreno & Stallard Reference Stansby, Carpintero Moreno and Stallard2015a ; Stansby et al. Reference Stansby, Carpintero Moreno, Stallard and Maggi2015b ), and hydrodynamic–structural modelling with the power take-off modelled as a linear damper (Eatock Taylor, Taylor & Stansby Reference Eatock Taylor, Taylor and Stansby2016; Sun et al. Reference Sun, Stansby, Zang, Carpintero Moreno and Taylor2016a ,Reference Sun, Zang, Stansby, Carpintero Moreno, Taylor and Eatock Taylor b ). Using high quality NORA10 wave hindcast data, previous work has also looked at the decadal variability of practical mean wave power produced by the M4 machine at locations in the North East Atlantic and North Sea, together with correlation with the North Atlantic Oscillation (NAO) and other atmospheric modes (Santo et al. Reference Santo, Taylor, Eatock Taylor and Stansby2016a ). Analysis on the wave climate alone also using the NORA10 wave hindcast data has also been conducted to assess the decadal variability of the ocean wave power resource (Santo et al. Reference Santo, Taylor, Woollings and Poulson2015) and the 1 in 100 year extreme wave heights (Santo, Taylor & Gibson Reference Santo, Taylor and Gibson2016b ), as well as their correlations to the NAO and other atmospheric modes.
The aim of this paper is to present a study of extreme response behaviour of the M4 wave energy converter, which is a particular example of a class of interconnected cylindrical floats. The focus is on the extreme responses, rather than power generated, hence only the cases without power take-off are considered, assuming the M4 machine power take-off is not operating under survivability (or extreme) conditions. We first describe experiments using focussed wave groups on a scaled M4 model in a wave tank. Focussed wave groups are used as a model for the average shape of extreme waves in a given sea state, since regular waves are not representative of an extreme wave, and random wave testing is time consuming and the results are to some extent contaminated with wave reflections. We demonstrate that the device response is close to linear in hinge angle, with weak nonlinearity appearing in the bending moment in one of the beams in the machine. Thus, subsequent linear analysis on extreme response is justified.
From the experimental results we obtain the machine response amplitude operator (RAO), which we combine with the numerically estimated RAO from the linear wave-diffraction code DIFFRACT. We perform NewWave-type response statistics calculations to obtain the most probable extreme response of the machine in any sea state (Tromans, Anaturk & Hagemeijer Reference Tromans, Anaturk and Hagemeijer1991; Jonathan & Taylor Reference Jonathan and Taylor1997). At field scale, the machine is sized to the mean wave period of 8.44 s. This gives a total machine length of 94 m on the assumed water depth of 60 m. We then conduct extreme response statistics based on 54 years using the same NORA10 wave hindcast data from 1958–2011, which are available for every 3 h sea state, at a point to the west of the Orkney Islands to the north of Scotland.
The effects of nonlinearity due to large motions are discussed. Three types of nonlinear behaviour are extracted in the analysis: Stokes-type double and triple frequency motion during the free-vibration phase of the response, double and triple frequency components as the wave group passes by (due to nonlinear hydrodynamic loading) and finally ‘dunking’ of the central float for very large motions, which provides a strong reduction of the largest motions. We note that even though the focus is on the M4 machine, the methodology presented in this paper is potentially relevant to other wave energy converters and indeed the class of floating offshore structures comprising interconnected cylindrical bodies.
2 Experimental data and analysis
Experiments on focussed wave groups were conducted in the COAST (coastal, ocean and sediment transport) laboratory of Plymouth University. The wave tank is 35 m long and 15.5 m wide. It has an adjustable basin floor, which was set at 1 m water depth for the experiments reported here. We did not explore the effect of water depth on the extreme motions, all the experiments and analyses were conducted for the machine floating on this 1 m depth (and this is Froude scaled up to 60 m water depth for the installation of the M4 west of the Orkney Islands as discussed in § 4). The wave paddle array is a set of the Edinburgh Designs Ltd (EDL) bottom hinged paddles, and linear wave generation was used. The far end of the wave tank is equipped with a convex beach to minimise reflected wave energy. The layout (side view) of the experimental set-up together with the M4 machine is shown in figure 1. The M4 machine is a three-float system, each float with a circular cross-section when viewed from above. Floats 1 and 2 are rigidly connected, and the larger float 3 is connected to the mid float by an articulated joint (or hinge, where the beam from float 3 is joined to float 2). The machine generates power through the relative angular motion of this articulated joint between these two floats. The M4 machine is connected to a mooring line through a floating buoy to prevent the model from drifting.
(a) Shows the layout (side view) of the experimental set-up with the laboratory-scale M4 model (not to scale). (b) Shows the dimensions (in m) of the M4 model. Note the power take off is shown above the beam while this would be connected to the deck on a prototype. For the present tests in extreme conditions it is disconnected.

A wave group is made to focus when a set of Fourier components are aligned in phase at a single position in space and time (constructive interference). A fetch-limited JONSWAP (Joint North Sea Wave Observation Project) spectrum with
 $\unicode[STIX]{x1D6FE}=3.3$
for the peak enhancement factor was used, with the input spectrum truncated at 2 Hz. Two sets of wave groups were considered: linear crest amplitude at focus (
 $A_{c}$
) of 0.0245 and 0.08 m. For each
 $A_{c}$
, there are six different peak spectral periods (
 $T_{p}$
) of 0.8, 1.0, 1.1, 1.2, 1.4 and 1.6 s.
 $T_{p}$
of 1.2 s is taken as the base case for each
 $A_{c}$
, as the M4 machine responded most vigorously close to this peak period. For each test, several parameters were measured in time: hinge angle response (deg.), positions of the hinge and top of the float 3 (processed using a Qualysis motion tracking system, the small white reflectors are visible in figure 3), surface elevations at two wave probes upstream of the M4 machine, bending moment at a point in the beam close to float 2 and mooring force. The sampling frequency for surface elevation is 128 Hz, while for the other signals 200 Hz. The duration of each test is approximately 120 s.
2.1 Measured response in hinge angle and bending moment
Examples of the measured data are presented in figure 2 for two wave amplitudes both with
 $T_{p}=1.2$
s. The figure shows the surface elevation obtained from probe 1 upstream of the M4 machine, the hinge angle response (deg.), and the bending moment between floats 1 and 2, as shown in figure 1. From the plots of the surface elevation time history, it is clear that the dispersive wave group will evolve in time and space over the period 70–80 s before reaching the model. On the basis of linear wave theory, the wave group should focus at the location of the model (assumed to be at the centre of float 2, which is 3.8 m downstream of probe 1), with the resultant temporal shape symmetric in time around the largest peak crest (not shown). Between 85 and 95 s at the upstream wave probe, one can see (linear) scattered waves from the buoy and the model, both interacting with the (second-order double frequency) error waves from the paddle which arrived later after the main dispersive wave group has gone. From the hinge angle response time history, one can see a fast build up of the response as the wave group hits the model, with the period of the response governed by the dominant wave excitation period. After the wave group has passed through the model, the model underwent prolonged free vibration at an oscillation period governed by the machine resonance (
 ${\sim}1.2$
s). Similar behaviour is observed for the bending moment time history. Qualitatively, the temporal shape of the response in hinge angle is very close to symmetric about zero, suggesting that the hinge angle response is predominantly linear. The temporal shape of the bending moment is however slightly more asymmetric about zero, hence more nonlinear.
Examples of the measured data for
 $A_{c}=0.0245$
m (a,c,e) and 0.08 m (b,d,f), all for
 $T_{p}=1.2$
s. (a,b) Shows the surface elevation time history from probe 1 upstream of the M4 machine, see figure 1. (c,d) Shows the hinge angle response time history. (e,f) Shows the bending moment time history between float 1 and 2, see figure 1.

A more detailed localised behaviour is presented in figure 3 which shows series of snapshots of the M4 machine for the large amplitude wave group of
 $A_{c}=0.08$
m and
 $T_{p}=1.2$
s. See also the supplementary movie available online at https://doi.org/10.1017/jfm.2016.872. Figure 3(a) shows the instant when float 1 and (red) buoy were being submerged or ‘dunked’ as the wave group arrived, the direction of wave motion is from left to right. Figure 3(b) shows the instant when float 2 was being dunked as the largest crest in the wave group arrived at the focus location. Figure 3(c) shows the instant of the maximum hinge angle response, here with almost self-collision between the centre float and the freely pivoting beam, during the free vibration as the wave group passed through the model. At this instant, floats 1 and 3 were almost dunked and the (red) buoy was completely submerged below the water surface, demonstrating violent conditions for the M4 machine during a representation of an extreme event. Throughout some of the large wave group events, there were complicated localised events of floats being dunked and layers of green water on top of the floats and beams connecting the floats, which altogether have the effect of reducing the machine response. Remarkably, the measured hinge angle response is nevertheless predominantly linear. For the lower amplitude wave group of
 $A_{c}=0.0245$
m, the top of all three floats remained dry throughout the event.
Series of snapshots of the M4 machine for the focussed wave group of
 $A_{c}=0.08$
m and
 $T_{p}=1.2$
s. (a) Shows float 1 and (red) buoy being dunked as the wave group was arriving. (b) Shows float 2 being dunked when the wave group was focussed in space and time. (c) Shows the maximum hinge angle (almost self-collision) during free vibration as the wave group passed through the model, where floats 1 and 3 were almost dunked and (red) buoy completely submerged from the water surface. The two vertical bars at the left side of each panel are the upstream wave probes. The wave group travels from left to right. See also the supplementary movie.

All cases were tested with a wave group focussed at the location of the M4 machine, so crest focussed. Frequency filtering is used to separate the harmonics contribution, which works reasonably well because both the surface elevation and response spectra are sufficiently narrow banded, see figure 4. The harmonic decomposition of each measured time history is also presented in the same figure. Qualitatively, the structure of the signals for the surface elevation and hinge angle is dominated by the linear component, and as observed earlier, the structure for the bending moment contains slightly more nonlinearity.
(a,c,e) Power spectra of the surface elevation (a), hinge angle (c) and bending moment (e) for
 $A_{c}=0.08$
m and
 $T_{p}=1.2$
s. (b,d,f) Harmonic structure of the surface elevation (b), hinge angle (d) and bending moment (f) for the same case. The linear components are in grey, double frequency components in blue, difference components in black and triple frequency components in green. The total signal for each is shown in figure 2.

Here the observed nonlinear effects are investigated further. If the motion nonlinearity is simply scaled according to Stokes perturbation theory, the nonlinear higher-order harmonics components simply scale with, and are bound to, the linear component. If however the effect of local nonlinear effects such as quadratic viscous damping is significant, any contribution from this Morison-type drag term would produce linear and triple frequency components, i.e.
 $v^{2}\cos \unicode[STIX]{x1D6F7}|\text{cos}\unicode[STIX]{x1D6F7}|\sim (8/3\unicode[STIX]{x03C0})v^{2}(\cos \unicode[STIX]{x1D6F7}+1/5\cos 3\unicode[STIX]{x1D6F7})$
, as well as the simpler nonlinear contributions following the mathematical structure of Stokes perturbation theory for nonlinear potential flow. It will be shown that there is no observed significant contribution from such a Morison drag term.
For a narrow-banded process, it should be possible to approximate the double frequency and triple frequency contributions in terms of the linear component, see for example Walker, Taylor & Eatock Taylor (Reference Walker, Taylor and Eatock Taylor2005). For a given linear signal
 $\unicode[STIX]{x1D702}_{L}=a(t)\cos \unicode[STIX]{x1D6F7}(t)$
where
 $a(t)$
is the slowly varying amplitude of the signal in time and
 $\unicode[STIX]{x1D6F7}(t)$
is the phase of the signal, the Hilbert transform of the linear record (which introduces a
 $\unicode[STIX]{x03C0}/2$
phase shift into the signal) can be written as
 $\unicode[STIX]{x1D702}_{LH}=a(t)\sin \unicode[STIX]{x1D6F7}(t)$
. Thus, the double frequency contribution can be approximated in terms of the combination of the linear contribution and its Hilbert transform, with appropriate vertical scaling, as:
 $$\begin{eqnarray}\displaystyle \unicode[STIX]{x1D702}_{2}=a^{2}\cos 2\unicode[STIX]{x1D6F7}=\unicode[STIX]{x1D702}_{L}^{2}-\unicode[STIX]{x1D702}_{LH}^{2}, & & \displaystyle\end{eqnarray}$$
the second-order difference term may be approximated as:
 $$\begin{eqnarray}\displaystyle \unicode[STIX]{x1D702}_{2-}=\unicode[STIX]{x1D702}_{L}^{2}+\unicode[STIX]{x1D702}_{LH}^{2}, & & \displaystyle\end{eqnarray}$$
and the triple frequency contribution as:
 $$\begin{eqnarray}\displaystyle \unicode[STIX]{x1D702}_{3}=a^{3}\cos 3\unicode[STIX]{x1D6F7}=\unicode[STIX]{x1D702}_{L}(\unicode[STIX]{x1D702}_{L}^{2}-3\unicode[STIX]{x1D702}_{LH}^{2}). & & \displaystyle\end{eqnarray}$$
Comparison of the higher harmonic signals (thick grey line) and the fit using linear signal approximations (thin red line) for
 $A_{c}=0.0245$
m (a,c,e) and 0.08 m (b,d,f), all for
 $T_{p}=1.2$
s. (a,b) Shows shape comparison in terms of double frequency component of hinge angle. (c,d), (e,f) Show shape comparison in terms of double and triple frequency component of bending moment.

Thus, to investigate whether Stokes scaling is valid or whether there is viscous damping in the measured responses, we fit
 $\unicode[STIX]{x1D702}_{2}$
,
 $\unicode[STIX]{x1D702}_{2-}$
and
 $\unicode[STIX]{x1D702}_{3}$
to the double frequency, second-order difference and triple frequency contributions to the hinge angle and bending moment signals. The fit of
 $\unicode[STIX]{x1D702}_{2}$
and
 $\unicode[STIX]{x1D702}_{3}$
are shown in figure 5 for both
 $A_{c}$
values and
 $T_{p}=1.2$
s. The fits are performed for the portion of the response signals after the wave group has passed by, i.e. from 80 s. As might be expected, the fit to the hinge angle is good for the double frequency component, however, the triple frequency signal is more complex as the wave group passes by and of much smaller magnitude compared to the linear component, hence the fit is not shown. The fit to the bending moment is reasonable for the double frequency component, with some mismatch before 80 s, or before the main wave group arrives. For the fit at triple frequency component, the mismatch is more pronounced before 80 s, and the fit is then subsequently better. The mismatch before 80 s could be due to quadratic viscous damping at triple frequency component, and/or the fact that bending moment is a result of double differentiation in time of a displacement, which amplifies high frequency nonlinear contributions from noise. Hence, in general the harmonic structure of the bending moment is more complex than that of the hinge angle.
From 80 s onwards, the synthetic double and triple frequency components, derived from the linear signal, fit the measured signals well, both in terms of phase and also the decay of the amplitude of free vibration over time. It is also important that this decay is a simple exponential in time, and has the same rate for all groups, large and small, and with various peak wave periods; it corresponds almost exactly to simple linear damped free vibration of the M4 machine in otherwise still water, and double that decay rate for the second-order double frequency component, and triple that for the third-order triple frequency component. We obtain as a third-order harmonic approximate fit:
 $$\begin{eqnarray}\displaystyle & \displaystyle \unicode[STIX]{x1D719}=\unicode[STIX]{x1D719}_{L}+0.00215(\unicode[STIX]{x1D719}_{L}^{2}-\unicode[STIX]{x1D719}_{LH}^{2})+({\sim}10^{-5})\unicode[STIX]{x1D719}_{L}(\unicode[STIX]{x1D719}_{L}^{2}-3\unicode[STIX]{x1D719}_{LH}^{2}), & \displaystyle\end{eqnarray}$$
 $$\begin{eqnarray}\displaystyle & \displaystyle BM=BM_{L}+\frac{0.0165}{\unicode[STIX]{x1D70C}gL^{4}}(BM_{L}^{2}-BM_{LH}^{2})+\frac{0.0004}{(\unicode[STIX]{x1D70C}gL^{4})^{2}}BM_{L}(BM_{L}^{2}-3BM_{LH}^{2}), & \displaystyle\end{eqnarray}$$
for all wave groups and for times
 ${>}80$
s, where
 $\unicode[STIX]{x1D70C}$
is the water density and
 $L$
is the beam length (0.8 m). This approximation to the hinge motion (
 $\unicode[STIX]{x1D719}$
in deg.) and bending moment (
 $BM$
) fits well. It should be noted that there is a phase shift (
 ${\sim}2.5$
rad, but not shown above) required to fit the triple frequency component of the bending moment, while no phase shift is required to fit the double frequency component of the bending moment, and the double and triple frequency components of the hinge angle. The low frequency second-order difference contribution to the angle is significant, but that to the bending moment is relatively smaller. Presumably the slow machine motion does not significantly contribute to the internal forces within the machine.
(a,b) Power spectra of the total signals in terms of hinge angle (a) and bending moment (b), all shown in thick red lines. The thin lines correspond to the spectra of the fitted Stokes-like harmonics shown previously in figure 5 and with the same colour coding as figure 4. The difference in the spectral shape for each harmonics corresponds to the non-Stokes-like contributions in frequency, this is plotted in (c–e) in time. (c–e) The difference in the higher harmonic signals and the fit using linear signal approximations. (c) Shows the difference in double frequency component of hinge angle. (d), (e) Show the difference in double and triple frequency component of bending moment. All plots are for
 $A_{c}=0.08$
m and
 $T_{p}=1.2$
s.

Figure 6(a,b) presents the same power spectra of the total signals (thick red lines) for the large amplitude wave group in terms of hinge angle (a) and bending moment (b), with additional thin lines which correspond to the spectra of the fitted Stokes-like harmonics shown previously in figure 5 and with the same colour coding as figure 4. For the hinge angle, much of the second-order difference and double frequency terms are well captured. However, there is a significant contribution in the range 2–
 $4~\text{rad}~\text{s}^{-1}$
and broadening of the double frequency term around its local peak; both are presumably due to nonlinear effects in the fluid loading and subsequent response. For the bending moment, the local peak in the double frequency term is well represented, but the effect of broadening around its peak is more pronounced, and the approximation does not capture much of the second-order difference and triple frequency terms. The difference in the spectral shape for each harmonic corresponds to the non-Stokes-like contributions in frequency, this is plotted in figure 6(c–e) in time. We see that these differences are small after 80 s where the Stokes-like harmonics fit well to the slowly decaying tails of the harmonics of the measured signals. These differences are only important as the wave group passes by, so as direct wave excitation occurs. Thus, these are directly related to nonlinear contributions to the hydrodynamic loading of the M4 machine.
The reasonably good agreement using the approximation based on the linear component and its Hilbert transform to the higher-order harmonics demonstrates that much of the nonlinearity observed in the measured data is of Stokes perturbation-type (simply bound to the linear component). Arguably, there is more nonlinearity observed for the higher
 $A_{c}$
case, which is not fitted quite so well by the approximation. It is worth mentioning that, apart from the possible contribution from the viscous damping, there were complicated localised events of floats being dunked and trapped green water which must contribute extra nonlinear components, see figure 3. The overall fit at the third-order component is less satisfactory, but the magnitude is much smaller compared to the linear component and again the fit is good for the later free-vibration phase. Hence, it is reasonable to assume the M4 machine response in both hinge angle and bending moment is predominantly linear, with small nonlinear contributions scaling according to Stokes harmonics. The effect of damping is shown to be relatively small, consistent with Eatock Taylor et al. (Reference Eatock Taylor, Taylor and Stansby2016). We return to the value of the observed linear damping rate later.
2.2 The RAO
The response amplitude operator (RAO) describes the linear relationship between an input signal and the resultant response. Here the modulus of the RAO can be written as:
 $$\begin{eqnarray}\displaystyle |\text{RAO}|=\sqrt{\displaystyle \frac{S_{response}}{S_{\unicode[STIX]{x1D702}\unicode[STIX]{x1D702}}}}, & & \displaystyle\end{eqnarray}$$
where
 $S_{\unicode[STIX]{x1D702}\unicode[STIX]{x1D702}}$
is the power spectrum of the surface elevation, and
 $S_{response}$
is the power spectrum of the hinge angle or the bending moment. For each wave group test, the RAO is obtained and averaged across all the cases in complex form for two different
 $A_{c}$
. It should be noted that the shape of the incident wave at probe 1 changes as it advances to the focus location. This is allowed for using finite depth linear dispersion theory, which is necessary to produce the correct phase information of the wave, and subsequently of the measured RAO. It is this linear crest amplitude at the focus location which defines
 $A_{c}$
.
The experimentally derived RAOs are plotted as solid lines in figure 7 after a five-point frequency smoothing of the power spectra. The RAO curve is linear within the most energetic frequency excitation range (from
 $\unicode[STIX]{x1D714}=4{-}8~\text{rad}~\text{s}^{-1}$
), with some nonlinearity contaminating the curve to the left and right side of the peak. Two experimentally based RAOs are shown. These are very similar in shape; with the peak RAO for
 $A_{c}=0.08$
m being smaller than that for
 $A_{c}=0.0245$
m, presumably due to the effect of nonlinearity: local submergence of the floats, layers of green water and possibly viscous damping for very large relative motion, which generally reduces the overall machine motion.
Comparison of the RAOs derived from wave group experiments with
 $A_{c}=0.0245$
and 0.08 m (black and grey lines, respectively) and numerically derived RAO using linear potential diffraction solver DIFFRACT (dashed line).

Instead of simply linearising the experimental RAO for use in the subsequent reliability analysis in § 4, we choose to make use of the numerically estimated RAO using the wave-diffraction boundary element code DIFFRACT (Eatock Taylor & Chau Reference Eatock Taylor and Chau1992; Sun, Eatock Taylor & Taylor Reference Sun, Eatock Taylor and Taylor2015). This is helpful because the variation of the RAO as a function of incident wave direction for the subsequent extreme response statistics can be derived numerically, where no experimental data are available. The DIFFRACT code is used to solve the linear diffraction, radiation and hydrodynamic interactions between each float of the M4 machine in a two-body model, with float 1 and 2 modelled as a single body with the appropriate hydrodynamic properties (Sun et al.
Reference Sun, Stansby, Zang, Carpintero Moreno and Taylor2016a
). The code runs in the frequency domain, and the resulting RAO is combined with the input wave components and summed across the finite range of linear frequencies. Each float is modelled with the same geometric and mass/inertia values as used in the experiments. The small red buoy visible in figure 3 is not modelled in the simulation as its effect is assumed to be negligible, and the mooring line is also omitted. Being a linear model, the only damping term that is present in the numerical simulation is the radiation damping, which can be predicted using DIFFRACT. In the actual experiments however, there is likely to be additional damping. We note the local response cancellation in both the experimental and theoretical results at
 $\unicode[STIX]{x1D714}\sim 8.2$
and
 $8.6~\text{rad}~\text{s}^{-1}$
respectively. This is relevant for the linear response for
 $T_{p}=0.8$
s in figure 10.
Comparison of the RAOs derived from wave group experiments with
 $A_{c}=0.0245$
(solid line) and scaled RAO using DIFFRACT (dashed line) in terms of amplitude (a) and phase angle (b).

The numerically derived RAO is presented as the dashed line in figure 7. Comparing the shape with the experimentally measured RAOs, the peak numerical RAO is slightly smaller than the RAO for the smaller
 $A_{c}$
, and there is a small increase in the peak frequency. Ideally, the numerical RAO should be higher than the measured ones, having no damping other than radiation damping in the simulation. We are unable to identify what causes the shift in both the peak frequency and the peak value. The shift could be due to advection effects, as the device is moving quite markedly (mostly in surge motion) as the focussed wave group arrives and the measurements are made relative to a fixed frame of reference. The shift could also be due to device mistuning in either experiments or numerical simulation, or a small misrepresentation of geometry and/or moment of inertia. It should be noted however that, if the numerical RAO is adjusted in both frequency and peak value to fit the measured RAO for the smaller
 $A_{c}$
, the overall shape is very similar within the most energetic frequency excitation range (from
 $\unicode[STIX]{x1D714}=4{-}8~\text{rad}~\text{s}^{-1}$
), and this now provides additional information on the shape of the low and high frequency tails of the RAO. With this regard, we choose to use this modified numerical RAO for our subsequent reliability analysis in § 4.
Figure 8 shows a comparison of the experimentally measured
 $|\text{RAO}|$
and phase shift for the M4 machine and the scaled versions of the DIFFRACT numerical results – essentially curve fits. Both the amplitude and phase match well. Interestingly, if the original numerical results are Froude scaled to shift the frequency of the peak of the RAO curve down by 5 %, this increases the RAO peak value for angle by 10 %. This achieves a very good fit to the experimentally determined RAO curve.
The variation of the RAO with respect to incident wave direction was obtained numerically with DIFFRACT and plotted in figure 9, with the M4 machine aligned along the direction of wave propagation being taken as
 $0^{\circ }$
. Along the peak frequency, the RAO is quite flat within
 $\pm 30^{\circ }$
incident wave direction, beyond which there is a rapid fall off as the direction changes further. The variation with frequency is quite narrow banded for each wave direction. For
 $0^{\circ }$
wave direction, the shape of the RAO recovers to the modified RAO in figure 8.
Presentation of the numerically derived two-dimensional RAO as a function of frequency and incident wave direction.

Envelopes of the hinge angle response of the M4 machine with time, which have been multiplied by
 $\exp [0.023\unicode[STIX]{x1D714}_{R}(t-85)]$
, for all wave group tests and for two amplitudes:
 $A_{c}=0.0245$
m shown in black lines and
 $A_{c}=0.08$
m in grey lines. Red solid line is the average of the smaller amplitude response taken from 85–100 s, while blue dashed line is the same response scaled up by the ratio of the large to small linear amplitudes at focus, over the same time interval.

2.3 The damping behaviour
We now examine the behaviour of the free decay of the machine angular displacement after the wave group has passed by and the free surface in the region of the model has returned to rest, apart from that induced by motion of the machine. From the RAO curve, we examine the peak value and the two half-power points where the value of the RAO is reduced to
 $1/\sqrt{2}\times$
peak. For simple linear systems (Newland Reference Newland2006, p. 72), the width of the resonant peak is related to the linear damping by
 $\unicode[STIX]{x0394}\unicode[STIX]{x1D714}/\unicode[STIX]{x1D714}_{R}\sim 2\unicode[STIX]{x1D701}$
, where
 $\unicode[STIX]{x1D714}_{R}$
is the resonant frequency and
 $\unicode[STIX]{x1D701}$
is the non-dimensional damping rate. For the small amplitude group RAO, this gives a numerical value of
 $\unicode[STIX]{x1D701}\sim 0.025$
. This damping is similar for both the physical experiment and the scaled DIFFRACT numerical result. This implies that only radiation damping is important during these wave group tests. Viscous effects seem to be small in comparison, also found in operational conditions by Eatock Taylor et al. (Reference Eatock Taylor, Taylor and Stansby2016).
For weakly damped linear resonant systems, the free-vibration amplitude decays as
 $\unicode[STIX]{x1D703}\sim \unicode[STIX]{x1D703}_{0}\exp (-\unicode[STIX]{x1D701}\unicode[STIX]{x1D714}_{R}t)$
, where
 $\unicode[STIX]{x1D703}_{0}$
is the initial amplitude. Hence, we can also estimate the appropriate value of damping from the experimentally measured motions after the wave group has moved away from the M4 model, a time we estimate as
 ${\sim}85$
s.
Figure 10 shows the envelopes of the hinge angle response of the M4 machine with time for all the wave group tests (
 $T_{p}=0.8$
, 1, 1.1, 1.2, 1.4 and 1.6 s) for two amplitudes:
 $A_{c}=0.0245$
m shown in black lines, and
 $A_{c}=0.08$
m in grey lines. The envelopes are all multiplied by an exponential group term,
 $\exp [0.023\unicode[STIX]{x1D714}_{R}(t-85)]$
. The red solid line is the average of the smaller amplitude response taken over 85–100 s. Clearly, the portions of all the envelopes for
 $t>85$
s are close to horizontal, showing that in all cases the decay of the free oscillations of the machine is close to linear with a damping value
 $\unicode[STIX]{x1D701}\sim 0.023$
. This value is only 8 % lower than that estimated from the half-power width of the RAO curve. For
 $T_{p}=0.8$
s, there is not enough excitation energy to drive the M4 machine for both amplitudes. For almost all cases, the amplitude for the free-vibration phase is dependent on the size of the wave group, except for
 $T_{p}=1.4$
s, which is unexplained.
On the same figure, the blue dashed line represents where the larger amplitude response envelope would have been if the whole process was linear (scaling the red solid line by the ratio of the large to small linear wave amplitudes at focus). Comparing the blue dashed line with the actual measured larger amplitude response envelope (grey lines) gives an idea of how much response is lost by nonlinearity in the excitation phase. Linear scaling is always expected to be conservative, hence for almost all cases the dashed blue line is always above the red solid line. However, it is not clear why this is not the case for
 $T_{p}=1$
s, although there are admittedly different nonlinear effects on the machine coupling to the response for each
 $T_{p}$
. It should be noted, however, that all the design cases leading to failure have storm
 $T_{p}$
close to or longer than the machine peak RAO period (
 ${\sim}1.2$
s at laboratory scale), hence arguably only cases from
 $T_{p}=1.1{-}1.6$
s are important and relevant for survivability.
Applying the same methodology to the envelopes of the linearised bending moment for all the wave group tests yields the same damping value
 $\unicode[STIX]{x1D701}\sim 0.023$
for the decay during the free oscillations of the machine. In terms of the half-power points of the bending moment RAO, both measurement and numerical results give
 $\unicode[STIX]{x1D701}\sim 0.0255$
. This finding, consistent with the damping behaviour observed for the hinge angle response, further supports the observation that only radiation damping is important for these tests. We also observe similar behaviour for
 $T_{p}=1$
and 1.4 s in the envelopes of the linearised bending moment.
Overall and remarkably, in all cases this damping behaviour is simply linear, even starting from a rotation angle of close to
 $25^{\circ }$
. We associate this damping with linear wave radiation outwards and generated by machine motion in otherwise still water. Even for a rotation angle of
 $25^{\circ }$
, there seems to be little viscous damping – an observation supported by a heaving ring of eight similarly sized cylinders recently reported by Wolgamot et al. (Reference Wolgamot, Taylor, Eatock Taylor, van den Bremer, Raby and Whittaker2016) with oscillation periods close to 1 s.
2.4 The effect of large machine motion
The basic assumption for the M4 machine is that its motion is driven linearly by incident waves, even when the power take-off is turned off and the machine motion is large. Such large motions would occur in severe sea states when machine survivability is a serious issue. Although we have tested in a limited range of conditions in the wave tank, we explore what happens when the machine motion becomes large.
The M4 machine has been tested in a range of wave groups, we now concentrate on those with two amplitudes
 $A_{c}=0.0245$
and 0.08 m and three peak wave periods
 $T_{p}=1.1$
, 1.2 and 1.4 s. We assume that the machine responds in a purely linear manner for each of the small amplitude wave groups. Then, with the linearised surface elevation time histories at the model (using linear dispersion theory from the upstream wave gauge) and the linearised machine motion, we estimate the small amplitude RAO. We perform this for each individual small amplitude group, hence the estimated RAO here is specific to each wave group. Virtually identical results were obtained when using the average of the three small amplitude RAOs. Using a frequency convolution, we can estimate the response of the M4 model in each of the large wave groups and compare this to the measured machine response. We note in passing that the actual time history of the large group at the model is not simply a scaled-up version of the small one because of wave–wave interactions and for some groups some spilling breaking occurred upstream of the model.
Figure 11(a,c,e) shows the measured angular displacement of the central hinge (grey lines) and estimated linear response based on the large input wave history and the small amplitude RAO (red lines) for all three of the large amplitude wave groups. Positive angular displacement here corresponds to the position of the floats being high–low–high relative to their equilibrium positions. In each case, the initial growth phase of the angle is well approximated using the small amplitude RAO but the measured and estimated histories diverge once the first ‘crest’ in the record exceeds approximately
 $+25$
to
 $30^{\circ }$
; examination of the video records show that this corresponds to the middle float being ‘dunked’ and water flowing on top briefly. Thereafter, the measured response is smaller than the estimate and ‘dunking’ occurs for several subsequent ‘crests’ in the record greater than
 $25^{\circ }{-}30^{\circ }$
. Once ‘dunking’ is over and the wave group has passed by the machine, the subsequent damped free vibration is comparable for the actual and estimated motions.
(a,c,e) Comparison between the measured linear hinge angle (grey lines) and the estimated linear response based on the large input wave history and the small wave group RAO (red lines). (b,d,f) Comparison between the measured linear surface elevation (grey lines) and the estimated linear surface elevation based on the actual large machine motion and the small wave group RAO (red lines) at the model. All plots are for
 $A_{c}=0.08$
m and
 $T_{p}=1.1$
s (a,b), 1.2 s (c,d) and 1.4 s (e,f).
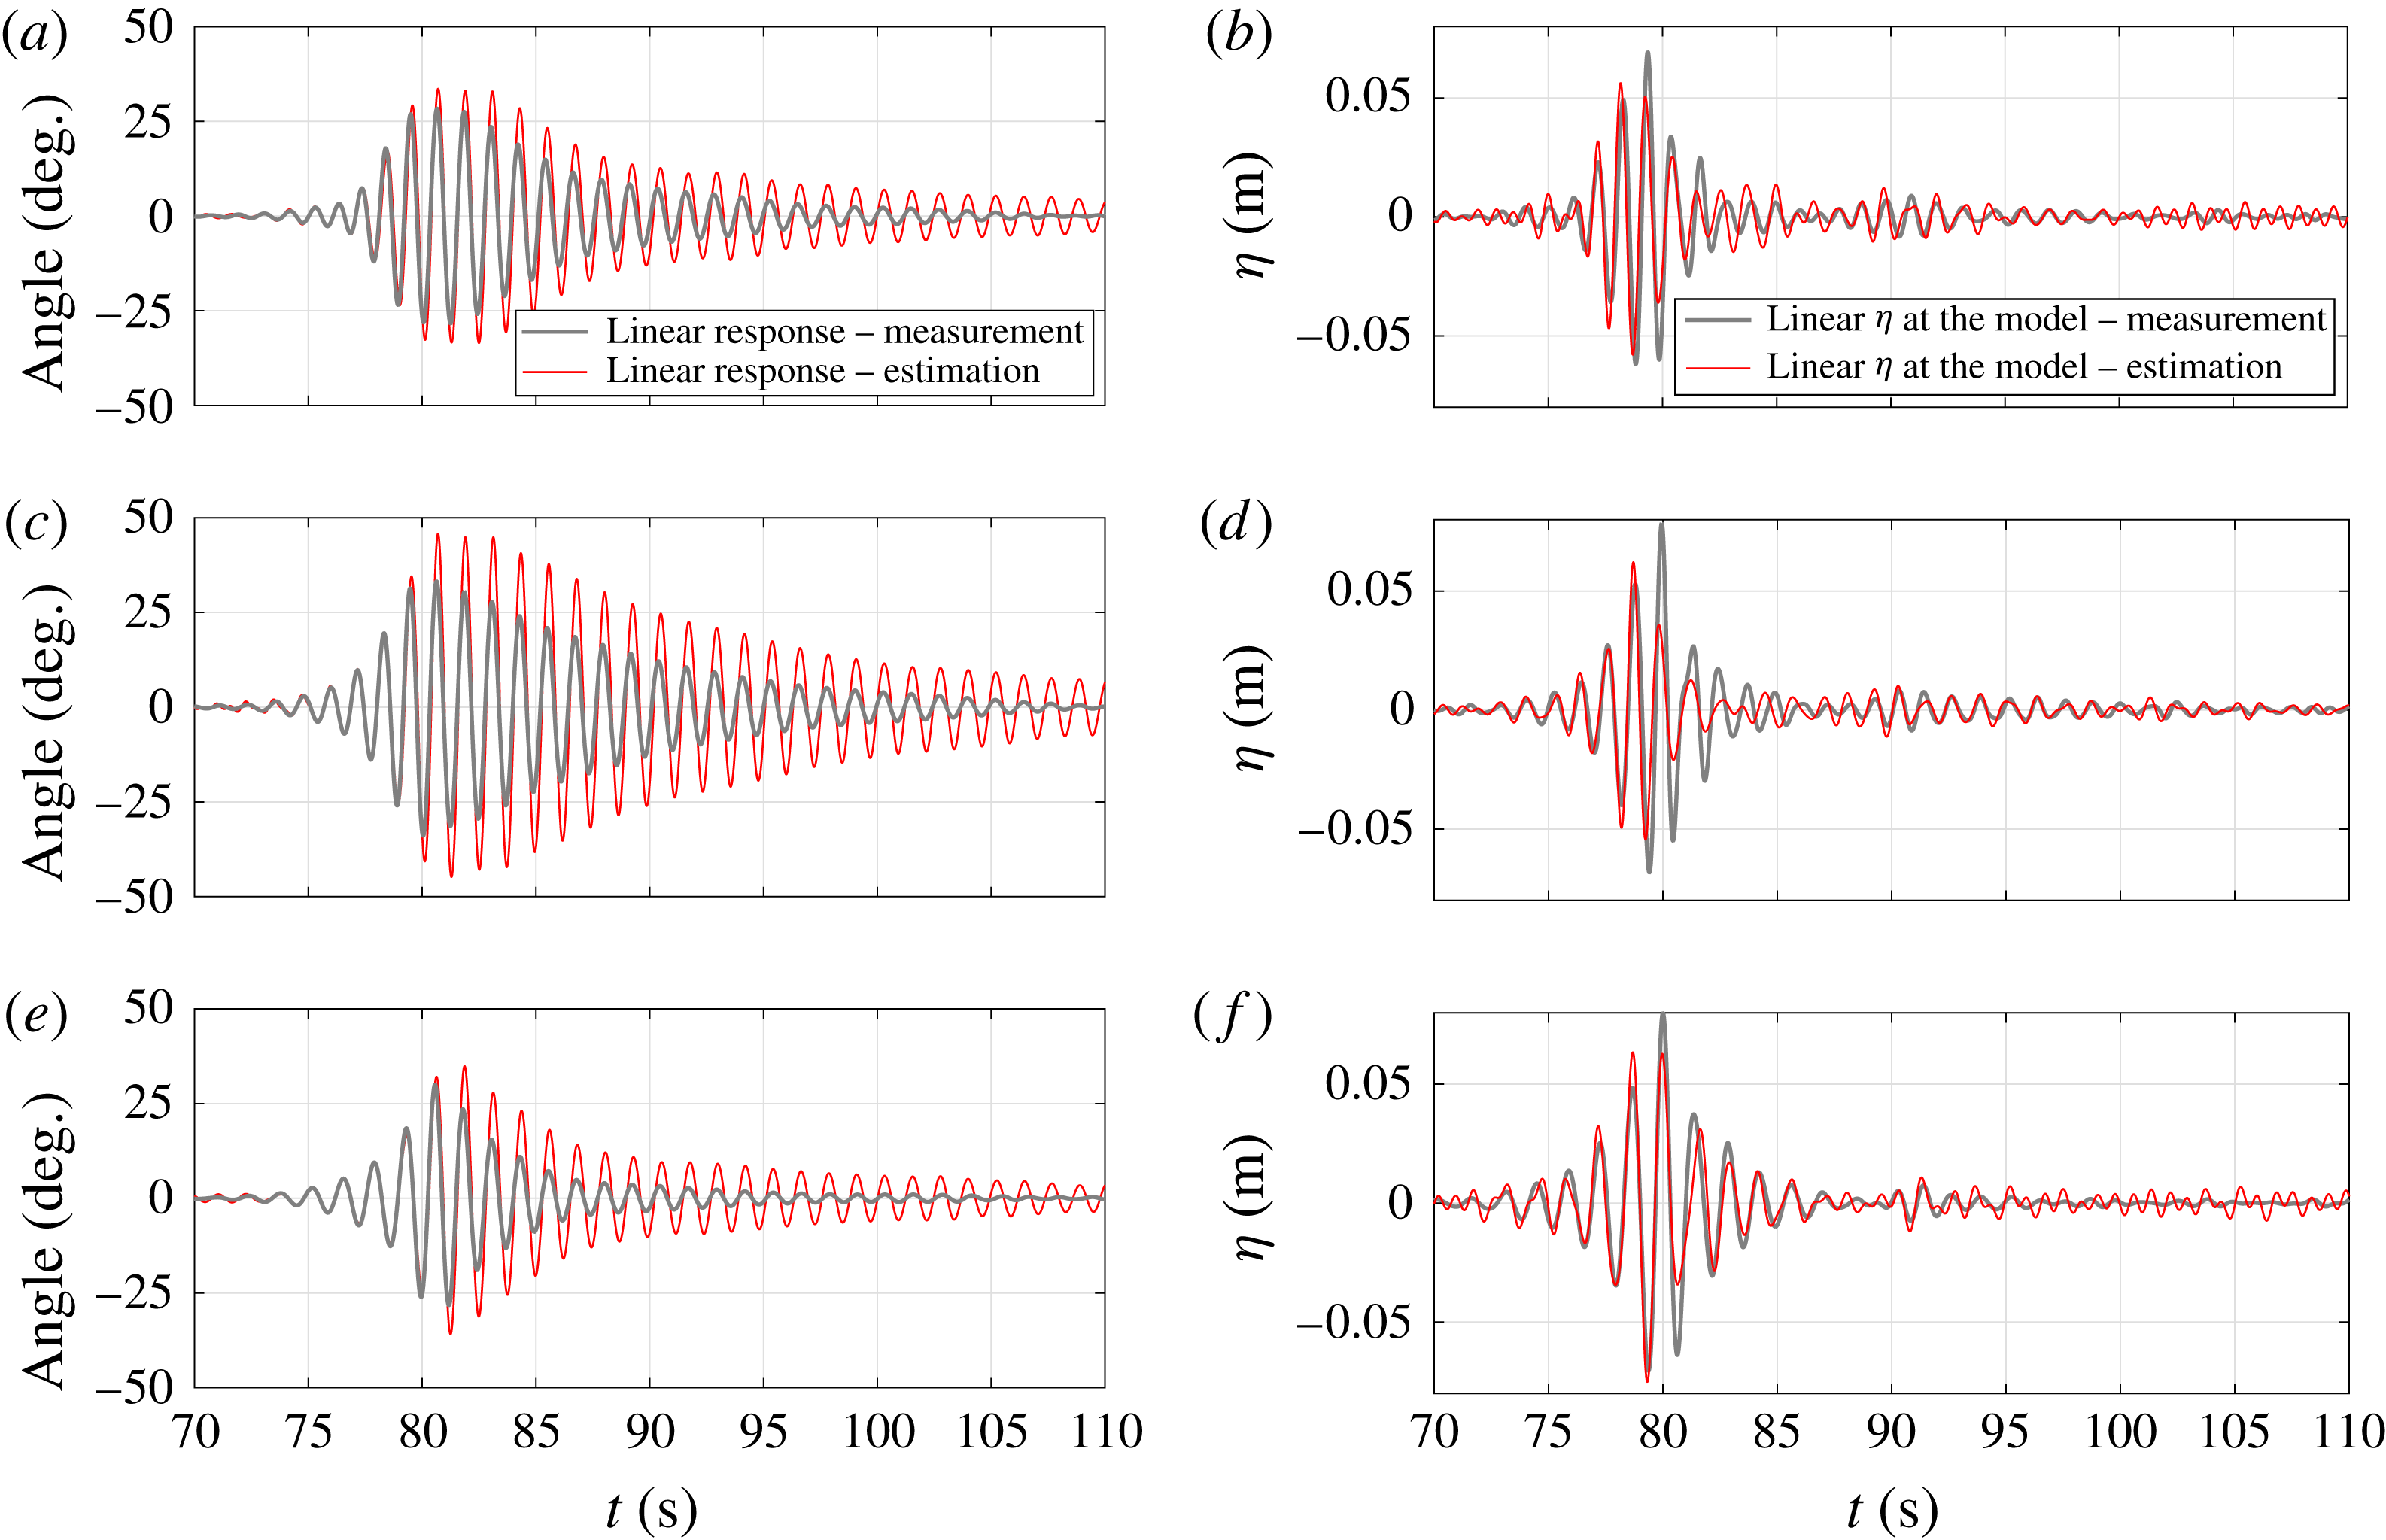
As well as comparing the estimated purely linear and actual measured machine responses, it is of considerable interest to examine which elements of the incoming wave group are driving the motion and which are largely uncoupled. We can do this by comparing the large amplitude linearised wave motion at the model to that estimated from the actual machine motion and the small amplitude wave group RAO. The ‘measured’ linear surface elevation at the model is estimated using the upstream wave gauge and linear dispersion, denoted by the grey lines on figure 11(b,d,f). Now we perform a frequency convolution of the actual machine angular motion with
 $\text{RAO}^{-1}$
to obtain an estimate of the linear wave which would drive the measured angular response. Figure 11(b,d,f) compares each incident large amplitude wave group at the M4 model (grey lines) to the estimate of what each group would have been if the excitation was purely linear (red lines). Just as for the angular responses in figure 11(a,c,e), the first half of the time history of each pair matches well, thereafter the estimated linear wave is significantly smaller.
In figure 11(a,c,e), the difference between the estimated and measured large response for each large group corresponds to the loss of extreme response due to ‘dunking’. In figure 11(b,d,f), the equivalent difference for each large wave group corresponds to the loss of excitation of this extreme response. It is striking that for the group with
 $T_{p}=1.2$
s, the estimated linear extreme response of
 $45^{\circ }$
is reduced to
 $33^{\circ }$
by ‘dunking’. For the other two groups,
 $34^{\circ }$
is reduced to
 ${\sim}29^{\circ }$
. This suggests that the onset of ‘dunking’ of the central float is a very strong limiting factor on extreme response. Until this ‘dunking’ occurs, the machine response is remarkably linear. It is worth noting that ‘dunking’ has previously been used as a strategy for limiting response on a heaving point absorber (Stallard, Weller & Stansby Reference Stallard, Weller and Stansby2009).
Snapshots of the M4 machine during violent focussed wave group test.

Figure 12 contains stills from a video showing firstly ‘dunking’ of the central float for the machine in its high–low–high displaced shape, and secondly the machine in its low–high–low displacement with water still draining off the central float. For this second shape, self-collision has just occurred between the top edge of the central float and the beam running to the largest float.
3 NewWave in response
Here we present a methodology to obtain the most probable maximum response of the wave energy converter in a realistic sea-state condition, assuming linear motion. For linear random waves with Gaussian surface elevation statistics, the average shape of the largest wave in time tends to a scaled autocorrelation of the underlying wave spectrum (Lindgren Reference Lindgren1970; Boccotti Reference Boccotti1983), and this concept was brought into offshore engineering by Tromans et al. (Reference Tromans, Anaturk and Hagemeijer1991), where it became known as NewWave. A comparison was made between the measured large linearised crests and equivalent predictions by the NewWave model for time series recorded offshore in the North Sea (Jonathan & Taylor Reference Jonathan and Taylor1997) and in the Gulf of Mexico (Santo et al. Reference Santo, Taylor, Eatock Taylor and Choo2013). The agreement was excellent, justifying the application of NewWave as a reasonable model for the linear part of large offshore wave crests.
This NewWave concept in wave crest statistics was further extended to the average shape of structural response (NewWave in response) by Grice, Taylor & Eatock Taylor (Reference Grice, Taylor and Eatock Taylor2013, Reference Grice, Taylor and Eatock Taylor2015), who looked at the resultant crest elevations and wave run up on a four-leg semi-submersible platform under focussed wave groups. Here we apply a similar NewWave in response methodology to the M4 machine in terms of hinge angle and bending moment, for a given sea state.
For a stationary narrow-banded Gaussian random process, it can be assumed that the individual waves and machine responses follow a Rayleigh distribution in amplitude. In this application, it should be noted that the machine responses are dominated by the main resonant peak, so are considerably more narrow banded than the incident wave field. The normalised probability density function for the amplitude can be written as:
 $$\begin{eqnarray}\displaystyle p(\unicode[STIX]{x1D709})=\unicode[STIX]{x1D709}\exp (-\unicode[STIX]{x1D709}^{2}/2), & & \displaystyle\end{eqnarray}$$
where
 $\unicode[STIX]{x1D709}=\unicode[STIX]{x1D6FC}/\sqrt{m_{0}}$
is the normalised amplitude and
 $m_{0}$
is the total variance of the spectrum,
 $S(\unicode[STIX]{x1D714}_{n})$
, which is given by
 $m_{0}=\sum _{n=0}^{\infty }S(\unicode[STIX]{x1D714}_{n})\unicode[STIX]{x0394}\unicode[STIX]{x1D714}$
. For a single wave or response, the probability of its amplitude being less than
 $\unicode[STIX]{x1D709}$
is:
 $$\begin{eqnarray}\displaystyle P(\unicode[STIX]{x1D709})=\int _{0}^{\unicode[STIX]{x1D709}}p(\unicode[STIX]{x1D709}^{\prime })\,\text{d}\unicode[STIX]{x1D709}^{\prime }=1-\exp (-\unicode[STIX]{x1D709}^{2}/2). & & \displaystyle\end{eqnarray}$$
Thus, for
 $N$
statistically independent waves or responses, the probability that the amplitude
 $\unicode[STIX]{x1D6FC}$
will be exceeded at least once is given by:
 $$\begin{eqnarray}\displaystyle 1-P^{N}=1-[1-\exp (-\unicode[STIX]{x1D709}^{2}/2)]^{N}. & & \displaystyle\end{eqnarray}$$
The probability density of the largest value in
 $N$
waves or responses can be derived from this, and the peak of the probability density function denoted by
 $\unicode[STIX]{x1D6FC}$
, which is the most probable extreme wave or response amplitude in
 $N$
samples, can be approximated for large
 $N$
as:
 $$\begin{eqnarray}\displaystyle \unicode[STIX]{x1D6FC}=\sqrt{(2m_{0}\log N)}. & & \displaystyle\end{eqnarray}$$
This result is well known (Newman Reference Newman1977, p. 319). In general,
 $N$
is obtained from the zero crossing period (
 $T_{z}$
) of waves or responses in a 3 h sea state, with
 $T_{z}=\sqrt{m_{0}/m_{2}}$
, and
 $m_{2}=\sum _{n=0}^{\infty }\unicode[STIX]{x1D714}^{2}S(\unicode[STIX]{x1D714}_{n})\unicode[STIX]{x0394}\unicode[STIX]{x1D714}$
. However, for the M4 machine we can simply take the period corresponding to the peak of the RAO curve. In a sea state with
 $T_{z}=15$
s for example, but with
 $T_{\mathit{machine}}=9.35$
s,
 $\unicode[STIX]{x1D6FC}/\sqrt{m_{0}}$
values only differ by 3 %.
By superposition of monochromatic deterministic plane waves, one can write an expression for the surface elevation for general wave motions as
 $$\begin{eqnarray}\displaystyle \unicode[STIX]{x1D702}=\text{Re}\left[\mathop{\sum }_{n}\mathop{\sum }_{k}A_{nk}\exp (\text{i}\unicode[STIX]{x1D714}_{n}t-\unicode[STIX]{x1D705}_{n}x\cos \unicode[STIX]{x1D703}_{k}-\unicode[STIX]{x1D705}_{n}y\sin \unicode[STIX]{x1D703}_{k})\right], & & \displaystyle\end{eqnarray}$$
where
 $A_{nk}$
is a random variable compatible with wave directional spectrum,
 $\unicode[STIX]{x1D714}$
is the wave frequency,
 $\unicode[STIX]{x1D705}$
is the scalar wavenumber,
 $\unicode[STIX]{x1D703}$
is the angle of incidence relative to the
 $x$
-axis. Similarly, the expression for the response such as hinge angle (
 $\unicode[STIX]{x1D719}$
) can be obtained by convoluting
 $A_{nk}$
with the two-dimensional RAO, or
 $Z_{nk}$
say.
In terms of power spectra, the spectrum of response angle
 $\unicode[STIX]{x1D719}$
is expressed as:
 $$\begin{eqnarray}\displaystyle S_{\unicode[STIX]{x1D719}\unicode[STIX]{x1D719}}(\unicode[STIX]{x1D714}_{n})=S_{\unicode[STIX]{x1D702}\unicode[STIX]{x1D702}}(\unicode[STIX]{x1D714}_{n})\mathop{\sum }_{k}|Z_{nk}^{2}(\unicode[STIX]{x1D714}_{n},\unicode[STIX]{x1D703}_{k})|H_{nk}(\unicode[STIX]{x1D714}_{n},\unicode[STIX]{x1D703}_{k})\unicode[STIX]{x0394}\unicode[STIX]{x1D703}, & & \displaystyle\end{eqnarray}$$
where
 $S_{\unicode[STIX]{x1D702}\unicode[STIX]{x1D702}}(\unicode[STIX]{x1D714}_{n})$
is the power spectrum of surface elevation, and
 $H_{nk}(\unicode[STIX]{x1D714}_{n},\unicode[STIX]{x1D703}_{k})$
is the directional wave spreading function, which satisfies
 $\sum _{k}H_{nk}(\unicode[STIX]{x1D714}_{n},\unicode[STIX]{x1D703}_{k})\unicode[STIX]{x0394}\unicode[STIX]{x1D703}=1$
. Then, NewWave in response angle is simply:
 $$\begin{eqnarray}\displaystyle \unicode[STIX]{x1D719}_{NW}=\unicode[STIX]{x1D6FC}_{\unicode[STIX]{x1D719}}\displaystyle \frac{\displaystyle \mathop{\sum }_{n}S_{\unicode[STIX]{x1D719}\unicode[STIX]{x1D719}}(\unicode[STIX]{x1D714}_{n})\unicode[STIX]{x0394}\unicode[STIX]{x1D714}\,\text{Re}[\exp (\text{i}\unicode[STIX]{x1D714}_{n}t)]}{\displaystyle \mathop{\sum }_{n}S_{\unicode[STIX]{x1D719}\unicode[STIX]{x1D719}}(\unicode[STIX]{x1D714}_{n})\unicode[STIX]{x0394}\unicode[STIX]{x1D714}}, & & \displaystyle\end{eqnarray}$$
where
 $\unicode[STIX]{x1D6FC}_{\unicode[STIX]{x1D719}}$
is the 1 in
 $N$
linear crest elevation in the random sea state. We can define the unidirectional designer wave as the wave time history which would give the NewWave in response angle as:
 $$\begin{eqnarray}\displaystyle \unicode[STIX]{x1D702}_{\unicode[STIX]{x1D719}_{NW}}=\unicode[STIX]{x1D6FC}_{\unicode[STIX]{x1D719}}\displaystyle \frac{\displaystyle \mathop{\sum }_{n}S_{\unicode[STIX]{x1D719}\unicode[STIX]{x1D719}}(\unicode[STIX]{x1D714}_{n})\unicode[STIX]{x0394}\unicode[STIX]{x1D714}\,\text{Re}[Z_{n\unicode[STIX]{x1D703}=0}^{-1}\exp (\text{i}\unicode[STIX]{x1D714}_{n}t)]}{\displaystyle \mathop{\sum }_{n}S_{\unicode[STIX]{x1D719}\unicode[STIX]{x1D719}}(\unicode[STIX]{x1D714}_{n})\unicode[STIX]{x0394}\unicode[STIX]{x1D714}}. & & \displaystyle\end{eqnarray}$$
Equivalently, the average shape of the largest waves in the incident random wave field, the NewWave in surface elevation, is expressed as:
 $$\begin{eqnarray}\displaystyle \unicode[STIX]{x1D702}_{NW}=\unicode[STIX]{x1D6FC}_{\unicode[STIX]{x1D702}}\displaystyle \frac{\displaystyle \mathop{\sum }_{n}S_{\unicode[STIX]{x1D702}\unicode[STIX]{x1D702}}(\unicode[STIX]{x1D714}_{n})\unicode[STIX]{x0394}\unicode[STIX]{x1D714}\,\text{Re}[\exp (\text{i}\unicode[STIX]{x1D714}_{n}t)]}{\displaystyle \mathop{\sum }_{n}S_{\unicode[STIX]{x1D702}\unicode[STIX]{x1D702}}(\unicode[STIX]{x1D714}_{n})\unicode[STIX]{x0394}\unicode[STIX]{x1D714}} & & \displaystyle\end{eqnarray}$$
and we can define the associated response angle in time due to the NewWave in surface elevation as:
 $$\begin{eqnarray}\displaystyle \unicode[STIX]{x1D719}_{\unicode[STIX]{x1D702}_{NW}}=\unicode[STIX]{x1D6FC}_{\unicode[STIX]{x1D702}}\displaystyle \frac{\displaystyle \mathop{\sum }_{n}S_{\unicode[STIX]{x1D702}\unicode[STIX]{x1D702}}(\unicode[STIX]{x1D714}_{n})\unicode[STIX]{x0394}\unicode[STIX]{x1D714}\,\text{Re}[Z_{n\unicode[STIX]{x1D703}=0}\exp (\text{i}\unicode[STIX]{x1D714}_{n}t)]}{\displaystyle \mathop{\sum }_{n}S_{\unicode[STIX]{x1D702}\unicode[STIX]{x1D702}}(\unicode[STIX]{x1D714}_{n})\unicode[STIX]{x0394}\unicode[STIX]{x1D714}}. & & \displaystyle\end{eqnarray}$$
Both
 $\unicode[STIX]{x1D6FC}_{\unicode[STIX]{x1D719}}$
and
 $\unicode[STIX]{x1D6FC}_{\unicode[STIX]{x1D702}}$
are the most probable extreme response and wave amplitude in
 $N$
samples, respectively, see (3.4).
In this analysis, we are answering two different questions:
-
(i) What is the most probable maximum hinge angle in time (
 $\unicode[STIX]{x1D719}_{NW}$
), and the associated input wave which produces this response (
$\unicode[STIX]{x1D702}_{\unicode[STIX]{x1D719}_{NW}}$
)?
-
(ii) What is the most probable shape of extreme waves in the incident field (
$\unicode[STIX]{x1D702}_{NW}$
), and the associated hinge angle motion in time (
$\unicode[STIX]{x1D719}_{\unicode[STIX]{x1D702}_{NW}}$
)?


The solutions are connected by a reciprocal relationship that will be discussed later.
4 Long-term response statistics
To provide realistic sea-state data, the Norwegian 10 km Reanalysis Archive (NORA10) hindcast data for Orkney from 1958–2011 are used as a case study in this paper. The location of the NORA10 grid point is
 $58.97\,^{\circ }\text{N}$
,
 $03.60\,^{\circ }\text{W}$
. This is located
 ${\sim}30$
km west of the EMEC (European Marine Energy Centre) test site for marine renewable energy machines on the west coast of Orkney. From Santo et al. (Reference Santo, Taylor, Eatock Taylor and Stansby2016a
), it has been shown that at Orkney the mean annual wave power produced by the M4 machine is strongly correlated to the NAO, allowing the statistics of the historical mean power to be reconstructed back over 350 years into the past. Hence, this location is of great interest.
The wave data available in 3 h intervals (per sea state) contain information such as date, time, significant wave height (
 $H_{s}$
), peak spectral wave period (
 $T_{p}$
), mean wave period (
 $T_{m}$
), wind speed, wind and wave directions, and also the sea-state data split into wind sea and swell with each having
 $H_{s}$
,
 $T_{p}$
and wave directions provided, see Reistad et al. (Reference Reistad, Breivik, Haakenstad, Aarnes, Furevik and Bidlot2011) for more details on the NORA10 data. We first present the long-term response statistics using the entire sea-state data (defined as total sea – unimodal frequency distribution); in § 5 we will present similar statistical analysis using the split-sea data (bimodal frequency distribution). Previous analysis using the same data had compared model and buoy data in terms of the annual mean and extreme values at several locations, and in general the agreement is reasonable, see Santo et al. (Reference Santo, Taylor, Woollings and Poulson2015, Reference Santo, Taylor and Gibson2016b
).
Figure 13 presents a scatter diagram of normalised occurrence of
 $H_{s}$
and
 $T_{p}$
for the entire 54 years of hindcast record at Orkney, with red indicating the highest number of occurrences. The two lines represent lines of constant steepness (defined as
 $s=H_{s}/T_{p}^{2}$
): solid line for the constant limiting steepness (
 $s=0.0576$
) and dashed line for the constant mean steepness (
 $s=0.0169$
). The limiting steepness line in one sense represents the most severe historical sea states ever predicted at that location during the period of the available data. This steepness also matches that presented by Socquet-Juglard et al. (Reference Socquet-Juglard, Dysthe, Trulsen, Krogstad and Liu2005) from a compilation of northern North Sea and Norwegian Sea field measurements.
Scatter diagram of normalised occurrence of
 $H_{s}$
and
 $T_{p}$
at Orkney from 1958–2011, with red region indicating the highest number of occurrences. Solid line represents the constant limiting steepness, dashed line represents the constant average steepness.

The standard JONSWAP spectral shape with
 $\unicode[STIX]{x1D6FE}=3.3$
for the peak enhancement factor is assumed for all sea states, and the bimodal directional spreading function according to Ewans (Reference Ewans1998) is used to model directional spreading in fetch-limited sea states, the form produced by Ewans is reproduced here:
 $$\begin{eqnarray}\displaystyle H(f,\unicode[STIX]{x1D703}) & = & \displaystyle \displaystyle \frac{1}{\sqrt{8\unicode[STIX]{x03C0}}\unicode[STIX]{x1D70E}(f)}\mathop{\sum }_{k=-\infty }^{\infty }\exp \left[-\displaystyle \frac{1}{2}\left(\displaystyle \frac{\unicode[STIX]{x1D703}-\unicode[STIX]{x1D703}_{m1}(f)-2\unicode[STIX]{x03C0}k}{\unicode[STIX]{x1D70E}(f)}\right)^{2}\right]\nonumber\\ \displaystyle & & \displaystyle +\exp \left[-\displaystyle \frac{1}{2}\left(\displaystyle \frac{\unicode[STIX]{x1D703}-\unicode[STIX]{x1D703}_{m2}(f)-2\unicode[STIX]{x03C0}k}{\unicode[STIX]{x1D70E}(f)}\right)^{2}\right],\end{eqnarray}$$
where
 $\unicode[STIX]{x1D70E}(f)$
is the angular width (a measure of the spreading of each component) and
 $\unicode[STIX]{x1D703}_{m1}(f)$
and
 $\unicode[STIX]{x1D703}_{m2}(f)$
are the locations of the peaks. The mean wave direction is given by
 $(\unicode[STIX]{x1D703}_{m1}+\unicode[STIX]{x1D703}_{m2})/2$
. The parametric forms for
 $\unicode[STIX]{x1D70E}(f)$
and
 $\unicode[STIX]{x1D703}_{m2}-\unicode[STIX]{x1D703}_{m1}$
are described in (6.4) and (6.5) of Ewans (Reference Ewans1998, p. 508). The Ewans directional distribution is unimodal for
 $\unicode[STIX]{x1D714}<2\unicode[STIX]{x1D714}_{p}$
and splits into a bimodal form for
 $\unicode[STIX]{x1D714}>2\unicode[STIX]{x1D714}_{p}$
. Figure 14 illustrates a contour plot of the Ewans directional distribution, noting that the spectral levels at each frequency are normalised to have a maximum of one to emphasise the split of the distribution at high frequency.
Contour plot of the Ewans directional distribution. Dark corresponds to high levels, light to low levels. The spectral levels at each frequency are normalised to have a maximum of unity for illustration purpose.

The subsequent analysis initially assumes the M4 machine remains aligned along the mean wave direction in both unidirectional and spread seas. Assuming no water depth effects on the hindcast data, the RAO is scaled up from laboratory scale to full scale, by scaling the resonant heave period of the stern float (float 3, or
 $T_{r3}$
) to the long-term average wave energy period (
 $T_{e}=8.44$
s) at Orkney, giving a machine beam length of 47 m (the overall machine length being 94 m from float 1–3), operating on water of depth 60 m. It should be noted that the M4 machine is sized based on the long-term average
 $T_{e}$
, by taking
 $T_{r3}=$
average
 $T_{e}$
, see Santo et al. (Reference Santo, Taylor, Eatock Taylor and Stansby2016a
) for more details on the machine sizing.
(a) Plot of the NewWave focussed wave group in time at the focus location without the presence of the M4 machine (black line), and the associated response in time due to the wave group (red line) for 1 in 3 h response level. (b) Plot of the NewWave machine response in time (red line) and the associated input designer wave group that leads to the maximum expected response (black line). All plots are normalised by
 $\unicode[STIX]{x1D6FC}_{\unicode[STIX]{x1D702}}$
.

Figure 15 shows the surface elevations (black lines) and responses (red lines) in time due to (3.7)–(3.10) for an extreme storm of duration set to 3 h with
 $H_{s}=13$
m and
 $T_{p}=15$
s (on the limiting steepness line). Both the surface elevations and responses are plotted on the same horizontal axis, while the vertical axis for the surface elevations is on the left and for the responses is on the right. Figure 15(a) shows the NewWave focussed wave group in time at the focus location without the presence of the M4 machine (
 $\unicode[STIX]{x1D702}_{NW}$
), and the associated response after the interaction of this wave group with the M4 machine at the 1 in 3 h response level (
 $\unicode[STIX]{x1D719}_{\unicode[STIX]{x1D702}_{NW}}$
). Figure 15(b) shows the 1 in 3 h NewWave machine response in time (
 $\unicode[STIX]{x1D719}_{NW}$
), and the associated input designer wave group that leads to the maximum expected response (
 $\unicode[STIX]{x1D702}_{\unicode[STIX]{x1D719}_{NW}}$
). All figures are normalised by
 $\unicode[STIX]{x1D6FC}_{\unicode[STIX]{x1D702}}$
. One can easily see the reciprocity in time between
 $\unicode[STIX]{x1D719}_{\unicode[STIX]{x1D702}_{NW}}$
and
 $\unicode[STIX]{x1D702}_{\unicode[STIX]{x1D719}_{NW}}$
, these signals are identical in shape if one of the time axes is reversed. Earlier applications of this reciprocity results are given in Grice et al. (Reference Grice, Taylor and Eatock Taylor2013, Reference Grice, Taylor and Eatock Taylor2015). It can be observed that for this case, with storm
 $T_{p}$
away from the peak period of the RAO,
 $\unicode[STIX]{x1D702}_{NW}$
produces a small response in the machine, i.e. the machine basically rides over the crests and troughs of the long waves. On the other hand, the designer wave (
 $\unicode[STIX]{x1D702}_{\unicode[STIX]{x1D719}_{NW}}$
) with peak linear crest amplitude one-third of
 $\unicode[STIX]{x1D702}_{NW}$
, but with much more critical wave frequency content and phasing, gives rise to the most energetic machine excitation (the expected maximum response), which is now twice as large. Hence, as far as the machine response is concerned, the designer wave is not the most extreme wave in the open ocean. Instead, the most extreme wave has a frequency content more matched to the M4 response, but of course of equal likelihood of the largest in 3 h in the same sea state. Also, it is worth noting that because the machine response is fairly narrow banded, the wiggles in the excitation decay slowly in time (long memory effect), which is much slower than typically expected for surface elevation in ocean, and the excitation period depends to a close approximation only on the peak frequency of the RAO, regardless of the sea state. In any future experimental testing of M4 models, the designer wave (
 $\unicode[STIX]{x1D702}_{\unicode[STIX]{x1D719}_{NW}}$
) would be an ideal waveform for examining extreme motion in more detail.
Performing the NewWave in response analysis in both the limiting and mean steepness lines for the M4 machine sized for Orkney, we obtain the variation of the peak hinge angle at a 1 in 3 h level as a function of storm
 $T_{p}$
as shown in figure 16. The results for unidirectional and directional sea states are plotted in blue and red lines, respectively, and the variations along the limiting steepness and the mean steepness lines are shown in dashed and solid lines, respectively. As expected, the peak response occurs when the storm
 $T_{p}$
is close to the peak RAO of the full-scale machine (about 9.3 s). Interestingly, as the storm
 $T_{p}$
is further increased to represent more severe storms (much larger waves), the machine response is close to flat (asymptotic) for constant wave steepness, demonstrating that the machine responds very similarly under the most extreme sea states. Thus, the machine response is controlled by the steepness of the sea state, rather than the wave height.
Peak hinge angle response for unidirectional (blue lines) and directional (red lines) sea states along the limiting steepness lines (dashed lines) and the mean steepness lines (solid lines).

Universal tail form of the standard JONSWAP spectrum for all storms with same steepness (
 $H_{s}/T_{p}^{2}$
). The downward pointing black arrow indicates the frequency of the peak RAO of the full-scale M4 machine.

The asymptotic behaviour of the machine response for large
 $T_{p}$
is due to the JONSWAP high frequency tail (
 $\unicode[STIX]{x1D714}^{-5}$
), which is identical for any storm with the same overall steepness, see figure 17 for an illustration. Hence, the asymptotic result along the limiting steepness line provides an upper bound for the extreme machine response. The peak responses for directional spread sea states, in comparison with unidirectional sea, are reduced by approximately 10–20 % for increasing
 $T_{p}$
due to the bimodal behaviour of Ewans spreading function at high frequency, and the reduction of the RAO with incident wave direction.
Histogram of the peak hinge angle distribution of the M4 machine from 1958–2011 at Orkney for three different sea-state assumptions. The probability of a response level in each
 $10^{\circ }$
bin is given by the height of the bar in that bin.

The upper bound of the extreme response is larger than
 $70^{\circ }$
for both unidirectional and directional spread sea states assuming linear behaviour. This peak hinge angle is clearly much too large for the present machine configuration with a straight beam connecting floats 2 and 3, where
 $\unicode[STIX]{x1D719}\sim 40^{\circ }$
is the limiting angle before self-collision between float 2 and the beam, a first indication that the M4 machine will not survive in the long term at Orkney without taking this into consideration by appropriate design. It is worth mentioning that the analysis so far neglects the effect of nonlinearity: local submergence of the floats and possibly viscous damping for very large relative motion, which is apparent from figures 7, 10 and 11. Including the effect of this nonlinearity will reduce the peak response in general. Nevertheless, these linear results do give an upper bound on machine responses. Linear theory is adequate for angles
 ${<}30^{\circ }$
, as discussed in § 2.4. This includes all storms, however severe in terms of wave height, if the overall steepness is at the mean or lower. This corresponds to longer wave periods. Further experiments are justified to see whether the ‘dunking’ identified in § 2.4 can reduce the most extreme linear predictions of angular displacement to a level small enough to give confidence of machine survival in any sea state likely to occur west of the Orkney Islands.
Continuing with the assumption of linear response, and performing the extreme response analysis over 54 years of the hindcast data, we obtain the histogram of the peak hinge angle distribution over time as shown in figure 18 for the 1 in 3 h response level for both unidirectional and directional spread seas (the first and second bar for each distribution bin). The outcomes of the long-term hinge angle response statistics are summarised in table 1. We find a reduction in peak hinge angle when accounting for directional spreading as opposed to unidirectional, as can be seen from the histogram for directional spread seas the number of occurrences increases for smaller hinge angle and decreases for larger hinge angle. The reduction is represented on average by the reduction in the mean of the hinge angle distribution. However, as the extreme responses with a straight beam used in the experiments are in general much larger than the critical hinge angle, the probability of failure or beam/float clashing under these two different sea-state assumptions show no significant difference. For directional spread seas, this does not occur 89 % of the time over the entire 157 791 sea states, which is effectively the probability of it not occurring in a single randomly chosen sea state. In other words, the present average time between clashing using a straight beam (taking this as
 $\unicode[STIX]{x1D719}>40^{\circ }$
) is 28 h, and the beam shape needs to be modified to accommodate the maximum possible angle (probably as a lattice structure arrangement in practice).
Summary of the long-term hinge angle linear response statistics under four different assumptions in a randomly chosen 3 h sea state.

5 Extreme response with lack of alignment
The analysis so far assumes the machine is aligned along the mean wave direction in both unidirectional and spread seas, and the general finding is that there is a slight reduction in the peak machine response when accounting for directional spreading as opposed to unidirectional waves. Lack of alignment of the machine could be investigated, which might further reduce the machine response. The analysis is straightforward for a unidirectional sea, with the reduction in peak hinge angle following a similar shape as the RAO variation with incident wave direction at the peak frequency (see figure 9). For a directionally spread sea, however, the information on the slow drift motion of the machine in yaw is required, i.e. what orientation relative to the mean wave direction will the machine point to in a spread sea. The effect of yaw of the machine will be investigated in this section.
From the same NORA10 hindcast data, the total sea split into wind sea and swell are available for each sea state, and each component contains
 $(H_{s},T_{p})$
and peak wave direction. Hence, it is possible to include the effect of bimodality in frequency to investigate any possible reduction in extreme response by allowing for lack of machine alignment. Two additional cases are considered: bimodal frequency distribution (split sea) with the same mean wave direction, and with different mean wave directions for each component, both cases in directional spread seas. For the latter scenario, instead of using the yaw moment (which is not available), we position the M4 machine at an arbitrary direction bounded by the wave direction for swell and wind sea, and search for the direction in this range which maximizes the total motion response, and use that for long-term response statistics. This approach is conservative, because the machine is likely to wander about, so even with second-order difference yaw calculations, the correct approach (incident) wave direction to use would remain unknown. The machine response beyond
 $\pm 90^{\circ }$
incident wave direction relative to the machine is assumed to be insignificant, justified from the rapid reduction of the machine RAO shown in figure 9. The results of the response statistics for the two additional cases are shown in table 1. The histogram of the peak hinge angle distribution for the case of two different mean wave directions is shown in figure 18 as the third bar on each bin; the histogram for the same wave direction is not shown as both distributions are very similar.
Comparing the total sea to the split-sea case, we are investigating the effect of bimodality in frequency on the extreme hinge angle response. From the histogram distribution in figure 18, we observe some reduction in the response for
 $\unicode[STIX]{x1D719}<40^{\circ }$
(non-clashing region), represented by an increase in number of occurrences for
 $\unicode[STIX]{x1D719}<20^{\circ }$
and a decrease for
 $20^{\circ }<\unicode[STIX]{x1D719}<40^{\circ }$
. Interestingly, instead of having only response reduction when considering total sea to split sea, we also observe a significant number of occurrences of response enhancement for
 $\unicode[STIX]{x1D719}>40^{\circ }$
(clashing region). Such response enhancement in the split-sea case can go up to
 $60^{\circ }$
larger than for the total sea case. This corresponds to the case where, even though
 $T_{p}$
for total sea is longer than the machine RAO peak period, the individual wind sea and/or swell
 $T_{p}$
is close to the machine peak RAO period, which generates a larger overall response (resonance excitation) for the split-sea case than for the total sea case. As a result, the probability of machine clashing increases slightly for the split-sea case. Thus, the overall reduction in the response due to the effect of the two peaks in frequency distribution is only marginal, represented on average by the slight reduction in the mean of the hinge angle distribution for the split-sea case, as compared to the total sea case, all with directional spreading.
Comparing the effects of the two components (split sea) being in the same mean wave direction or in different directions, the response in hinge angle is reduced for the different mean directions as the wave direction for swell and wind sea increases. This is purely due to the effect of machine misalignment between the two dominant mean directions. Nevertheless, the largest reduction for
 $\unicode[STIX]{x1D719}>40^{\circ }$
(clashing region) is only
 $13^{\circ }$
, with most of the reduction less than
 $5^{\circ }$
, hence the overall reduction is marginal. In fact, the histograms of both cases are very similar. We further investigate whether this marginal response reduction is genuine, or an artefact due to our conservative approach, by searching for the worst machine orientation. The same statistics are repeated by searching for the best machine orientation instead (which minimizes the total motion response), in which the peak of the hinge angle distribution is shifted towards
 $0^{\circ }$
; however the clashing region is still significant. The average time between clashing increases from 26 h for the worst machine orientation to only 36 h for the best orientation. This demonstrates that for a clashing criterion of
 $\unicode[STIX]{x1D719}>40^{\circ }$
(derived from the present machine configuration), the reduction in response for the clashing region is small when considering lack of alignment of the machine. This also implies that the slow drift yaw motion of the machine is likely to have a negligible effect on survival statistics assuming that the behaviour of the machine is predominantly linear.
6 Discussion and conclusions
This paper has presented a methodology for the analysis of extreme responses and loads of a multi-body system of cylindrical floats with negligible drag effects in severe, though non-breaking, sea states. The particular configuration is that of the WEC M4 without damping at the hinge to absorb energy. Although the motion of the machine is generally close to linear, we have identified locally violent free-surface effects which reduce and limit extreme motions. If any of the floats is overtopped, then there will be a local loss of hydrostatic stiffness and considerable dissipation of energy. This paper presents upper estimates of response in violent sea states. Very large angular displacements of such a system may be accommodated by replacing the straight beam between floats 2 and 3, used in these tests, by one with a ‘dog-leg’ shape. Specifically we find that the system response is remarkably linear, even for large amplitude motions of
 $30^{\circ }$
in hinge angle, with weak nonlinearity in beam bending moment. Following the excitation phase driven by the main wave group, there are locally complex and violent free-surface effects which generally reduce the overall motions. After the main group has moved away, the decaying machine response can be characterised simply by linear radiation damping. There are three types of nonlinear behaviour extracted in the analysis: Stokes-type double and triple frequency motion during the free-vibration phase of the response, double and triple frequency components as the wave group passes by (due to nonlinear hydrodynamic loading), and finally the ‘dunking’ of the central float for very large motions. This provides a strong reduction of the largest motions.
For the Orkney case study with a severe wave climate, we observe that the response is controlled by the steepness of sea states, with asymptotic response for storm
 $T_{p}$
longer than the peak RAO period of the full-scale machine. There is a reduction in the extreme response when accounting for directional spreading, however the reduction is only marginal when accounting for bimodality in frequency (from total sea to split-sea cases) in spread seas. The effect of system misalignment on the extreme response reduction is small in the split-sea case, hence the effect of slow drift yaw motion of the machine appears to be an unimportant parameter. Using a combination of signal analysis and theoretical ideas drawn from Stokes-type expansions to demonstrate both linear and nonlinear hydrodynamics and responses, there is considerable and consistent evidence that ‘dunking’ of a float (the mid float here) in large motions provides a strong restraint on such motions. This implies that the predictions of angular amplitudes up to
 $70^{\circ }$
in limiting severity sea states are unduly pessimistic. However, further work on this is justified.
While this novel analysis has been undertaken for a specific configuration of interconnected cylindrical floats, based on the WEC M4, the methodology may be expected to be valid for other configurations and connectivity since the underlying hydrodynamics is that due to the system of floats. Trivially, the analysis may be expected to be valid for a wholly rigid system (without hinges). It should be stressed that the analysis is for internal response and loads; effects due to mean drift forces, important for moorings and expected to be second order, are not accounted for.
We also demonstrate a general and potentially important reciprocity result for linear body motion in random seas: the averaged wave history given an extreme system response and the average response history given an extreme wave match in time, with time reversed for one of the signals. For sea states with the period of the spectral peak
 $T_{p}$
greater than the period of the machine RAO peak, the reciprocity relationship is particularly striking: with the response given a large wave showing a fast build up followed by a highly oscillatory long tail in time whereas the wave which drives the extreme response has a long gradual build up in time followed by a rapid decay. In contrast to these highly asymmetric signals, the average time history of extreme response in the same sea state is symmetric in time. These relationships are shown in figure 19. This shows both wave and machine response time histories for limiting steepness storms whose spectra are shown in figure 17 (figure 19
a–c for
 $T_{p}=19.5$
s, d–f for
 $T_{p}=15$
s and g–i for
 $T_{p}=11$
s). Figure 19(a,d,g) shows the shape of the most probable maximum wave crests in 3 h for each sea state (
 $\unicode[STIX]{x1D702}_{NW}$
), (c,f,i) shows the most probable maximum response in time (
 $\unicode[STIX]{x1D719}_{NW}$
), again for 3 h in the three sea states. Figure 19(b,e,h) shows the machine response given an input wave group matching the most probable maximum wave in time (
 $\unicode[STIX]{x1D719}_{\unicode[STIX]{x1D702}_{NW}}$
), and also the wave group (with the time axis reversed) which would produce the most probable machine response in time (
 $\unicode[STIX]{x1D702}_{\unicode[STIX]{x1D719}_{NW}}$
). Pairs of the centre columns have identical shape after the direction of one of the time axes is reversed, illustrating the reciprocal nature of
 $\unicode[STIX]{x1D719}_{\unicode[STIX]{x1D702}_{NW}}$
and
 $\unicode[STIX]{x1D702}_{\unicode[STIX]{x1D719}_{NW}}$
. It is striking how different the shapes of the most probable extreme wave time histories are for the three sea states illustrated here. In contrast, the most probable maximum machine response time histories are very similar, showing the importance of both the machine transfer function and the saturated high frequency tails of the sea states in defining these large responses.
Plots of wave and machine response time histories for limiting steepness storms with
 $T_{p}=19.5$
s (a,b,c),
 $T_{p}=15$
(d,e,f) and
 $T_{p}=11$
s (g,h,i). (a,d,g) Shows the shape of the most probable maximum wave crests in 3 h for each sea state (
 $\unicode[STIX]{x1D702}_{NW}$
). (c,f,i) Shows the most probable maximum response in time in 3 h for each sea state (
 $\unicode[STIX]{x1D719}_{NW}$
). (b,e,h) Shows the machine response given an input wave group matching the most probable maximum wave in time (
 $\unicode[STIX]{x1D719}_{\unicode[STIX]{x1D702}_{NW}}$
), and also the wave group (with the time axis reversed) which would produce the most probable machine response in time (
 $\unicode[STIX]{x1D702}_{\unicode[STIX]{x1D719}_{NW}}$
).

This work has shown up the minor limitations of linear theory for the prediction of the motion of the M4 machine (hinge angle
 $\unicode[STIX]{x1D719}<40^{\circ }$
). However, the relatively compact wave group (
 $\unicode[STIX]{x1D702}_{\unicode[STIX]{x1D719}_{NW}}$
), which is predicted to produce the most probable maximum response (
 $\unicode[STIX]{x1D719}_{NW}$
), could be used as a ‘designer wave’, even for more extreme events. Such a wave group could either be created experimentally in a wave tank or simulated numerically in computationally intensive computational fluid dynamics (CFD). The subsequent interaction with either a physical or numerical model of M4 would reveal much more about the violent wave–machine interactions in the severe sea states most important for determining structural survivability. Finally, although presented for the M4 wave energy converter, this approach to ‘designer waves’ may be applicable to a much wider range of other wave–structure interaction problems.
Acknowledgements
We thank Dr R. Gibson now at Offshore Consulting Group and BP Sunbury for providing the wave data and acknowledge support from EPSRC (project EP/J010316/1 Supergen MARine TechnologY challenge and project EP/K012487/1 Supergen Marine Challenge 2 Step-WEC). The Plymouth COAST laboratory provided a high quality facility and technical service. The experimental data for this paper may be accessed on https://www.researchgate.net/project/Experimental-data-for-the-WEC-M4.
Supplementary movie
A supplementary movie is available at https://doi.org/10.1017/jfm.2016.872.



