

Introduction
In October 1954, following the Brown v. Board of Education of Topeka decision, White youth-led protests erupted across the country and bellowed dissent of school integration. Newspaper coverage of these demonstrations shows they were far from peaceful. Black students were beaten by White youth in West Virginia, yet no arrests were made. School Board members resigned in the face of mounting threats of violence. When six schools staged a three-day walk out over planned integration, D.C. law enforcement “kept an eye” on the situation but found no violations of public nuisance laws. When crosses were burned on the lawns of Black elementary schools in Delaware, integration plans were halted.
The following decade, Black youth protested ongoing discrimination and segregation of public schools. Unlike their White counterparts, their movements were met with police violence and strict law enforcement. Youth were harassed, assaulted, and arrested, and school policing infrastructures were quickly constructed in school districts across the nation. This dichotomy between the state response to White and Black youth protest shows not only a reflection of the state’s willingness to repress Black dissent through existing means but also the ability of the state to construct brand new policing infrastructures to suppress Black youth through policing and criminalization.
Though the protests eased, police remained. Over the past several decades the school policing apparatus has swelled to place most students in the United States under law enforcement supervision inside school settings. During the 2021-2022 school year, sixty-one percent of public schools had one or more school police officers stationed at the school at least once a week, with forty-five percent of those officers routinely carrying a firearm while on duty (de Bray and Donaldson, Reference de Bray and Donaldson2022). Youth in high schools are far more likely to encounter school police, with just over eighty-two percent of secondary and high schools routinely stationing police on campus compared to slightly less than fifty percent of elementary schools stationing an officer (de Bray and Donaldson, Reference de Bray and Donaldson2022). Considering the deep racial disparities in how youth interact with police in their schools (Meiners Reference Meiners2011), the harms that stem from school policing (Johnson and Whittenberg, Reference Johnson and Whittenberg2024), and how schools have, and continue to be, sites of policing and social control (Meiners Reference Meiners2016), it is crucial to ask the question: when and why were police stationed in schools?
Our examination of the context leading up to the creation of school police offers an answer rooted in racist institution building. Specifically, we show that school policing was created during a period of intense racial contention in the country; racial demographics of the country were quickly changing, Black people were able to state their demands through protest and made some meaningful progress toward racial equality. In examining historical events preceding the establishment of policing infrastructures, we detail how local school districts and White-dominated power structures responded to demands for education equity from Black youth by implementing punitive school policing structures. Shifting the attention from when school policing expanded in the 1980s and 1990s to examining the context under which school policing was created, we draw attention to the role of racism in carceral institution building and policy making.
Defining School Policing
The first issue in locating the origins of school policing is being able to concretely define the term. School policing can be defined anywhere along the spectrum from formalized school police departments to the various punitive policies in a school setting. The practice of school policing has been defined as attempts to “identify and discipline constructed traits of delinquency in an educational setting” (Burton Reference Burton2017, p. 533). Similarly, social justice advocates working to abolish school policing have defined it as the act of utilizing law enforcement, surveillance, and information sharing in school-related settings to identify and enforce violations of criminal law and refer students to the youth and adult justice systems (Advancement Project 2023). We agree with these comprehensive definitions that implicate a wide range of actors contributing to student criminalization, including law enforcement officers, school security guards, and school staff that refer students to the youth and adult law enforcement systems.
However, we limit the definition of school policing to scenarios where law enforcement officers with legal authority to arrest are placed in schools to enforce criminal laws against students and other members of the school community. This definition of school policing is a higher bar than the wide range of punitive policies and practices used by social justice advocates, focusing on the assignment of law enforcement officers to school campuses. This includes officers assigned by the school district directly and officers assigned by local law enforcement agencies. The latter being the most common model of school policing in the United States, with over eighty percent of sworn school resource officers (SROs) come from local police or sheriffs’ offices (Davis Reference Davis2023). As we are studying the timing and justifications for placing police in schools, this definition allows us to accurately quantify the assignment of police to schools across contexts.
Existing Accounts of the Origins of School Policing
There is a growing body of literature that documents the proliferation and causes of punitive policies across the United States. Here, we focus on four areas of scholarship that offer guidance in understanding the genesis of school policing: case studies on school policing, changing racial demographics, the fabricated fear and criminalization of Black youth, and federal programs aimed at strengthening the punitive arm of the state. We posit that, collectively, these components provide the necessary context to understand the origins of school policing across localities.
Case Studies on School Discipline and Policing
There are several works on the origins of school policing that focuses on case studies in individual cities. In a historical case study of zero-tolerance policies in Los Angeles from 1950 to 1970, Judith Kafka (Reference Kafka2011) shows the evolution of zero-tolerance policies, relating it to policy debates about urban youth, violence, and the role of the school in controlling youth behavior. Araceli Centanino (Reference Centanino2021), also focusing on the history of disciplinary policies and policing in Los Angeles Schools, finds that schools serving Black and Chicanx students became indistinguishable from other carceral institutions.
In examining the origins of school policing in Philadelphia in the 1960s, Kyle Bredell (Reference Bredell2013), shows that the Philadelphia Security Program was developed at the call of White parents seeking protection from Black students inside schools following integration and Black student protests. Similarly, Aaron Fountain Jr. (Reference Fountain2022) finds that as Black student rights expanded in the San Francisco Bay Area in the 1960s, so too did the presence of police and other security measures on school campuses.
In her broad examination of police violence and Black Rebellion Elizabeth Hinton (Reference Hinton2021) finds that school policing infrastructures were developed following Black student-led protests in Harrisburg, Pennsylvania. Hinton notes that the outburst of protests in the school were not indicative of widespread criminality, but rather reactions to “unequal educational and socioeconomic conditions” (p. 149). The state’s reliance on law enforcement mechanisms, instead of meeting Black student demands, illuminates the desire of the state to maintain and defend the exiting racial order.
The focus on specific locations is vital to understanding the very localized factors that led to the creation of school policing. Yet, most of the factors that have been highlighted are present beyond these case studies: an increase in the Black population, the criminalization of Black youth, and increased dissent of Black youth can be found in almost every U.S. city. A question still unanswered is whether we can locate generalizable trends that lead to the creation of school police across geographies.
Demographic Change
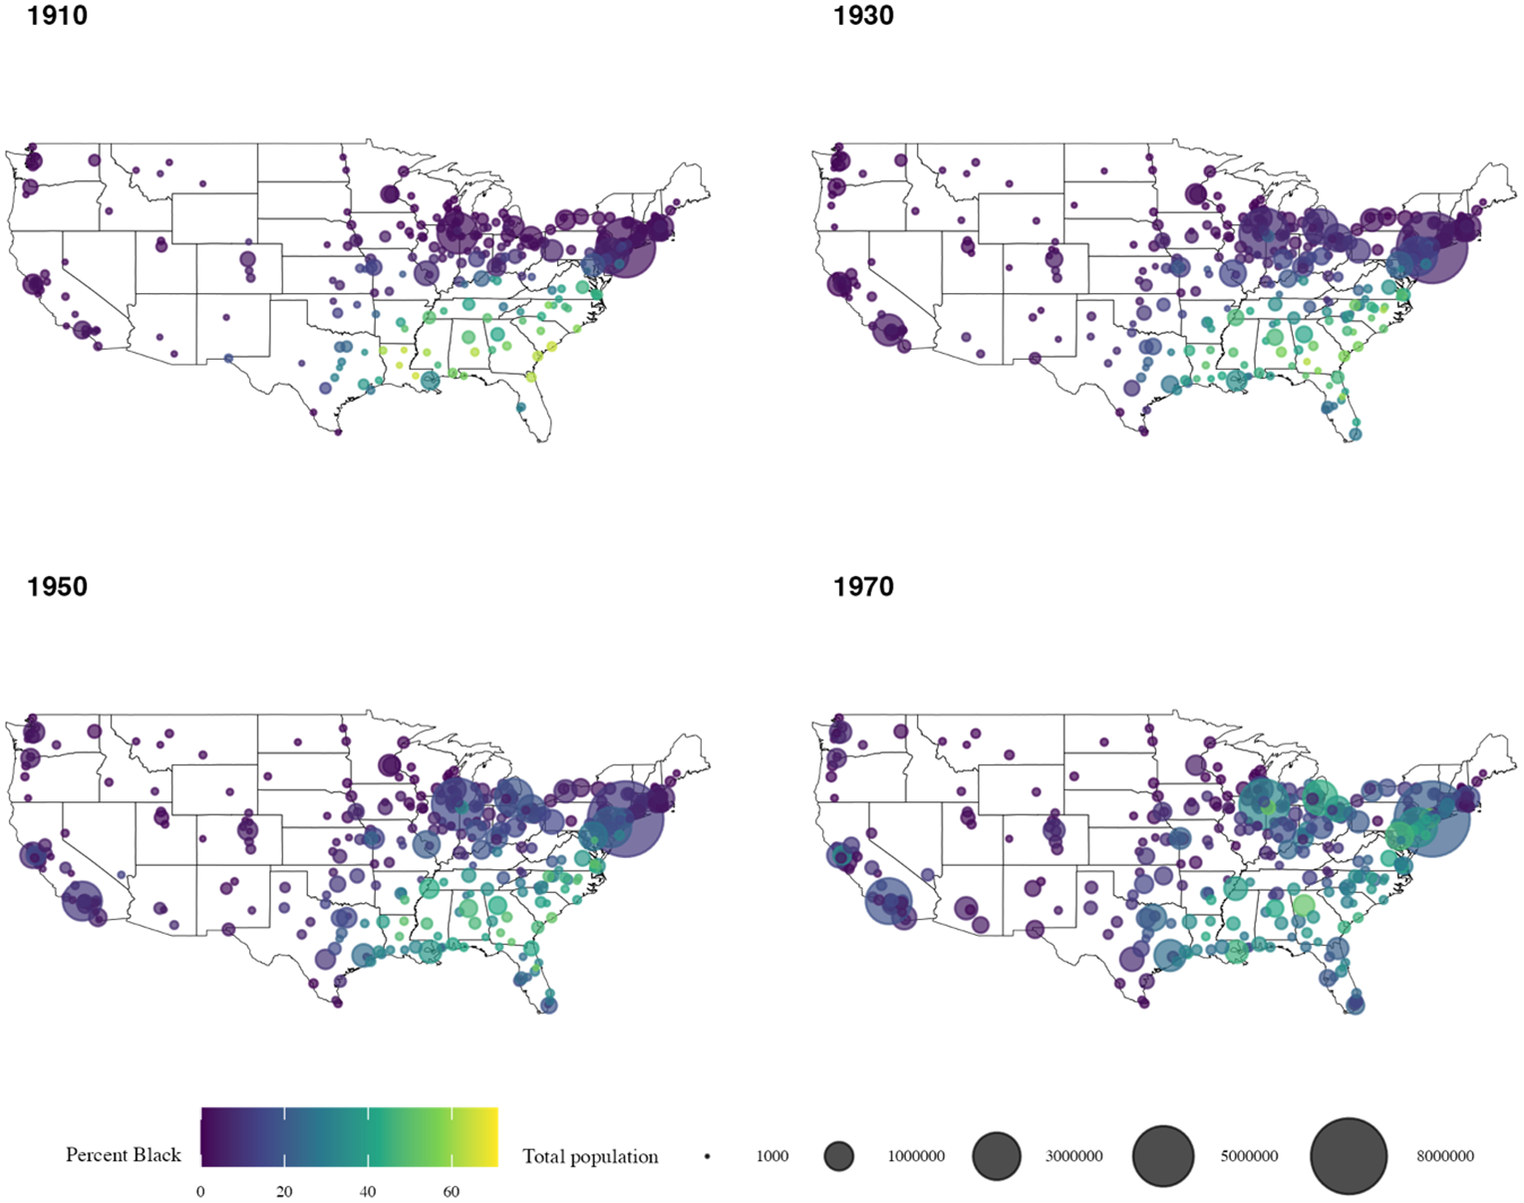
The Great Migration dramatically altered the demographic makeup of cities throughout the country and brought with it ongoing racial tensions. Black people uprooted their lives and looked northward for the promise of gainful employment, access to educational opportunities, and an escape from Jim Crow laws and the racial violence of the South. An estimated six million Black people fled the South between 1910 and 1970 during the Great Migration, representing one of the largest internal movements of people in the history of the United States. Figure 1 shows the Black population in U.S. cities from 1910 to 1970. The size of city population is indicated by the size of the circle, and the percent of the city population that is Black is indicated by the color scale, ranging from a zero Black population in purple to a 100 percent Black population in yellow.
Black populations in cities, 1910–1970
Data from IPUMS USA data extracts, University of Minnesota.
Each map includes cities with a population of at least 1,000.

Figure 1. Long description
From the top-left panel (1910), most large circles are concentrated in the Northeast and Midwest, with smaller circles in the South and West. Circle color is mostly purple, indicating low percent Black, except for some green and yellow circles in the Southeast. In the top-right panel (1930), circle sizes increase in the Northeast and Midwest, and more cities in the South show higher percent Black populations, with more green and yellow hues. In the bottom-left panel (1950), circle sizes further increase in the North and West, and more cities in the Midwest and West appear, with some showing higher percent Black populations. In the bottom-right panel (1970), large circles are prominent in the Northeast, Midwest, and now also in California and the South, with more cities showing green and yellow colors, indicating higher percent Black populations. The color bar at the bottom shows percent Black from 0 (purple) to 60 (yellow), and the legend at the bottom right shows circle sizes representing total population from 1,000 to 8,000,000.
The first wave of the Great Migration, beginning in 1910, saw Black people from the South move to cities in the North and Midwest. The second wave of the Great Migration was driven by employment needed to support World War Two and involved southern Black people moving primarily to cities in the Northeast, Midwest, and Western United States. Although most of the movement involved Black people leaving the South, a significant amount of Black people moved within the South and urbanized Southern cities. Here, we saw the movement of Black people from rural areas to major metropolitan centers, including Atlanta, New Orleans, and Dallas.
With changes in the racial makeup of urban areas came racial tensions and increased support for punitive policies to maintain existing social orders (Murch Reference Murch2010; Thompson Reference Thompson1999). In explaining this dynamic, racial threat theory highlights the relationship between the size or growth of an out-group and the preferences of the majority group and holds that when there is an increase in the size of the out-group, the majority group will feel threatened and will use their disproportionate power to advocate for state-sanctioned social control. Hubert M. Blalock (Reference Blalock1967) identifies three distinct forms of racial threat: economic, political, and symbolic threat, with each type of threat increasing support for state-sanctioned social control to maintain the White power structure. Blalock and other proponents of racial threat theory argue that the most reliable measure of threats is the relative percentage of the non-White population or out-group and the preferences of the majority group, with some defining the threshold for racial threat at around twenty to thirty percent (Kent and Jacobs, Reference Kent and Jacobs2005; Stults and Baumer, Reference Stults and Baumer2007).
The theoretical underpinnings and measurements used to assess racial threat theory have met growing criticism. Chief among these critiques is that there are assumptions that the in-group has homogenous preferences, the size of a group alone dictates political power, and that policymakers are likely to appease the in-group even if it goes against the preferences of the out-group (Filindra Reference Filindra2019). Implicit in these critiques is the assumption that there must be a real threat posed to the in-group by the out-group. Therefore the “threat” is better understood as a threat to the status quo, rather than a real and substantiated threat to the political position of the dominant group.
Fear and Criminalization of Black Youth
One implication of changes in racial demographics is the fabricated fear of Black people in formerly White-dominated areas, specifically through media framing, which is used to increase support for punitive policies. Stuart Hall and colleagues’ (Reference Hall, Critcher, Jefferson, Clarke and Roberts1978) pioneering work on law-and-order policies in Britain during the 1970s explains that, absent a real rise in crime, the “mugging crisis” can only be understood within the context of the threat to hegemony of the political leadership and ideological domination of British society. As economic conditions changed and workers and non-White people gained political power, the government resorted to force to maintain hegemony. Using the fabrication of the Black mugger, the White British establishment was able to bolster support for law-and-order policies aimed at Black youth. Similarly, in her work on the Black Panther Party in Oakland, Donna Murch (Reference Murch2010) shows that the influx of Black people to the city during the 1950s caused anxiety and hypervigilance of “delinquent” Black youth and subsequent branding of them as “troublemakers” and using that as the justification for disciplinary policies targeted toward Black youth.
In line with this approach, some have used moral panic as a framework to understand the rise in stricter school disciplinary policies in the late 1980s (Burns and Crawford, Reference Burns and Crawford1999). Moral panic occurs when a condition or group of people are labeled evildoers and “defined as a threat to societal values and interests” in a stereotypical manner by mass media, politicians, and other moral entrepreneurs—leading to punitive, knee-jerk changes to law and policy (Cohen Reference Cohen1972). Teachers’ unions, public officials, and the public at large united around punitive and carceral responses (e.g., more police in schools, mandatory referrals to law enforcement, metal detectors, and zero-tolerance policies) that were not proportional to actual rates of youth violent crime (Burns and Crawford, Reference Burns and Crawford1999).
One striking example of moral panic is the rise of the “superpredator” narrative, which was created and popularized by a professor of political science and called attention to a “new breed” of youth offenders who “have absolutely no respect for human life and sense for the future” (DiIulio Reference DiIulio1995, p. 23). The narrative was further bolstered by James Q. Wilson and several other scholars, warning of the rampant crime that would sweep the nation (see Gottfredson and Hirschi, Reference Gottfredson and Hirschi1990; Kelling and Wilson, Reference Kelling and Wilson1982). The rise in youth violent crime was never actualized, yet this did not halt the proliferation of media coverage depicting Black youth as thugs and gang members playing into readers’ fears (Gest and Pope, Reference Gest and Pope1996).
Federal Policies
Several works exploring the development of school policing have focused on policy making at the federal level, arguing that a new model of governance emerged in the 1970s amid a weakening economy, widespread critiques of public services, rising concerns over youth delinquency in the 1960s, and the contentious racial politics of the period (Hirschfield Reference Hirschfield2008; Simon Reference Simon2006). Focusing on legal victories in the 1960s and 1970s, Richard Arum (Reference Arum2003) shows that conservative law makers used crime control and increased school policing to counteract the expansion of students’ rights that followed legal rulings which brought school disciplinary policies under the protection of constitutional due process. This limited the authority and discretion of school officials by restricting the arbitrary use of exclusionary discipline (Arum Reference Arum2003, Hirschfield Reference Hirschfield2008).
Scholars of school disciplinary policies have shown that the inception of zero-tolerance policies in the 1980s were intended primarily to deliver the message that certain behaviors would not be tolerated (Skiba and Peterson, Reference Skiba and Peterson2000). These policies were one part of the larger tough-on-crime policies of the 1990s and were extended to schools amid fears of youth crime, school shootings, and gang violence (Casella Reference Casella2001; Kafka Reference Kafka2011; Stetzner Reference Stetzner1999). By the end of the 1980s, zero-tolerance policies were introduced across the country and entered the national arena with the Drug Free Schools and Communities Act of 1986, the Gun Free Schools Act of 1994 (Skiba and Peterson, Reference Skiba and Peterson2000), and programs like the Office of Community Oriented Policing Services, which provided almost $715 million in funding for school resource officers between 1999 and 2005 (Office of Community Oriented Policing Services 2004). Despite the decline in crime in public schools (DeVoe et al., Reference Devoe, Ruddy, Miller, Planty, Snyder, Peter, Duhart and Rand2002), schools increasingly adopted strict sanctions purportedly designed to deter violence in schools, which has been largely found to be in response to fears as opposed to substantiated danger (Addington Reference Addington2009; Smith Reference Smith2015).
Missing from these federal-level explanations of federal support of school policing infrastructures is the central role of racism in punitive policy making and institution building. In proposing a racialized explanation for the adoption of punitive policies within the criminal legal system at the federal level in the 1970s, Vesla Weaver (Reference Weaver2007) offers a theory of “frontlash”, which states that formerly defeated groups develop a countermovement to reorient the agenda on racial equity. Using the example of the victories of the Civil Rights Movement, including the Civil Rights Act of 1964, fair housing legislation, and the federal enforcement of school integration, Weaver shows that opponents of civil rights spurred a powerful countermovement of elites that placed the problem of crime, as a proxy for race, at the front of the policy agenda. Weaver argues that the reaction to the real victories granted to the Black population became embedded in the separate crime policy formation. Though not explicitly referencing school policing, the concept of frontlash offers a helpful framework to understand state actions in response to civil rights gains and Black freedoms.
Focusing on large federal policies aids our understanding of pivotal moments in the development of punitive policy making. However, focusing on legislative and legal processes at the national level overlooks the context in which decisions around school administration and policing are made, as these decisions are largely made by local government agencies responding to local pressures.
The Origins of School Policing: A Generalizable Theory
We build upon the aforementioned research by focusing on the broad and interweaving trends leading up to the creation of school policing. We show that, following the Great Migration, Black youth became emboldened to demand equal access to education, either through actively demanding school desegregation or equal resources for Black-centered education. In some cases, their calls were successful, and school districts responded by integrating public schools. Where schools did manage some level of integration, White parents and local officials became incensed at the prospect of Black students attending their children’s school and called for police to be stationed on school grounds. In cases where integration was successfully halted, or where schools were integrated yet conditions were still subpar for Black students, police were placed in Black schools to suppress further demands for educational equity (i.e., more Black educators or culturally affirming curriculum).
While our primary focus is the state’s response to Black youth, we should note that punitive state responses are not exclusive to Black bodies. Definitions of ‘out-groups’ depend on context, and state violence has targeted other racially subjugated groups (Estes et al., Reference Estes, Yazzie, Denetdale and Correia2021; Cacho Reference Cacho2012; Sampaio Reference Sampaio2015). Notably, in our Los Angeles case study, we show how the growing Mexican American student population and enforced desegregation between Mexican American and White American students directly led to the creation of school policing in Los Angeles public schools.
A Methodological Note
We take a multi-modal historical approach (Lewis IV Reference Lewis2025) to understand the context leading up to the creation of school policing in metropolitan areas. Adopting a multi-modal historical method allows us to leverage our training as a social scientist and a movement lawyer with extensive experience in the field to enhance the study of the creation of carceral institutions. To examine the conditions that led to the creation of school police in a specific area, we use a combination of government-sourced crime data, demographic data, historical school enrollment data, and archival data from newspapers and government documents. We also closely examine when police were stationed in schools through case studies of geographically diverse cities to show similar trends, regardless of location. This approach allows us to more holistically capture the sociopolitical context leading up to the creation of school policing, rather than focusing on a singular factor or geographic region.
Origins of School Policing: An Aerial View
We begin by examining precursors to the origin of school policing across cities by addressing specific factors that have been shown to play some role in punitive policy-making: crime rates, migration of Black bodies, Black youth protest, and school integration.
National Youth Crime Rates
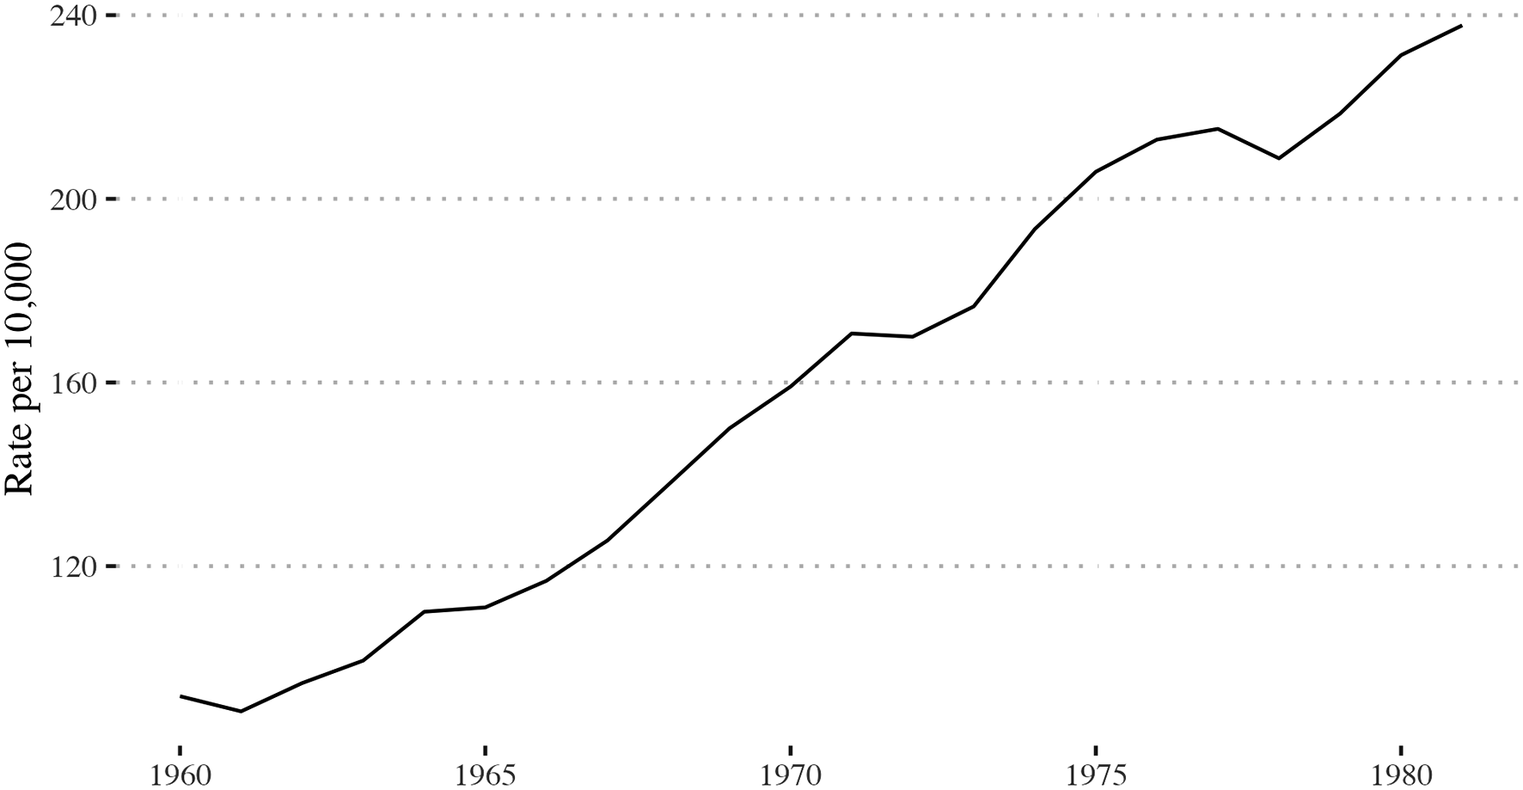
Proponents of school policing often cite the rise in youth crime rates as the catalyst for school policing and zero-tolerance policies. Although they are correct that there was a rise in the youth crime rate in the years preceding the expansion of school policing at the national level, an over-reliance on the crime rate fails to consider whether reported crime increases because of racialized policymaking (Weaver Reference Weaver2007) and the local contexts in which police were assigned to schools. Figure 2 shows the youth crime rate from 1960 to 1981, per 10,000 youth aged five to seventeen.
Youth crime rate, 1960–1981
Data from Office of Juvenile Justice and Delinquency Prevention (2020).
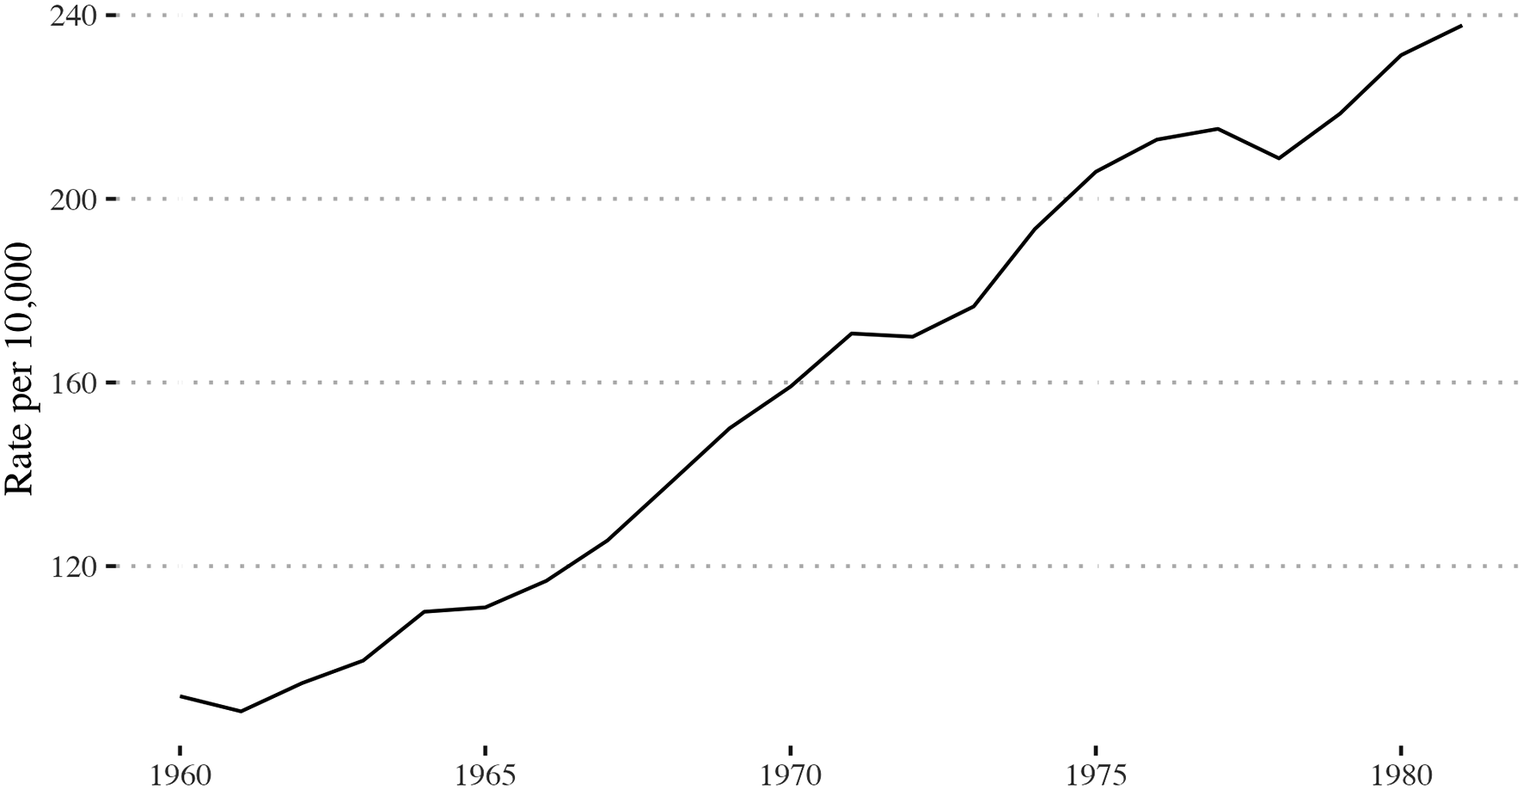
Figure 2. Long description
The x-axis displays years from 1960 at the left to 1981 at the right. The y-axis is labeled rate per 10,000, with tick marks at 120, 160, 200, and 240. The line starts just above 100 in 1960, rises gradually through the 1960s, reaching about 120 by 1965, then increases more sharply, crossing 160 around 1970. The upward trend continues, with the rate surpassing 200 by the mid-1970s. After a brief plateau, the line resumes its rise, peaking near 240 by 1981. The overall trend is a consistent increase in youth crime rate over the period.
Setting aside issues with crime data, including data fabrication and difficulties gauging accurate levels of crime (Piston et al., Reference Piston, Johnson, Hedlund and Walker2025; Weaver Reference Weaver2007), the youth crime rate increased throughout the 1960s and 1970s. In 1960, when data became available, the youth crime rate was just over ninety-one per 10,000 youth in the United States. The rate dipped slightly in 1961 and then rose steadily over the next two decades, mirroring the adult crime rate during the same period. However, we must highlight two important caveats. First, juvenile crime rates disaggregated by crime type are not available for earlier periods, so there is no way to determine whether and to what extent these crimes were school-related. Second, youth crime was rising nationally for almost a decade before it was used to justify assigning police to schools. Therefore, national increases in juvenile crime rates alone likely do not explain why major Black migration cities started school policing programs in the 1960s. More insight can be gained by examining the broader context of events leading up to the implementation of school police in each city.
The Great Migration and Sensationalized Fears of Black Bodies
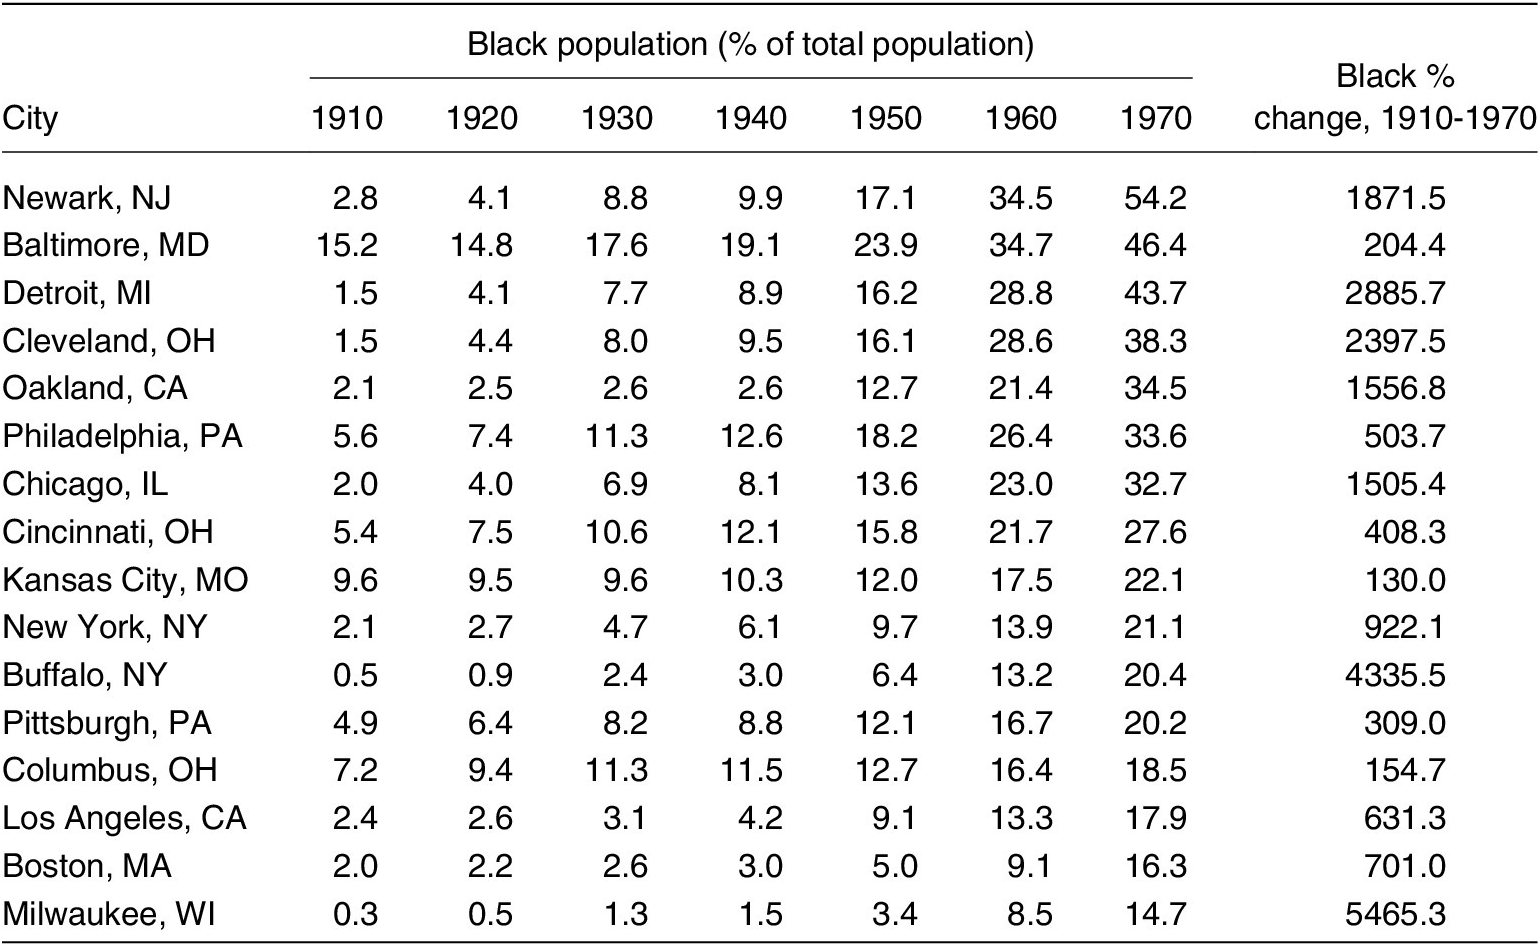
The Great Migration fundamentally changed the demographic compositions of cities across the country, turning cities from predominantly White to increasingly Black. To examine where and when these Black metropolis hubs emerged, we define large Black migration cities (BMCs) as those with at least a population of 300,000 in 1970, with at least a fourteen percent Black population in 1970, and with a percentage change of at least 100% in the Black population from 1910 to 1970. This selection criterion leaves sixteen cities, displayed in Table 1 and presented in descending order by the Black population percentage in 1970.
Large Black Migration Destination Cities
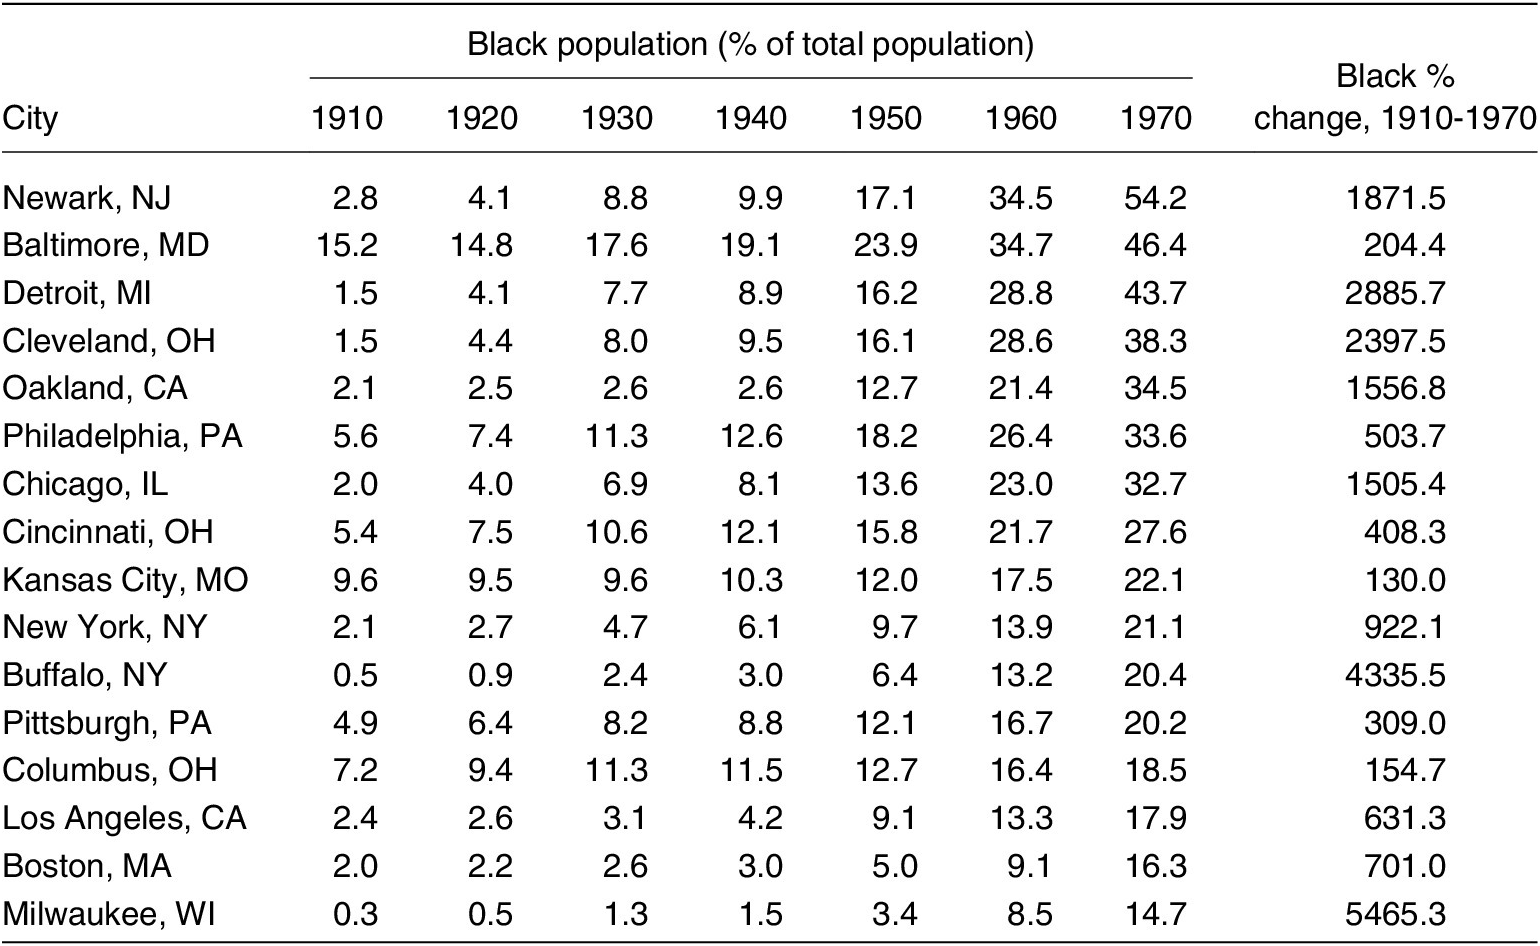
Table 1. Long description
The table lists 16 U S cities in the first column: Newark N J, Baltimore M D, Detroit M I, Cleveland O H, Oakland C A, Philadelphia P A, Chicago I L, Cincinnati O H, Kansas City M O, New York N Y, Buffalo N Y, Pittsburgh P A, Columbus O H, Los Angeles C A, Boston M A, Milwaukee W I. Columns from left to right show black population as a percentage of total population for the years 1910, 1920, 1930, 1940, 1950, 1960, and 1970, followed by the percent change from 1910 to 1970. For example, Newark N J increases from 2.8 percent in 1910 to 54.2 percent in 1970, a 1871.5 percent change. Detroit M I rises from 1.5 percent to 43.7 percent, a 2885.7 percent change. Milwaukee W I shows the largest percent change, from 0.3 percent to 14.7 percent, a 5465.3 percent increase. Buffalo N Y also shows a large increase, from 0.5 percent to 20.4 percent, a 4335.5 percent change. Most cities show a steady increase in black population percentage across the decades, with the largest growth occurring after 1940. The source is I P U M S U S A data extracts, University of Minnesota.
Data from IPUMS USA data extracts, University of Minnesota.
Some cities experienced relatively modest changes. Kansas City, MO, and Columbus, OH, saw 130 percent and 156.9 percent increases in the Black population, respectively, from 1910 to 1970. Other cities, such as Milwaukee, WI, and Detroit, MI, experienced dramatic increases. Their Black populations increased by just over 5,400 and 2,800 percent between 1910 and 1970, respectively. All the BMCs in the 1970s were outside of the South, except for Baltimore, MD, which is located below the Mason-Dixon line.
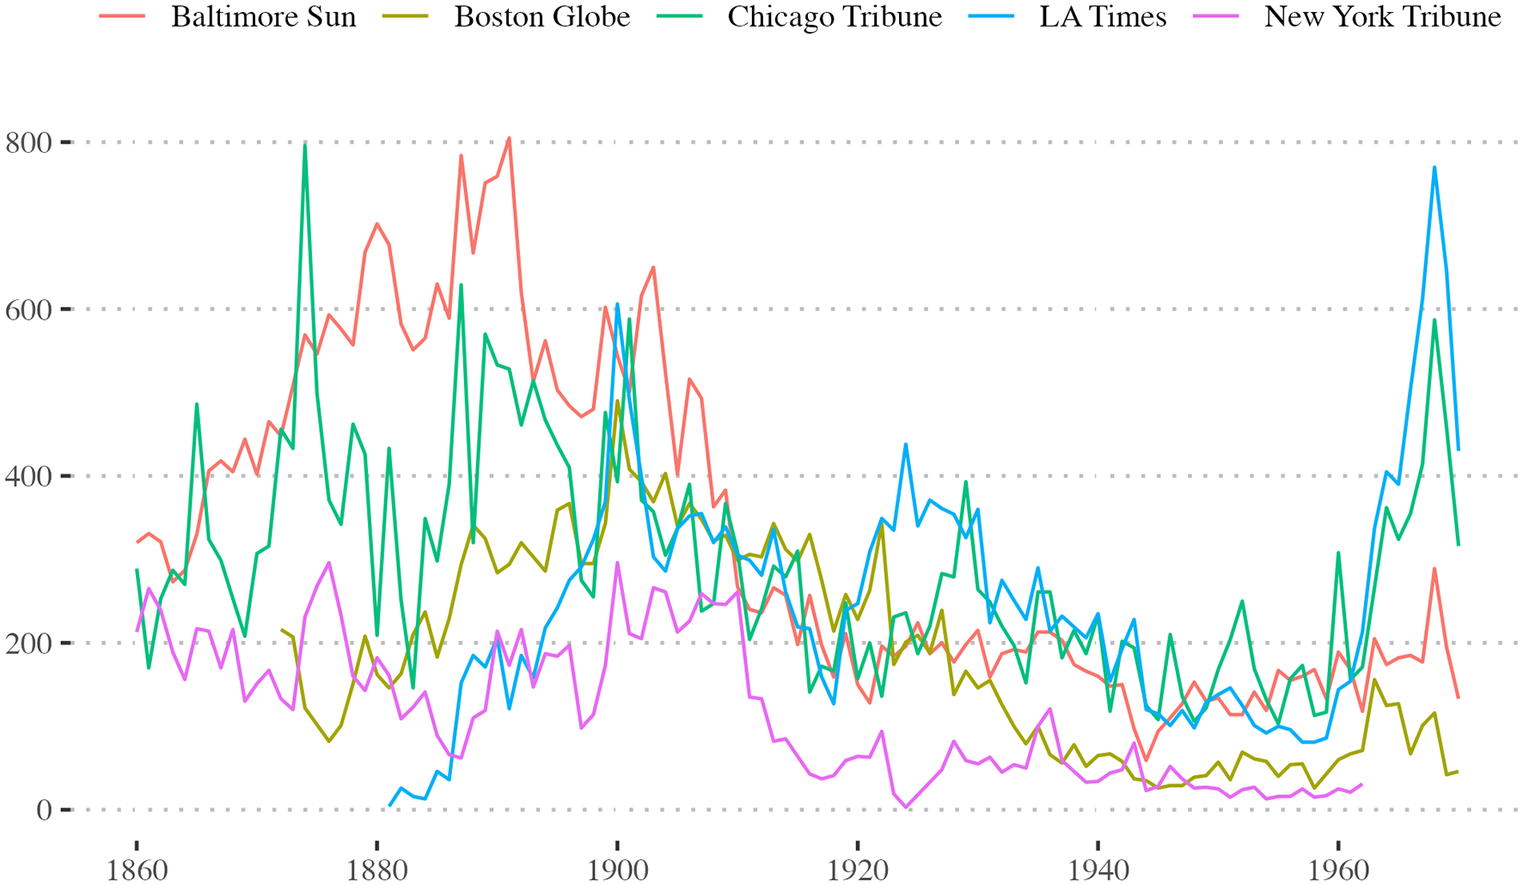
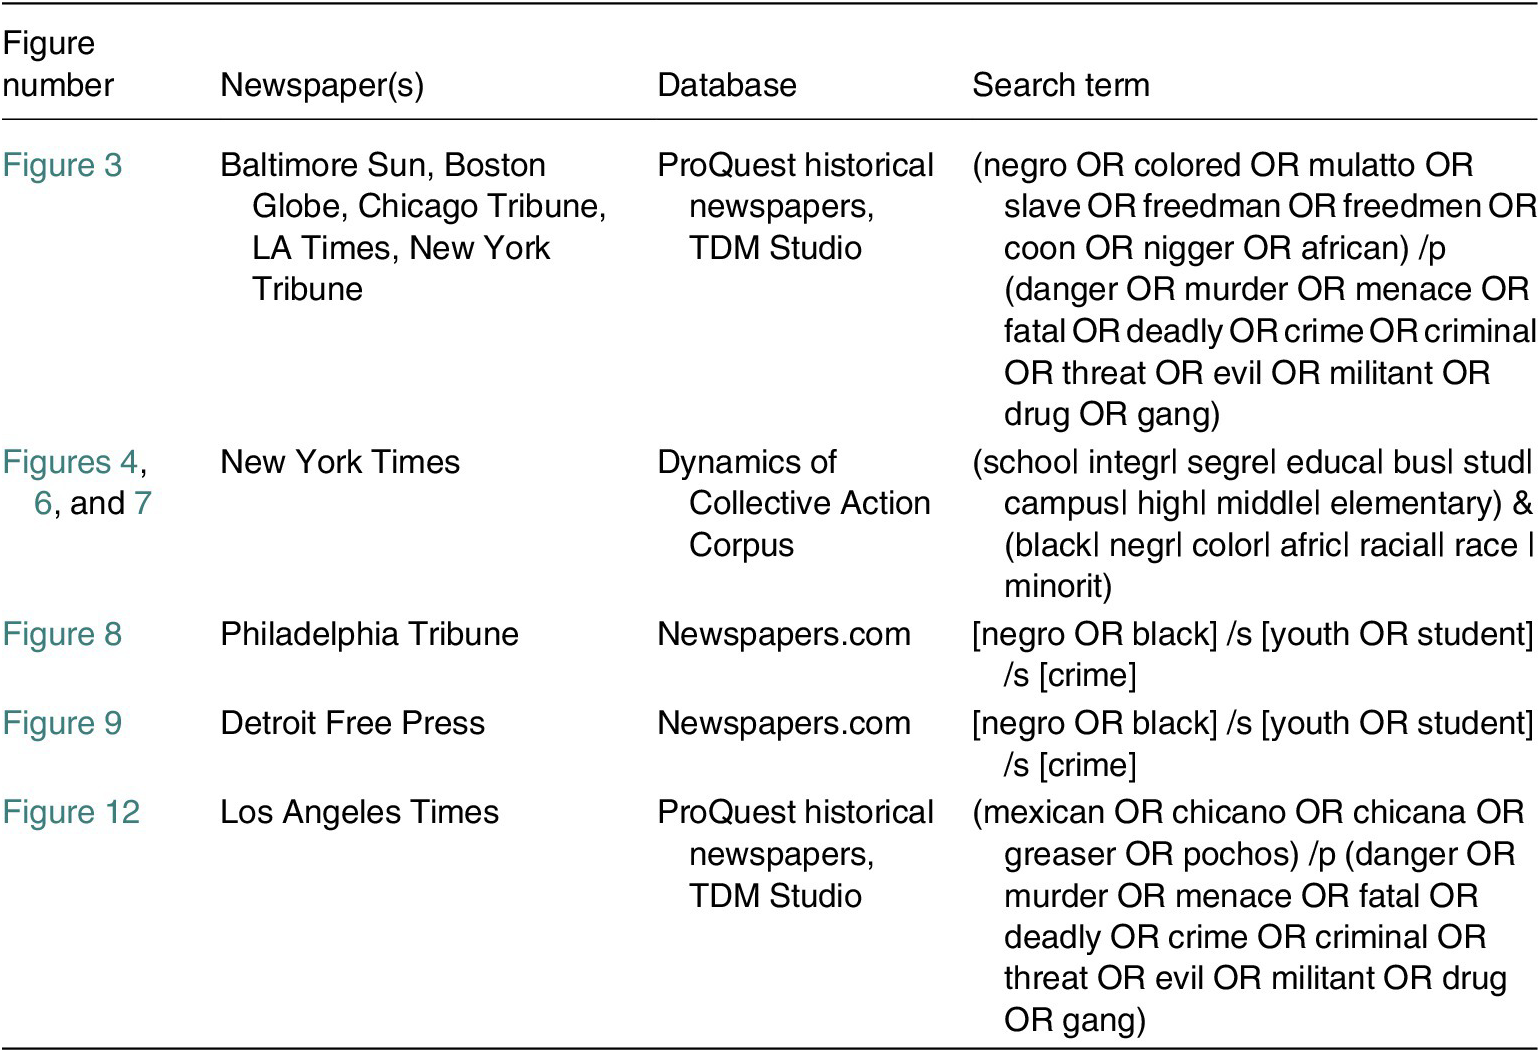
The increases in the Black population were usually coupled with sensationalized media coverage portraying Black bodies as inherently violent and dangerous (Gregory Reference Gregory2005). To explore this, we constructed a search term that captures the number of articles that framed Black people as dangerous in historical newspaper coverage between 1860 and 1970, confirming an increase in negative media coverage during periods of expanded Black freedoms. Figure 3 shows an increase in negative Black media coverage during the abolition of slavery, a small increase around the time of the Great Migration, and again during the Civil Rights Movement.
Black danger framed newspaper articles, 1860–1970
Data from TDM Studio, search terms are provided in Appendix A.
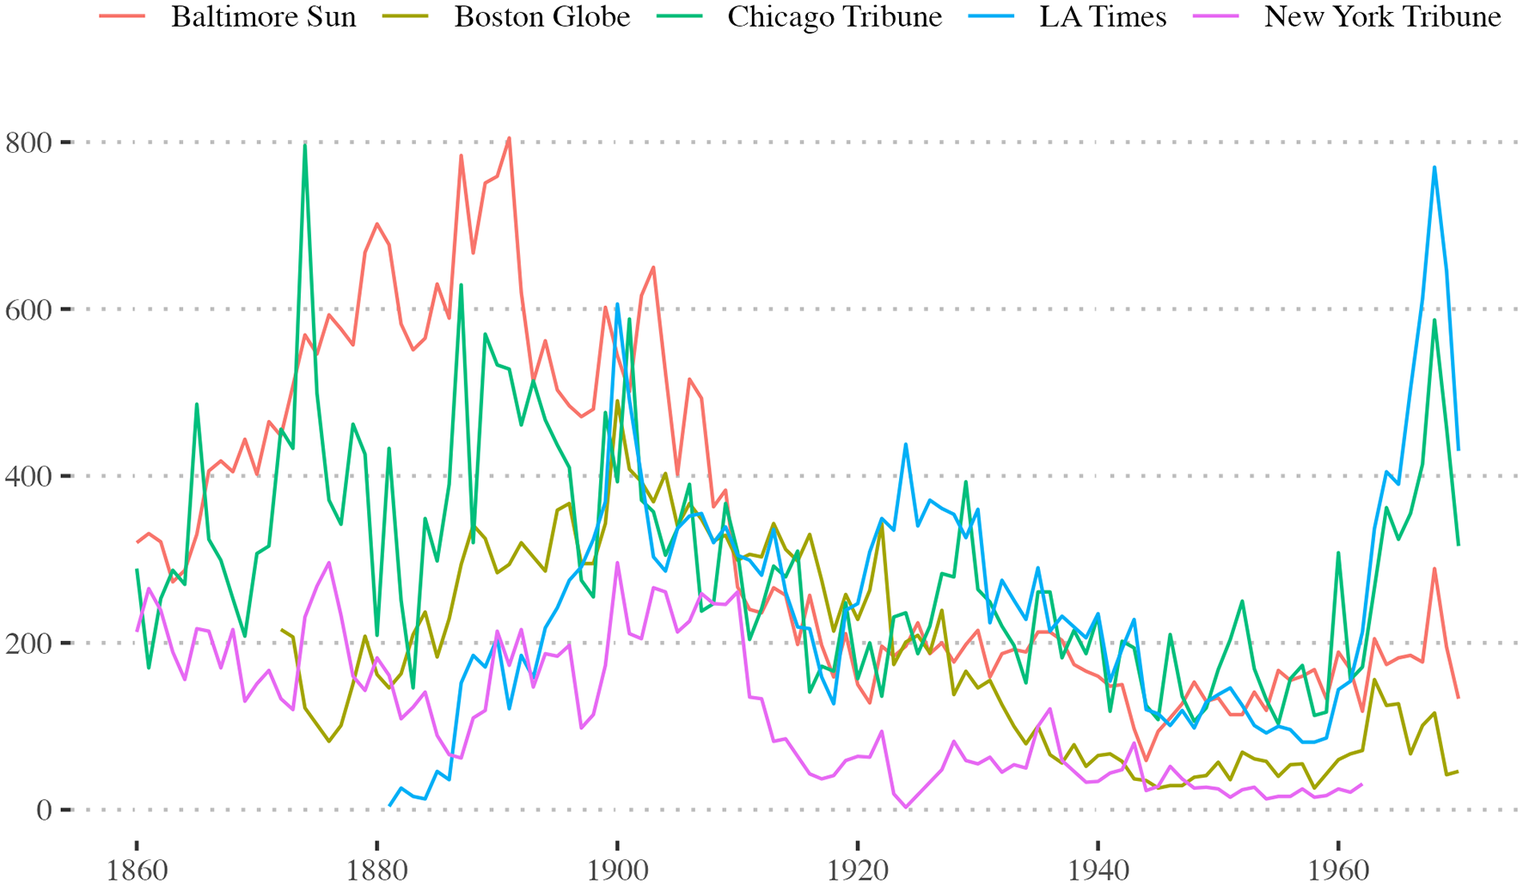
Figure 3. Long description
A line graph with the horizontal x-axis representing years from 1860 to 1970 and the vertical y-axis representing frequency counts from 0 to 800. A legend at the top identifies five newspapers: Baltimore Sun (red), Boston Globe (olive), Chicago Tribune (green), L A Times (blue), and New York Tribune (purple).
* The Baltimore Sun (red) starts at approximately 300 in 1860, peaks near 800 around 1890, and gradually declines to around 150 by 1970.
* The Chicago Tribune (green) shows high volatility, with a major peak of 800 around 1875, followed by several smaller peaks between 400 and 600, before rising sharply again to nearly 600 in the late 1960s.
* The Boston Globe (olive) begins around 1870, maintains a lower frequency between 100 and 400, and ends near 50 in 1970.
* The New York Tribune (purple) fluctuates between 100 and 300 from 1860 to 1910, then drops significantly, staying below 100 for most of the period after 1920.
* The L A Times (blue) begins around 1880, remains low until 1900, then shows a steady presence with a massive spike reaching nearly 800 around 1968.
Although Black people were fleeing the South to escape racial violence and subjugation, their destinations were still rife with racial discrimination. Local White power structures limited Black freedoms across several dimensions to maintain dominance and preserve hierarchies. Black people who fled to cities outside of the South were met with residential segregation (Leibbrand et al., Reference Leibbrand, Catherine Massey, Genadek and Tolnay2020; Massey and Denton, Reference Massey and Denton1998) caused by housing discrimination (Massey and Denton, Reference Massey and Denton1998), redlining (Rothstein Reference Rothstein2017), restrictive covenants (Jones-Correa Reference Jones-Correa2000), and White flight. Additionally, racial disparities in northern incarceration rates (Muller Reference Muller2012) and punitive policies (Weaver Reference Weaver2007) increased during this period. Though BMCs were upheld as progressive havens from southern school segregation, both waves of the Great Migration increased segregation in northern schools and triggered enduring fights for racial and educational equity (Douglas Reference Douglas2005).
Demanding School Equity
Unlike in the South, Black resistance didn’t carry the same dangers in BMCs. Although lynchings have been identified in all but five states across the country, ninety-seven percent of lynchings occurred in Southern states (Seguin and Rigby, Reference Seguin and Rigby2019). Those brave enough to resist the White supremacy of the South could expect to be shot, have their houses burned down, lose their jobs, and have their communities violently targeted (Payne Reference Payne1995). Absent the imminent fear of deadly violence, Black people in BMCs were more empowered to make public demands in the form of protest.
Black Student-Led Protests
The 1960s were a time of intense protest across the country. Schools in particular became hotbeds for political demonstrations as students protested for and against a wide range of civil and human rights issues, including an end to apartheid in South Africa and the Vietnam War; Black self-determination and representation; integration and equal educational opportunity; gay rights; environmental justice; and women’s rights. Two of the most active student organizations throughout the 1960s were the Students for a Democratic Society (SDS), which had approximately 300 chapters on college campuses (van Dyke Reference van Dyke1998), and the Student Nonviolent Coordinating Committee (SNCC), which grew to have seventy-eight Friends of SNCC Chapters by 1965 (Payne Reference Payne1995).
Although much of the research examining school-based protests focuses on college campuses, beginning in the 1960s, high schools were a key site for student protests in favor of school integration and improved educational conditions for Black students (Fountain Jr. Reference Fountain2025; Hyres Reference Hyres2026; Rury and Hill, Reference Rury and Hill2013). The National Association for the Advancement of Colored People (NAACP) spearheaded a campaign for school integration in the North beginning in the early 1940s (Burkholder Reference Burkholder2021). Although there were pockets of successful integration efforts in the North, desegregation campaigns were generally prolonged fights that relied on protests, boycotts, and other forms of civil disobedience to pressure school districts to integrate. In Northern cities, tens of thousands of high school youth participated in protests and boycotts to pressure local governments to desegregate school systems (Rury and Hill, Reference Rury and Hill2013). In the South, Black students were often called to participate in actions organized by larger organizations such as SNCC and the NAACP (Rury and Hill, Reference Rury and Hill2013).
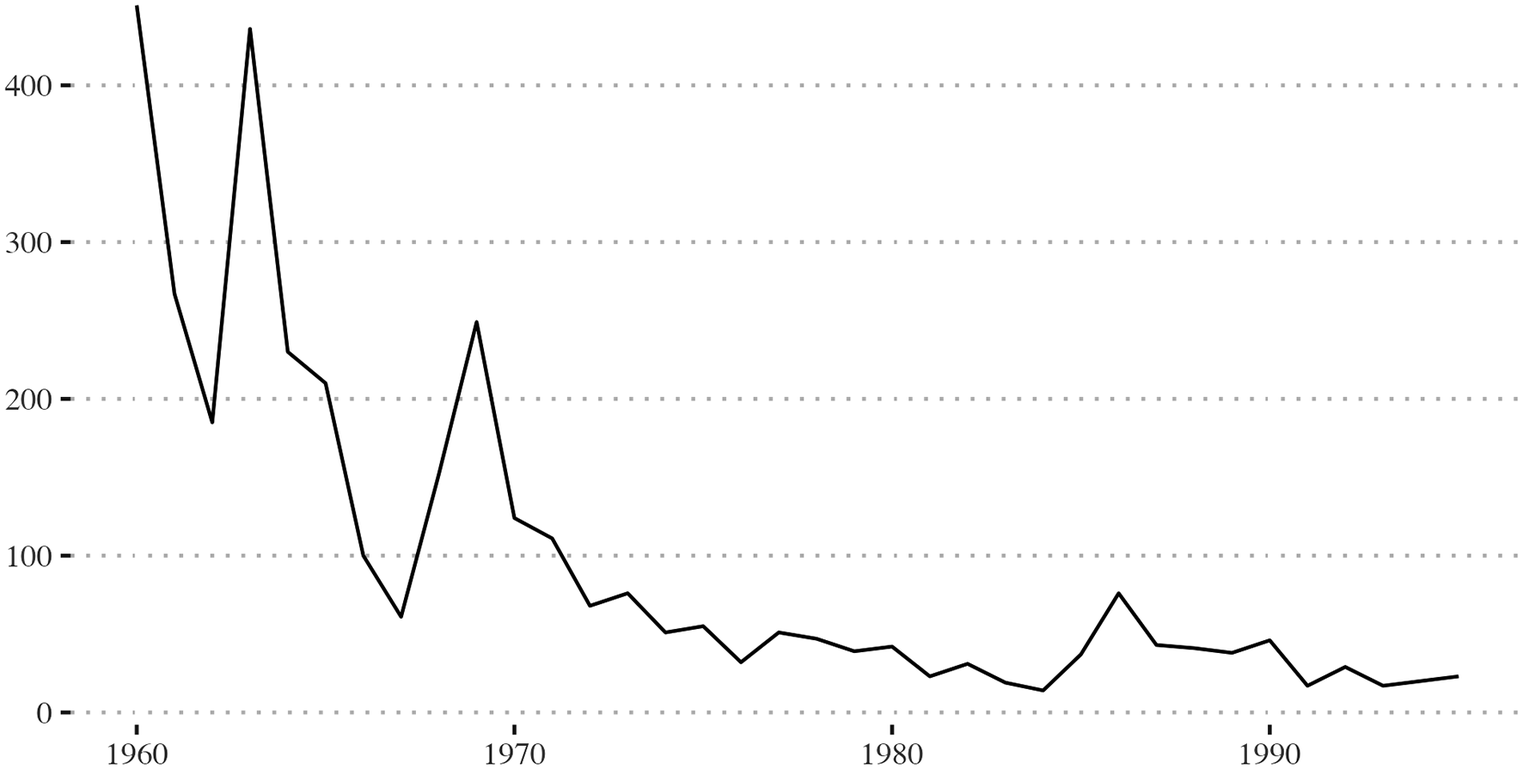
To get a sense of where and how common K-12 school protests were, we count the number of Black student-led protests using data from the Dynamics of Collective Action Corpus (Stoltz et al., Reference Stoltz, Taylor and Jennifer2023). The Corpus records any protest covered in The New York Times from 1960 to 1995 and includes 17,493 articles, each with the article title, a summary, and the date and location of the event. We subset to only articles that mention schools, using keyword searches to capture articles specifically related to protests in K-12 public schools, resulting in 3,556 such articles. Figure 4 shows the number of such articles appearing by year from 1960 to 1995.
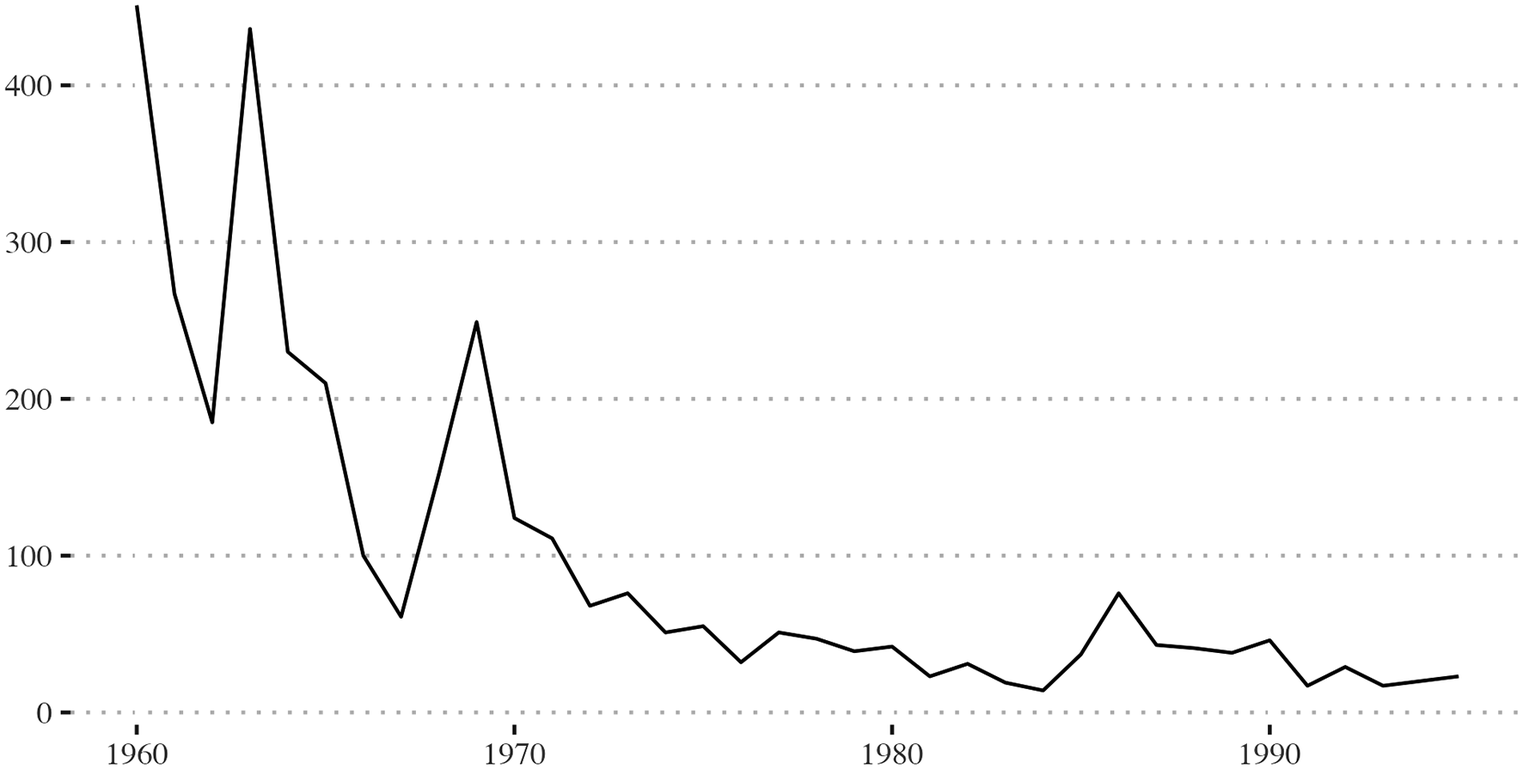
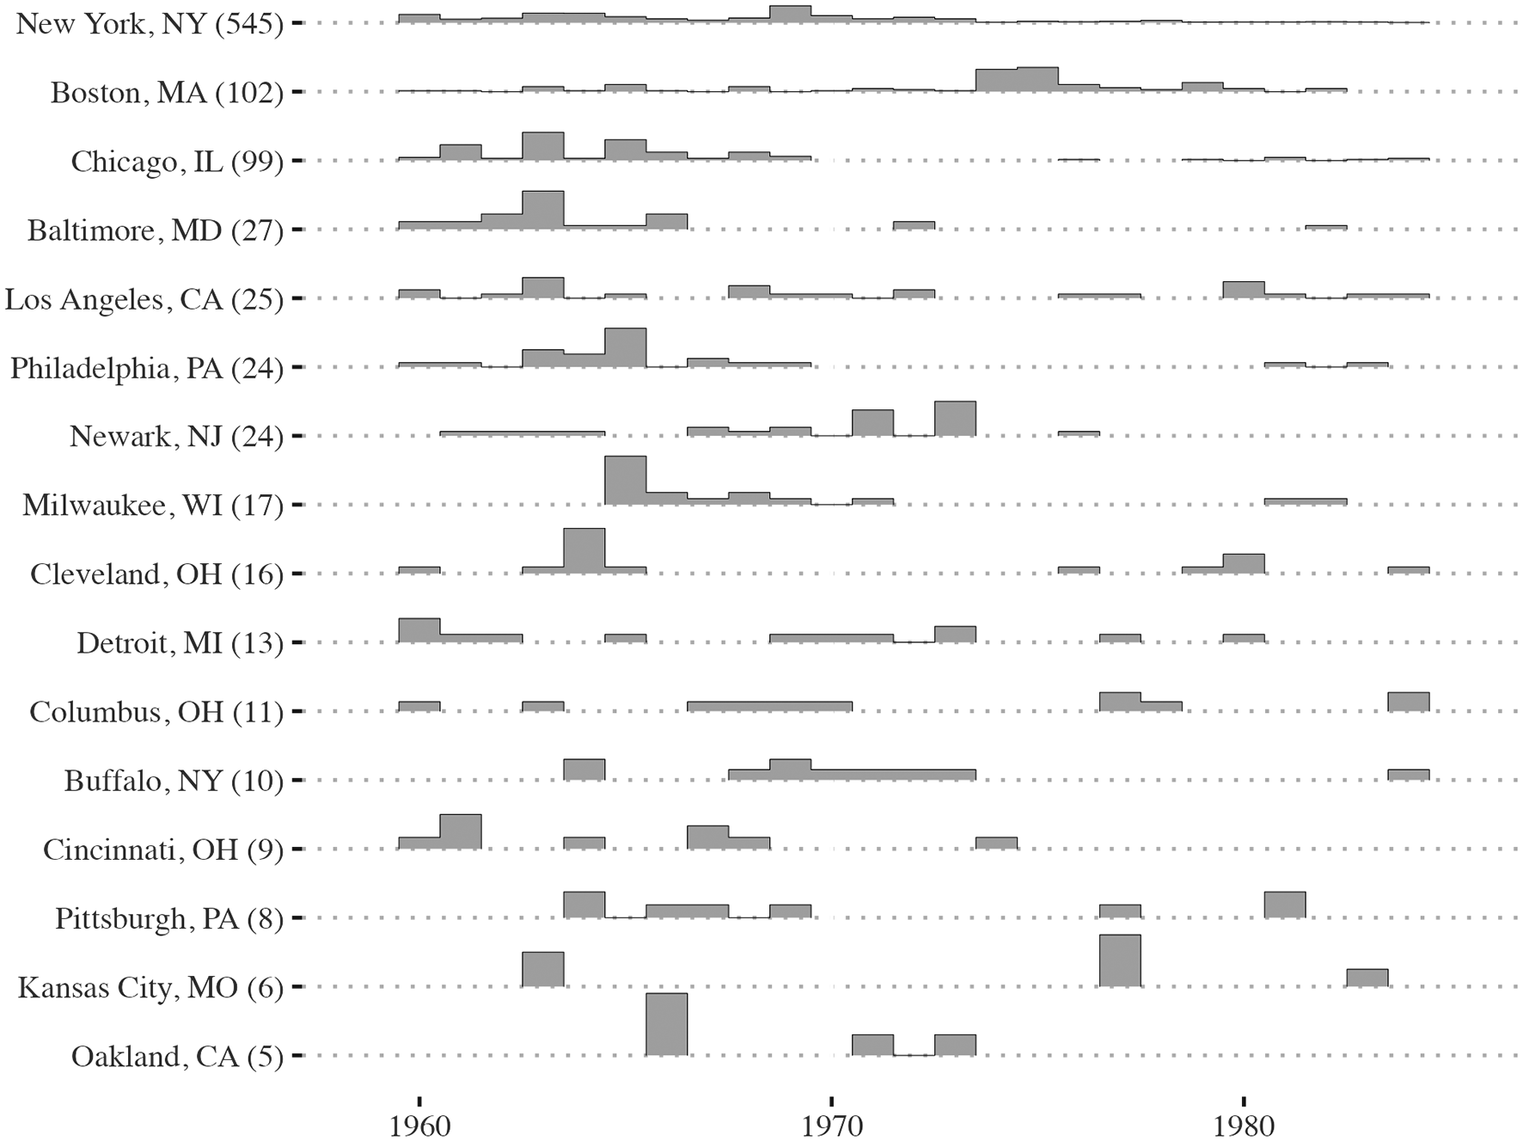
There are clear moments of heightened protest activity, with peaks in 1960 (451 protests), 1963 (436 protests), and 1969 (249 protests), which coincide with the Civil Rights Movement and desegregation busing occurring throughout the country in the late 1960s and 1970s (Delmont Reference Delmont2016). It is important to note that these data do not capture every protest event. Newspapers, especially national newspapers, cannot cover every protest in the United States and are likely to present a conservative estimate of protest activity. Absent the existence of social media that can more effectively capture local events, we use these data because they give a good indication of protests that captured national attention. For example, if there was a single protest event in a city, it is less likely to be covered by a major news outlet than if there was a major protest or a prolonged series of protests in that city. We present these protest events for BMCs in Figure 5. As we are concerned with trends in protest activity across cities, each bar represents the percentage of total protests that occurred in that year. For example, Oakland had five protest articles in The New York Times between 1960 and 1985, with three in 1966. Therefore, the first bar for Oakland represents sixty percent of the total protests in the city. Cities are presented in descending order for the total number of protests in each city for the entire period, indicated by the numbers in parentheses.
Black-led school protests in Black migration cities
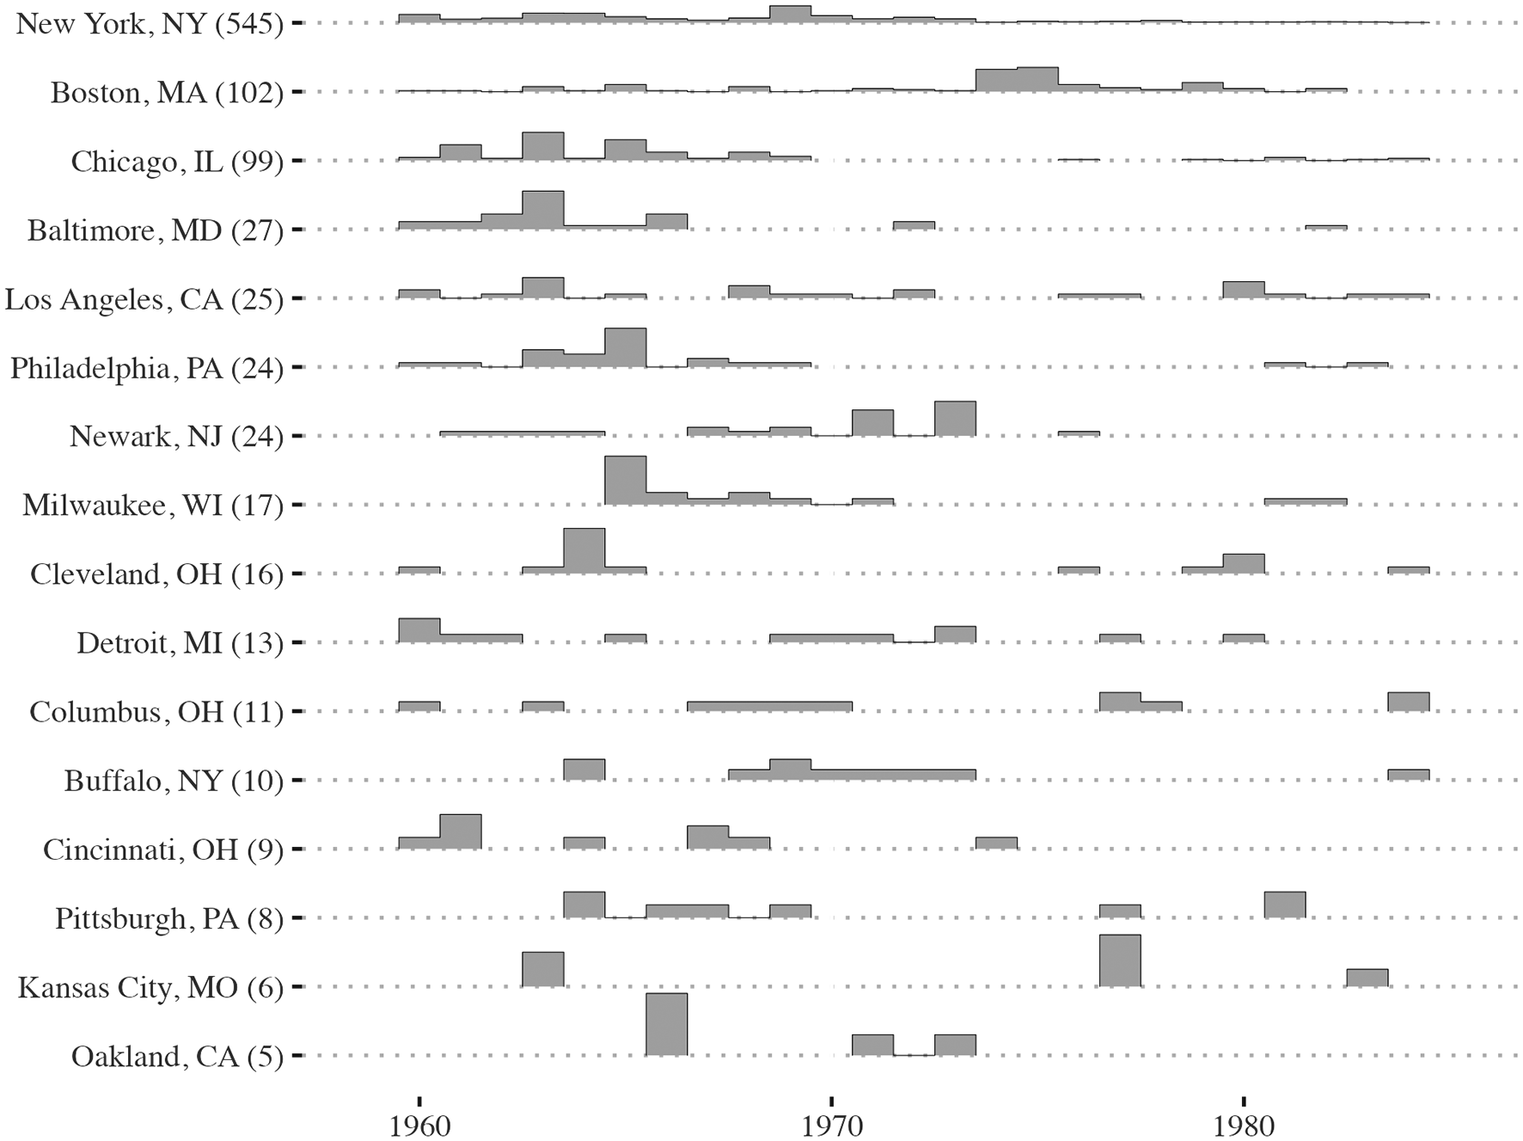
Figure 5. Long description
From top to bottom, each row represents a city, labeled with its name and total protest count in parentheses. The x-axis spans from 1960 to 1980, marked at 1960, 1970, and 1980. New York, N Y shows the highest and most sustained protest activity, with bars distributed throughout the period. Boston, M A and Chicago, I L have concentrated protest activity in the late 1960s and early 1970s. Baltimore, M D, Los Angeles, C A, and Philadelphia, P A show shorter periods of protest, mainly in the late 1960s. Newark, N J, Milwaukee, W I, and Cleveland, O H display clustered activity in the late 1960s and early 1970s. Detroit, M I, Columbus, O H, Buffalo, N Y, Cincinnati, O H, Pittsburgh, P A, Kansas City, M O, and Oakland, C A have fewer and more sporadic protest events, with most activity occurring between 1965 and 1975. The chart highlights the variation in protest timing and intensity across cities.
There are slight differences in the timing and sustainability of protests over time. New York City saw many protests throughout the period, making spikes in protest activity less noticeable than in cities such as Boston, which had a significant spike in 1974 during court-ordered busing to desegregate public schools. Baltimore and Cincinnati had concentrated protests in the early 1960s. In comparison, cities like Chicago, Philadelphia, Milwaukee, Cleveland, and Oakland saw peak activity in the mid-1960s. Most other cities either had a steady rate of protests over the years or experienced a few distinct protest periods.
School Integration
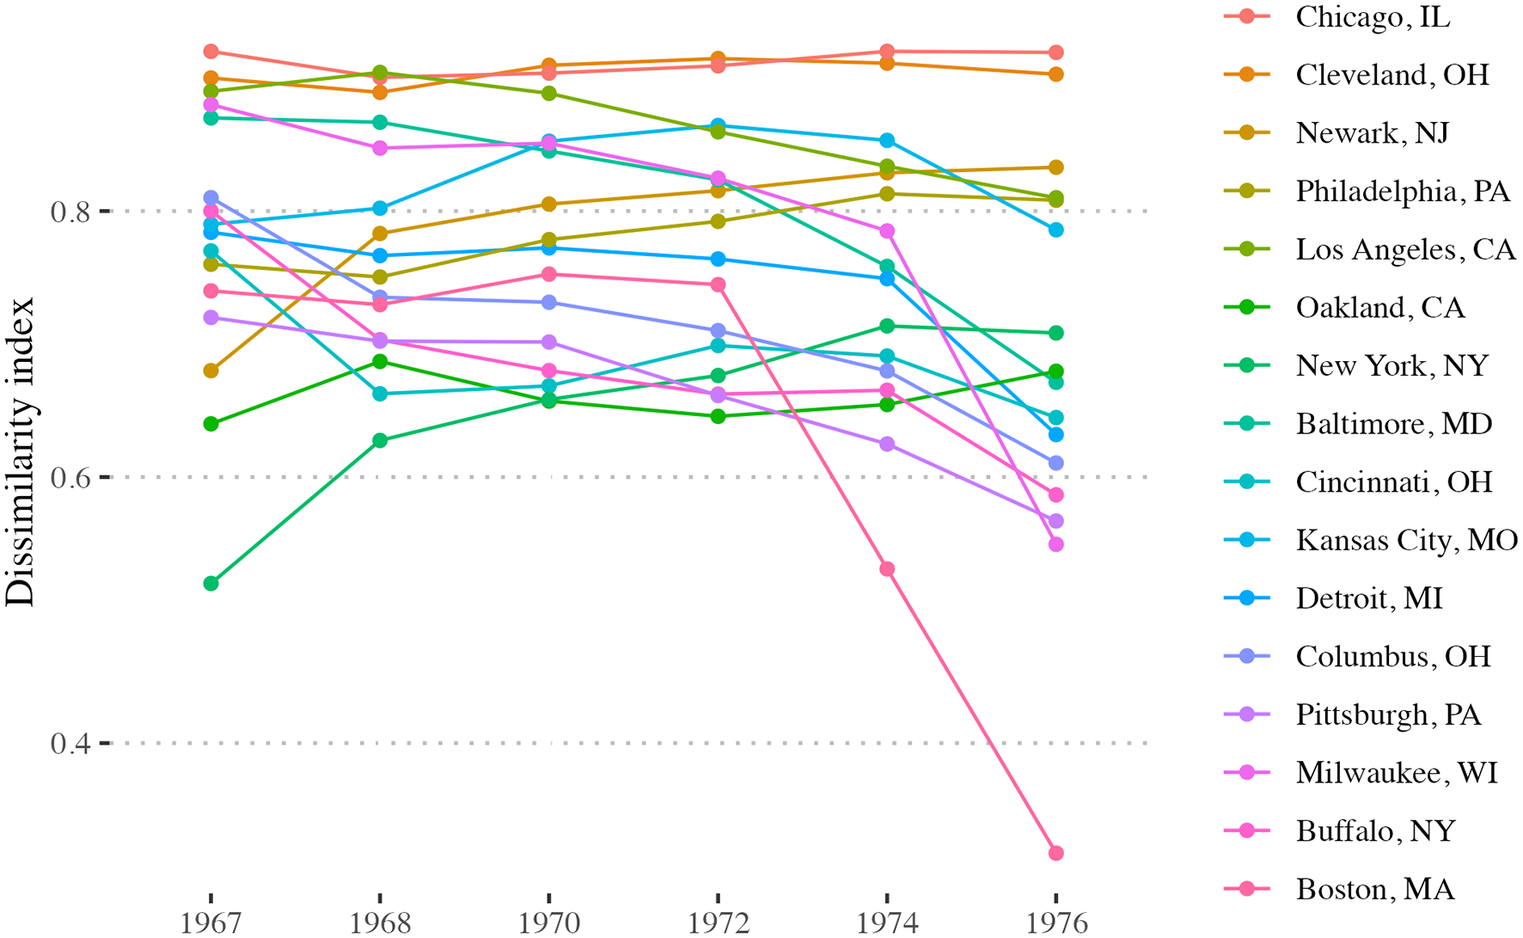
Despite the Supreme Court striking down de jure segregation in Brown v. Board, de facto segregation continued in most school districts across the country. One of the more common ways to measure racial segregation within a school district relative to the underlying population is to use a dissimilarity index (DI) (Jahn et al., Reference Jahn, Schmid and Schrag1947). The DI measures the separation or integration of the two groups, in this case Black and White, across an area and ranges from zero to one. Zero indicates total integration, where both Black and White students are distributed in the same proportions across all schools, whereas a DI of one indicates total segregation, where members of one group attend completely different schools from the other group. Dissimilarity scores of more than 0.6 generally indicate very high levels of segregation; between 0.3 and 0.6, moderate segregation; and below 0.3, low segregation (Massey and Denton, Reference Massey and Denton1998). In calculating the DI, we use school enrollment data from the Civil Rights Data Collection (CRDC), which provides a representative sample of the school district’s enrollment beginning in 1968. We also supplement these data with DIs from 1967 pulled from Farley and Taeuber (Reference Farley and Taeuber1974). We present DI values for all BMCs from 1967 to 1978 in Figure 6; the colors for each city are presented in descending order of the 1976 DI score.
School dissimilarity index for Black migration cities, 1967–1978
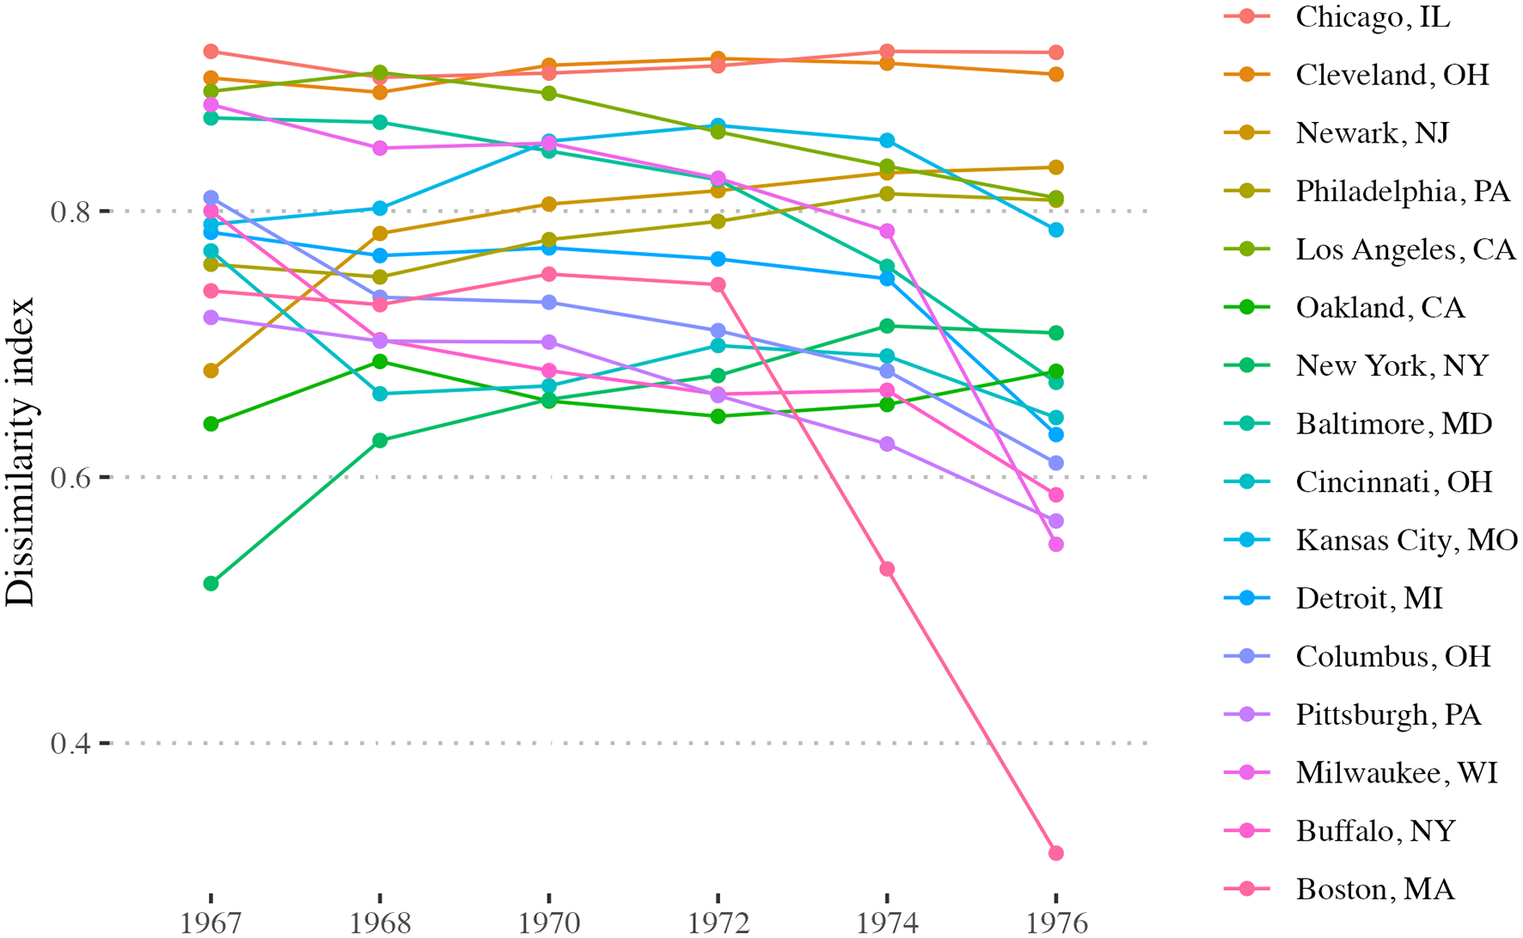
Figure 6. Long description
The x-axis displays years from 1967 to 1976, and the y-axis shows the dissimilarity index ranging from 0.4 to 1.0. Each city is represented by a distinct colored line, with the legend on the right matching colors to city names. Most cities start above 0.7, with Chicago, Cleveland, and Newark remaining near or above 0.9 throughout. Boston shows a sharp decline from about 0.8 in 1974 to below 0.5 in 1976. Other cities such as Detroit, Milwaukee, and Buffalo also show notable decreases after 1972, while cities like Los Angeles and Oakland remain relatively stable. The graph highlights persistent high dissimilarity in some cities and significant declines in others, especially in the mid-1970s.
Segregation remained persistently high in BMC schools throughout the late 1960s and 1970s. Only New York City dropped below 0.6 in 1967 before its segregation level rose again. In 1976, Buffalo, Pittsburgh, and Milwaukee dropped from very high to moderate levels of segregation, while Boston became the only city with low levels of segregation due to a busing program. By 1978, Kansas City, Detroit, and Columbus also shifted to moderate segregation. School districts implemented bus programs, causing many of the most notable drops in the DI score. In April 1971, the U.S. Supreme Court unanimously decided that busing students to desegregate district schools was permissible to remedy prior de jure segregation (Mims and Jennings, Reference Mims and Jennings1976).
Tying it All Together
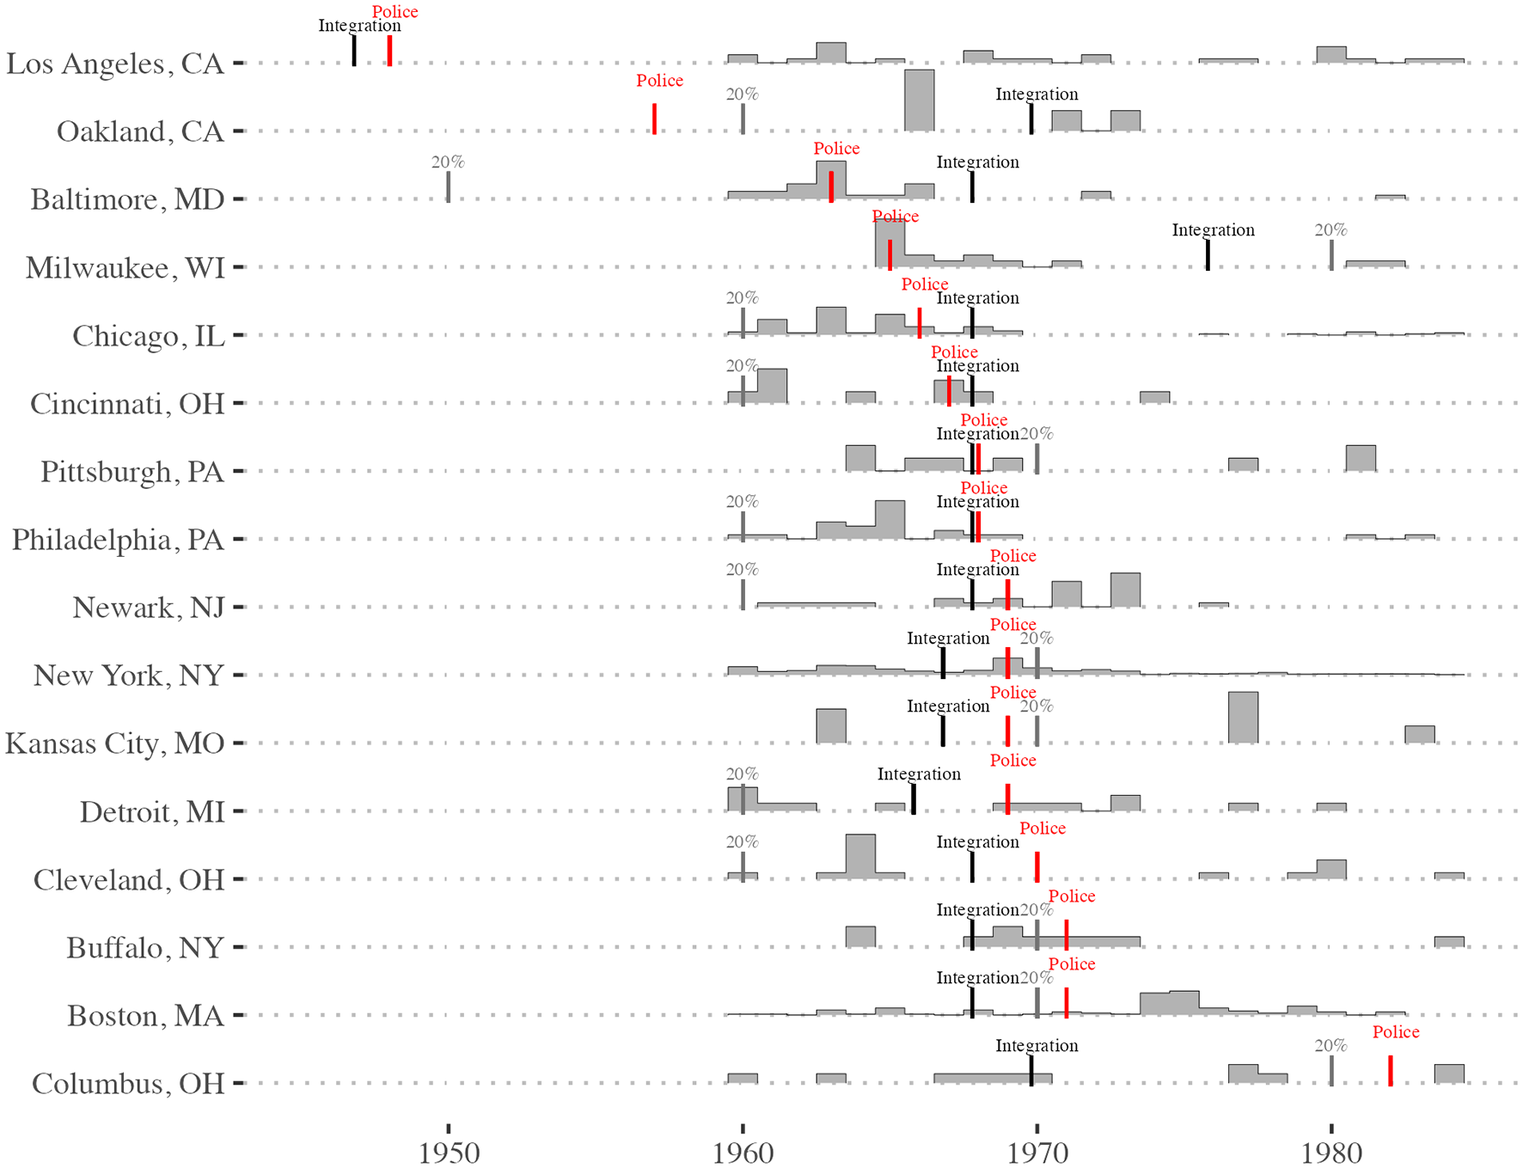
The important ordering of events that we call attention to is that school policing was established following Black challenges to the White-dominated status quo, measured by the movement of Black people into formerly White-dominated cities and demands for educational equity from the Black student population. Figure 7 is a visual portrayal of these components. As in Figure 4, the grey density bars indicate the percentage of protests that occurred each year, based on the total number of protests during the period presented. The grey bars with the label “20%” indicate when the Black population in that city reached at least twenty percent according to the decennial census. As we are interested in understanding the role and timing of desegregation in schools and its relationship with the implementation of school policing, the black line with the label
Black population, integration, protest activity, and school policing
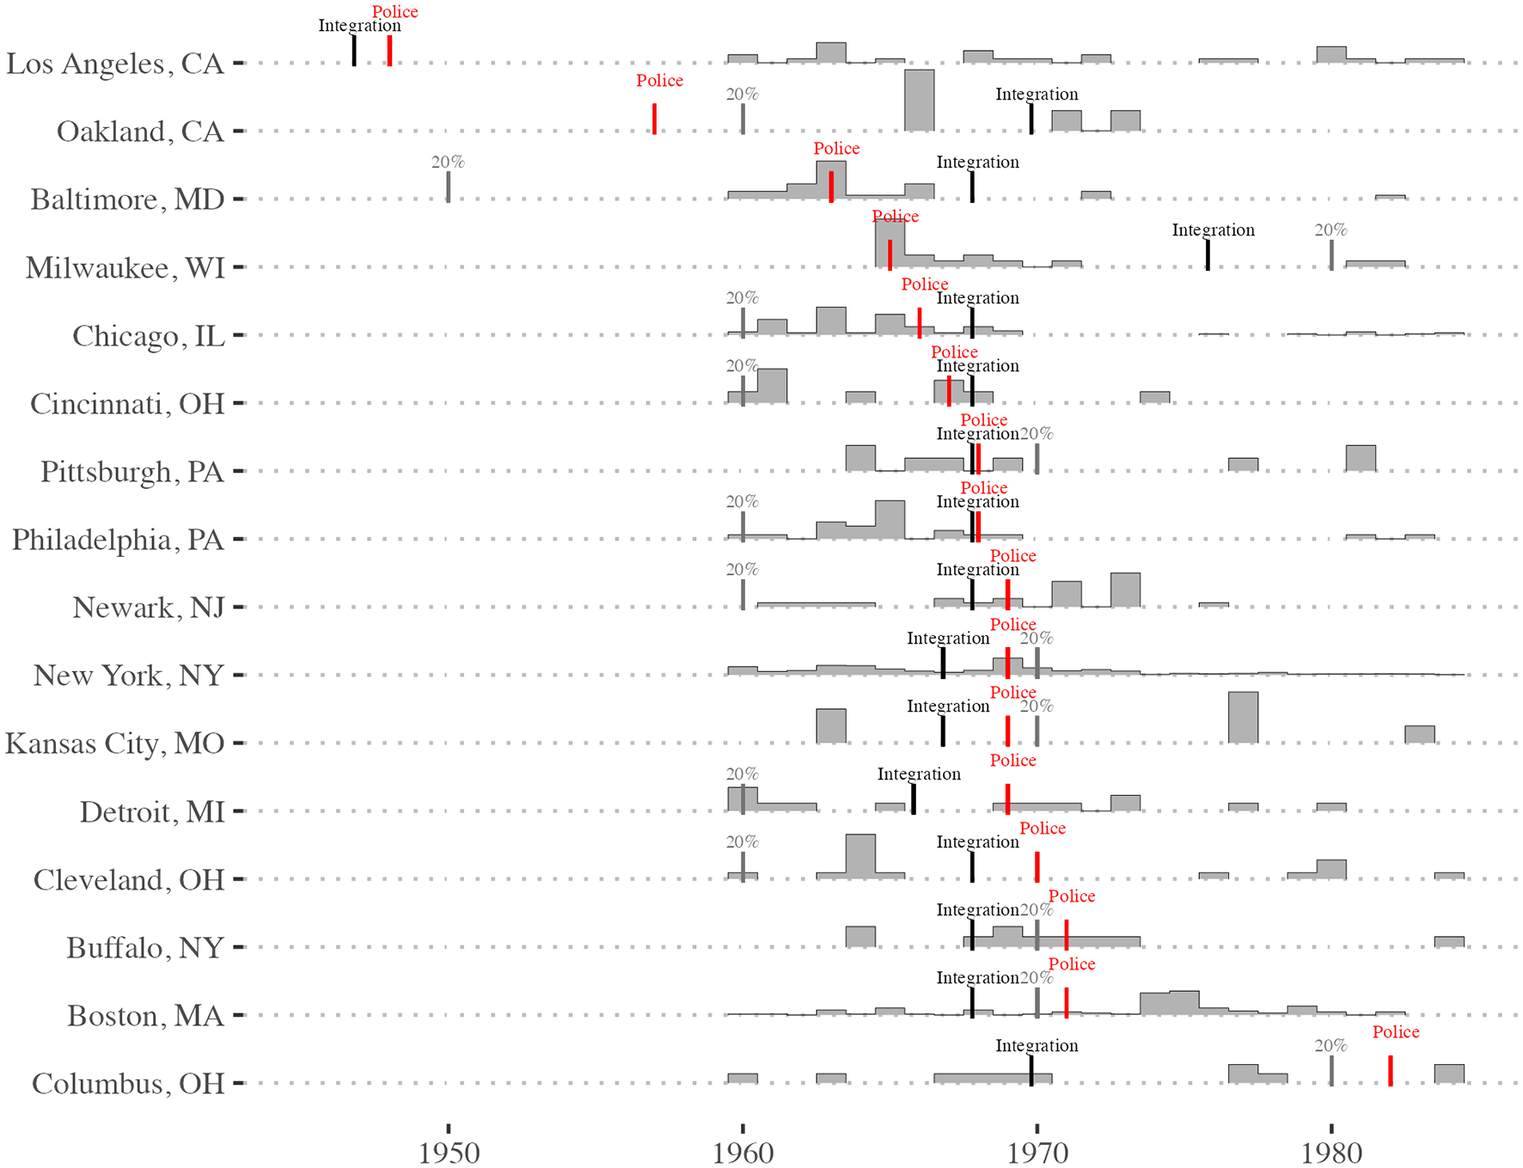
Figure 7. Long description
From top to bottom, each row corresponds to a city, with the x axis spanning 1950 to 1980. Gray histograms show Black population growth, with notable increases in cities like Detroit, Chicago, and Los Angeles. Black vertical lines labeled Integration mark the year of school integration. Red vertical lines labeled Police indicate the introduction of school policing. Red bars represent protest activity, clustered around the late 1960s and early 1970s in most cities. Gray text ‘20%’ marks when the Black student population reached 20 percent. For example, Los Angeles shows integration before 1960, police introduction soon after, and protest activity in the late 1960s. Detroit and Cleveland show sharp population increases and clustered protest and policing events around 1970. Some cities, like Boston and Columbus, show later integration and policing events. The chart highlights the temporal relationship between demographic shifts, integration, protest, and policing across cities.
“Integration” indicates the year the city experienced its first decrease in the DI, or the earliest year the city had a DI under 0.8, whichever came first. The red bar indicates when police were placed in schools in each city, which we recorded by examining historical newspapers and other archival materials. Cities are presented in descending order of when police were stationed in schools.
Across every BMC, police were assigned to schools within three years of either increases in the Black population, school integration, heightened Black student-led protests, or a combination of two or more of these factors. In many cases, these happened in quick succession as seen in Pittsburgh, New York, Kansas City, Buffalo, and Boston. Los Angeles and Oakland adopted school policing early, though both fell within a few years of school integration and increases in the Black population, respectively. Columbus was late to adopt school policing, partly because its Black populations did not reach twenty percent until the 1980s.
The timing of events across cities hints at a troubling reality: police were assigned to schools during moments of challenges to the status quo and increases in Black freedoms and expressions of self-determination. Most importantly, it is not confined to specific cities and instead reflects a broader trend in factors underlying the origins of school police across the country. Of course, relying on protest coverage in a single national newspaper and integration measures from school enrollment data from a national data collection might leave some unsatisfied with our findings. To contextualize our claims, we examine the history of school policing in three cities to elucidate the connection between school integration, Black student protests for improved educational conditions, and the implementation and expansion of school policing.
A Close Look at the Creation of School Policing
The trends we presented in the previous section help us understand the broader dynamics that led to the creation of school policing. However, because each city has unique circumstances and the difficulty of extracting evidence on event timing from an aerial perspective, we select three BMCs as case studies with regional and temporal diversity: Philadelphia, Detroit, and Los Angeles. We select these cities for three reasons. First, we believe that it is important to provide geographical diversity to ensure that we are not examining trends specific to a single region. Second, we select three cities that implemented school policing at different times to ensure that this isn’t a story of states following national trends. Finally, as we noted previously, we include Los Angeles as a case study to highlight that carceral responses are not confined to Black youth and should be understood as a broader state response to non-White youth.
Though we limit our examination here to just three cities, they are examples of a wider phenomenon. To prove as such, we provide supplemental figures in Appendix B for three BMCs not included in this section. When examining the history of each city, we provide more granular data and historical information on changes in racial demographics, media framing of Black youth, protest activity, and efforts to integrate schools. In doing so, we show that Black student-driven challenges to the White power structure prompted the swift implementation of policing infrastructure within the public school system.
Philadelphia, PA
Despite its relatively minor status as a civil rights hub, Philadelphia is home to some of the most successful Black civil rights victories (Countryman Reference Countryman2006). In the 1950s, advocates in the city became increasingly focused on the issue of juvenile delinquency, and in 1953, Rev. Leon H. Sullivan founded the Citizens Committee Against Juvenile Delinquency and Its Causes, with the goal of creating a coalition of Black neighborhood groups solving the root causes of juvenile delinquency (Countryman Reference Countryman2006). Despite best intentions, the group instead drifted into placing blame on factors within the Black community rather than systemic impacts of White supremacist structures. The group eventually fell apart when Sullivan left to establish a group focused on youth employment, while its next round of leaders focused on interracial relations and building connections with White business owners (Countryman Reference Countryman2006). This signaled a broader rupture in Black organizing in the city, with younger cohorts feeling disillusioned and opting for movement tactics more aligned with Black nationalism. Chief among these concerns was the issue of school segregation and improved quality of Black schools (Philips Reference Philips2005).
In the years following the Brown decision, Black residents and community organizations in Philadelphia intensified pressure on the school board to implement desegregation. In March 1963, a coalition of civil rights organizations established the Coordinating Council for School Integration (CCSI) to formulate strategies for widespread integration (Phillips Reference Philips2005). The CCSI’s recommendations included adopting a formal policy of racial integration, creating separate departments for student and personnel integration, and designating specific schools for targeted integration (Phillips Reference Philips2005). These recommendations served as the basis for the Lewis Committee report, presented to the school board in summer 1964. The Lewis Report reaffirmed the school board’s commitment to integration and proposed redrawing district boundaries and selecting new sites for targeted integration through busing (Phillips Reference Philips2005). Widespread White opposition followed, including protests at the school administration building, boycotts when Black students were bused to South Philadelphia, and the symbolic act of carrying a coffin into a board meeting to represent “the death of the neighborhood school” (Phillips Reference Philips2005).
The following years would see an intensification of protest activity from both sides: White parents pushing the city to maintain segregated schools on one side and civil rights groups pushing the school board to adopt meaningful integration policies on the other. Black students, disillusioned by failed attempts to integrate the city’s schools, instead pushed for improved education within their own schools. These efforts came to a head in late 1967.
On the morning of November 17, 1967, more than 3,500 students from ten predominantly Black high schools in Philadelphia walked out of school and staged a protest outside the Board of Education building (Fox Reference Fox1967). A coalition of Black Power organizers coordinated the protest, including the Student Action Committee (SAC), the Chair of the Congress of Racial Equity (CORE), and the Philadelphia Student Nonviolent Coordinating Committee (SNCC). Their demands were simple: include courses on African American history, allow students to wear traditional African clothing in school, hire more Black teachers in predominantly Black schools, and increase Black representation on the Board of Education. The demonstration began peacefully, with youth and civil rights leaders walking from schools across the city to the Board of Education building while “singing and shouting black power slogans” (New York Times 1967).
The peaceful protest became violent when Police Commissioner Frank Rizzo ordered his officers to “beat their Black asses” and “without [the request of the school board], set loose a couple of hundred men swinging clubs and beating children” (New York Times 1967). Fred E. Holliday, administrative assistant to the Black School Superintendent, said “none of the students within his range of sight that day offered any provocation to justify the police attack on them” (Thomas Reference Thomas1967). Holliday also stated that Black students climbed into the School Board building to escape the police, who were “beat[ing] those black sisters” (Thomas Reference Thomas1967). By day’s end, fifty-seven protesters were arrested. Two prominent Black Power leaders, William Mathis and Walter Palmer, were held on a $50,000 bond (Fox Reference Fox1967).
Following the 1967 Philadelphia school walkout, the city experienced a string of school-related protests, including a protest led by 1,200 angry White parents opposing the city’s plan to integrate some public schools (Corr Reference Corr1968). In October 1968, following disturbances in ten schools earlier that month and citing rising crime among the city’s youth population, Mayor James H. J. Tate proposed handing all matters related to school security to the Philadelphia Police Department (Philadelphia Inquirer 1968). The original plan presented by Tate included clauses that would allow the “city to handle school financial matters, create detention centers for unruly pupils, issue identification cards for students, and form inspection teams of parents “to establish factual accounts of school conditions” (Philadelphia Inquirer 1968).
The plan proposed by Tate received widespread criticism, and the school board president, Richardson Dilworth, said that handing school security to the Police Department “could be very dangerous to education” (Philadelphia Inquirer 1968). At a meeting in mid-October 1968, Dilworth convinced the school board to reject Tate’s plan and stated that the school district would continue to rely on the police force to prevent unauthorized persons from entering schools but would not allow officers to be assigned inside schools (Aregood Reference Aregood1968). Dilworth’s efforts to curb police presence in schools were short-lived. At a meeting on November 20, 1968, the city and school board reached an agreement allowing an additional twenty uniformed officers to be assigned to school buildings (Philadelphia Daily News 1968). The original twenty police who were permanently placed in schools were stationed in Bok, South Philadelphia, Germantown, and Gratz (McAdams Reference McAdams1968), all of which had student populations that were majority Black (CRDC).
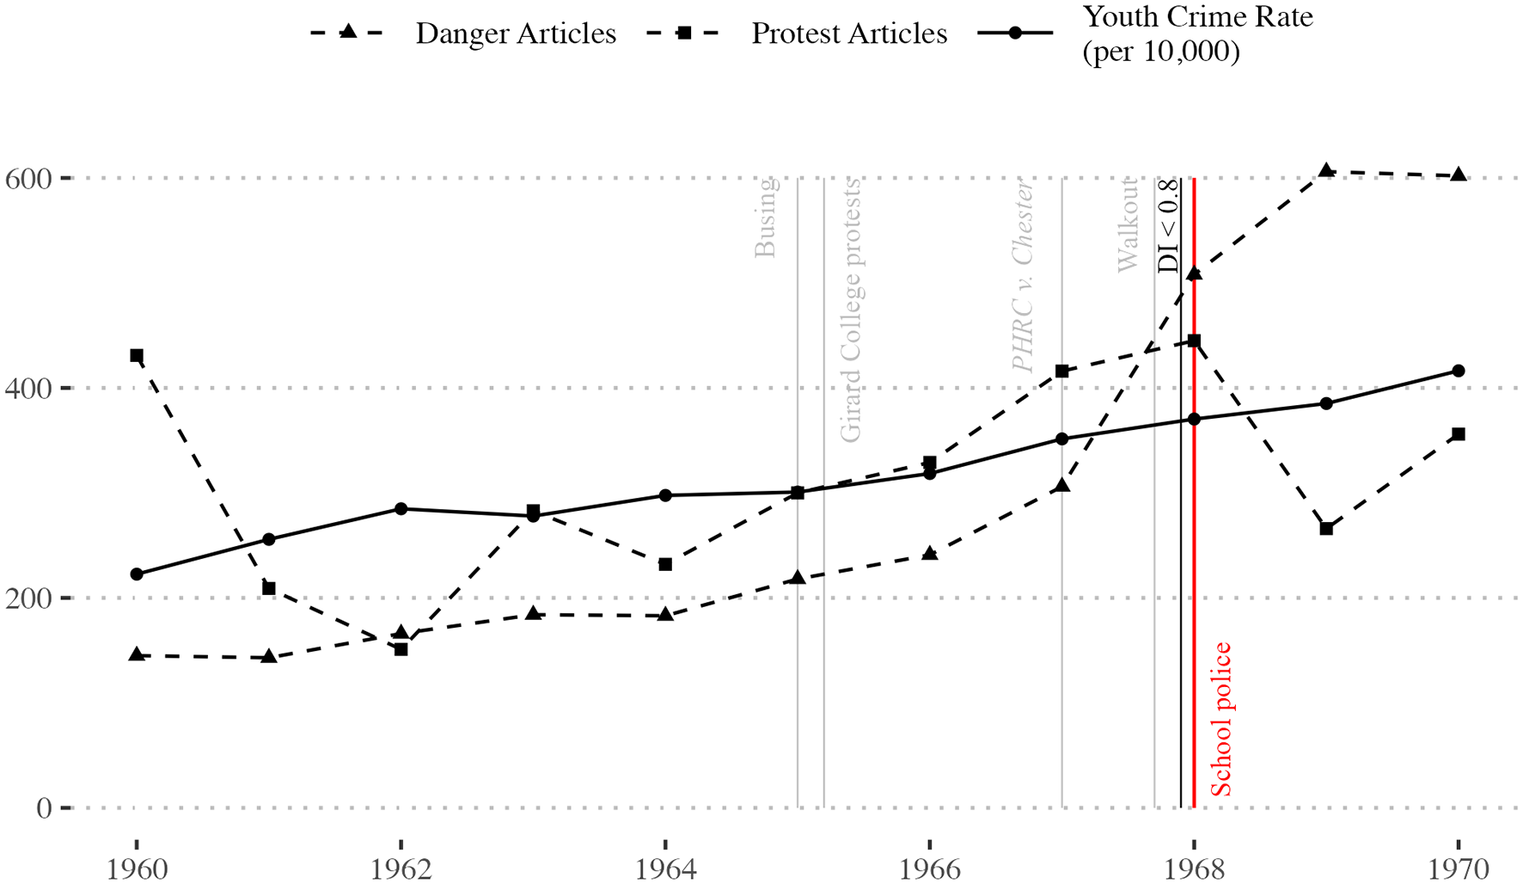
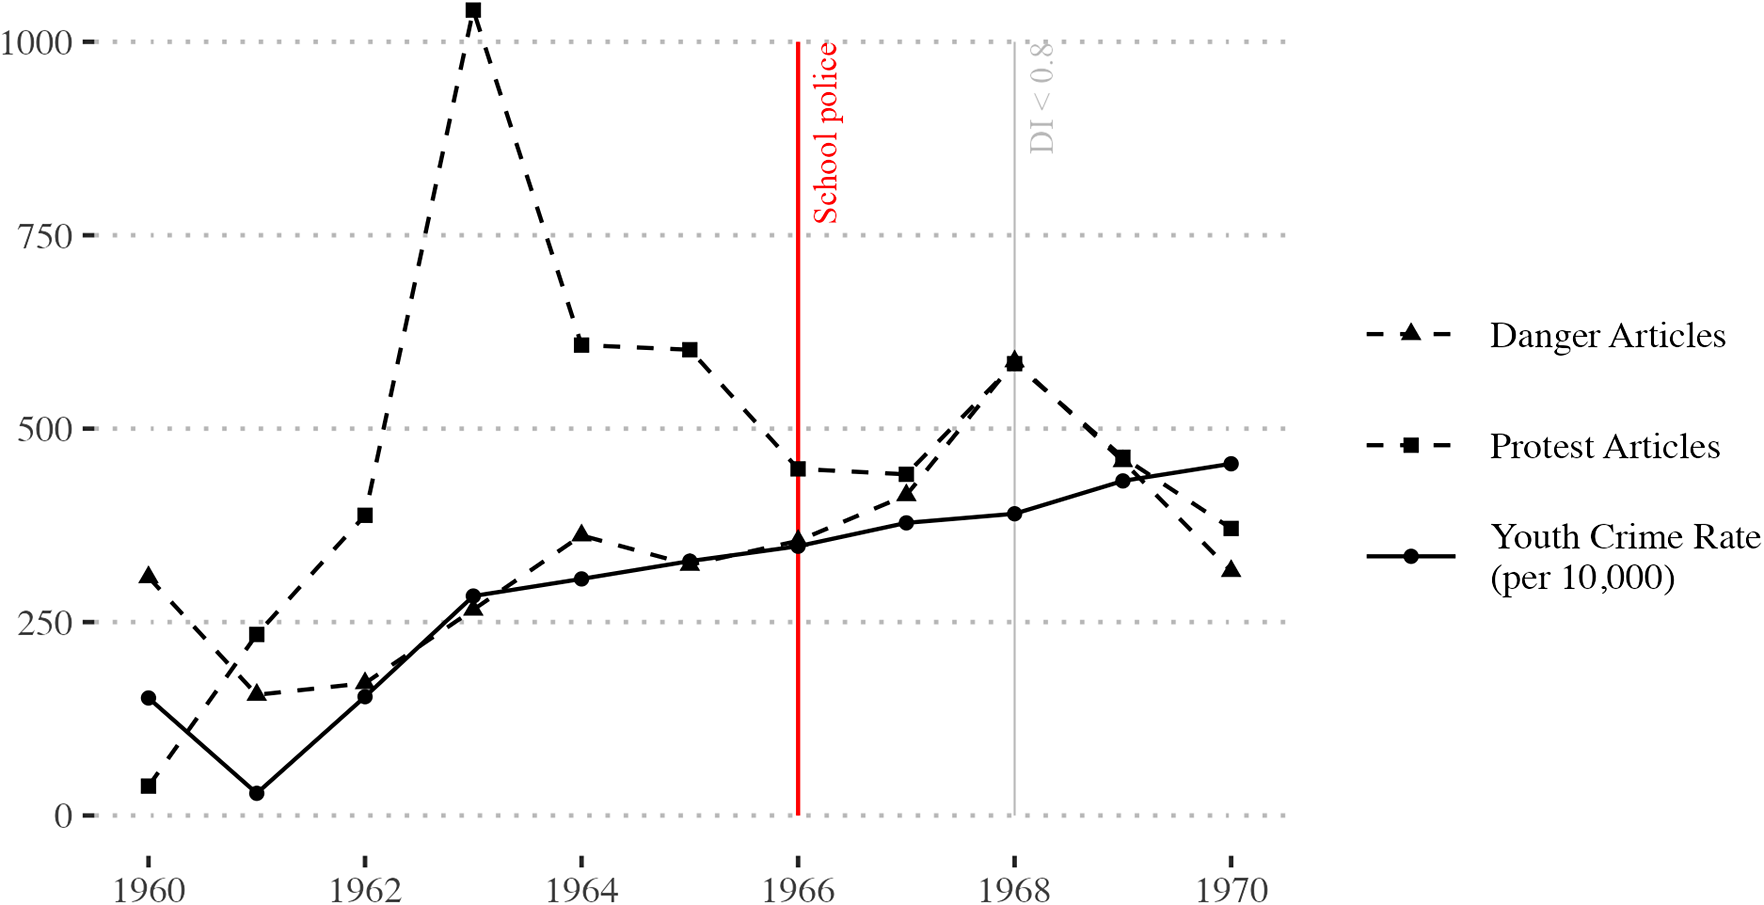
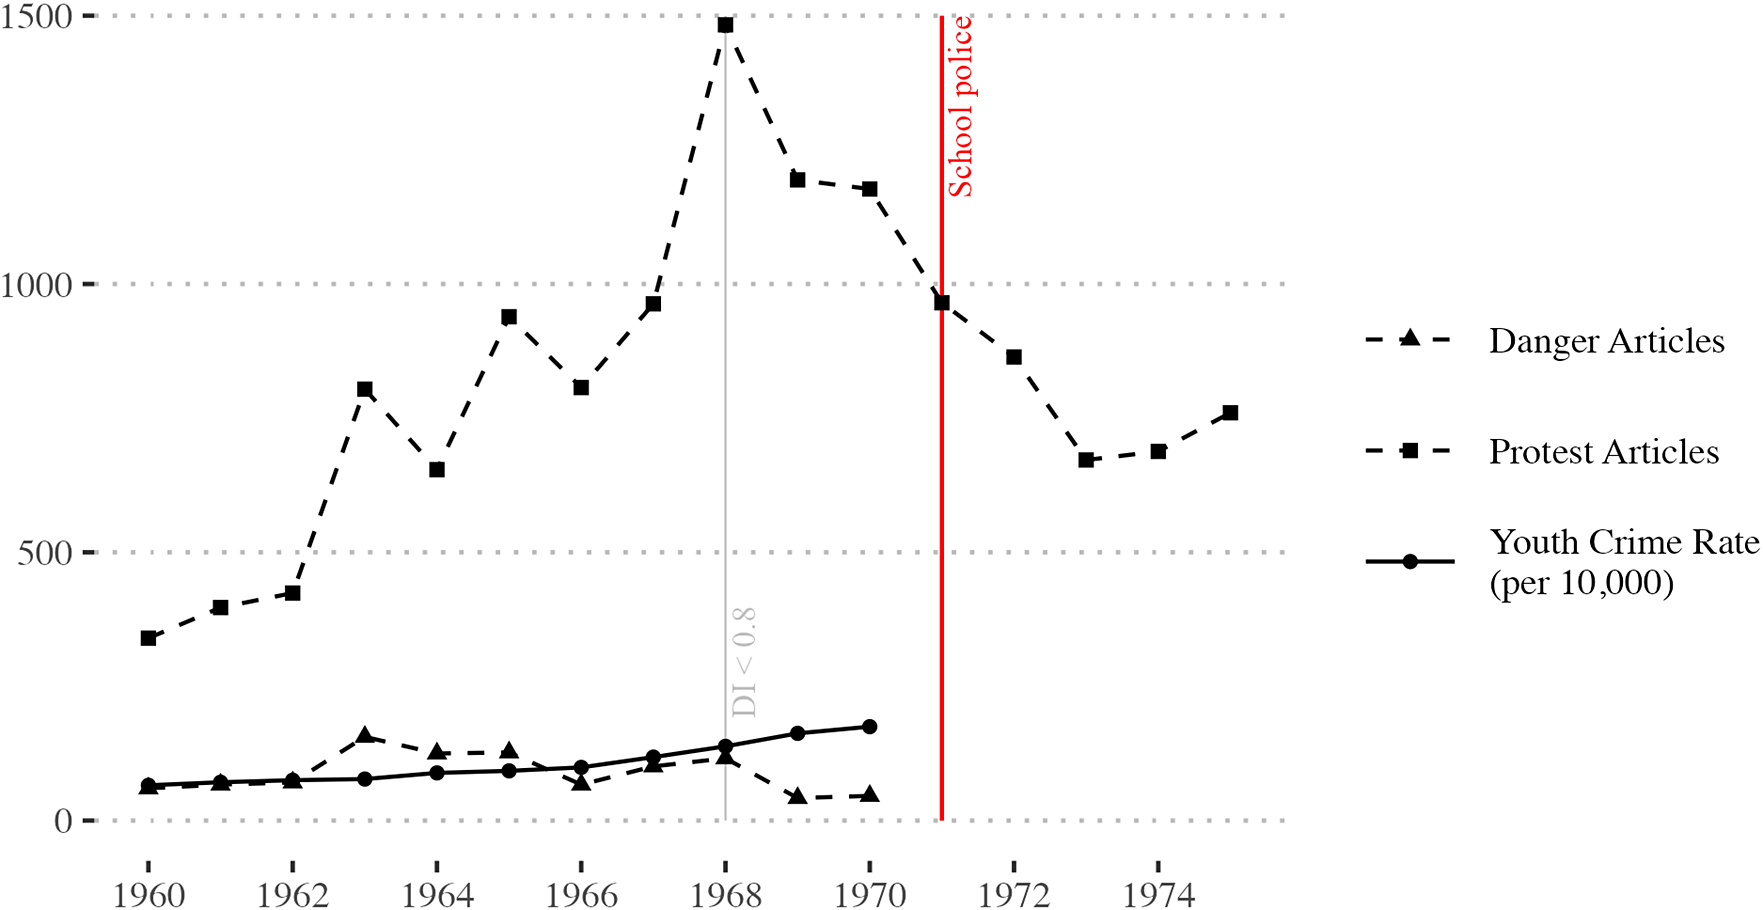
Like many advocates of school police, there was a reliance on the need to curb rising crime rates. However, according to crime statistics, there was no dramatic increase in the crime rate leading up to the establishment of school police in Philadelphia. Figure 8 shows the youth crime rate in Philadelphia from 1960 to 1970 (solid trend line). We also include other important factors leading to the decision to put police in schools to provide a more comprehensive picture: Black student-led protest articles (dashed trend line with squares) and Black danger-framed articles (dashed trend line with triangles). The horizontal grey lines show various school desegregation-related events. The horizontal black line indicates when the dissimilarity index fell below 0.8, indicating a decrease in school segregation.
Events leading to the creation of Philadelphia School Police, 1960–1970
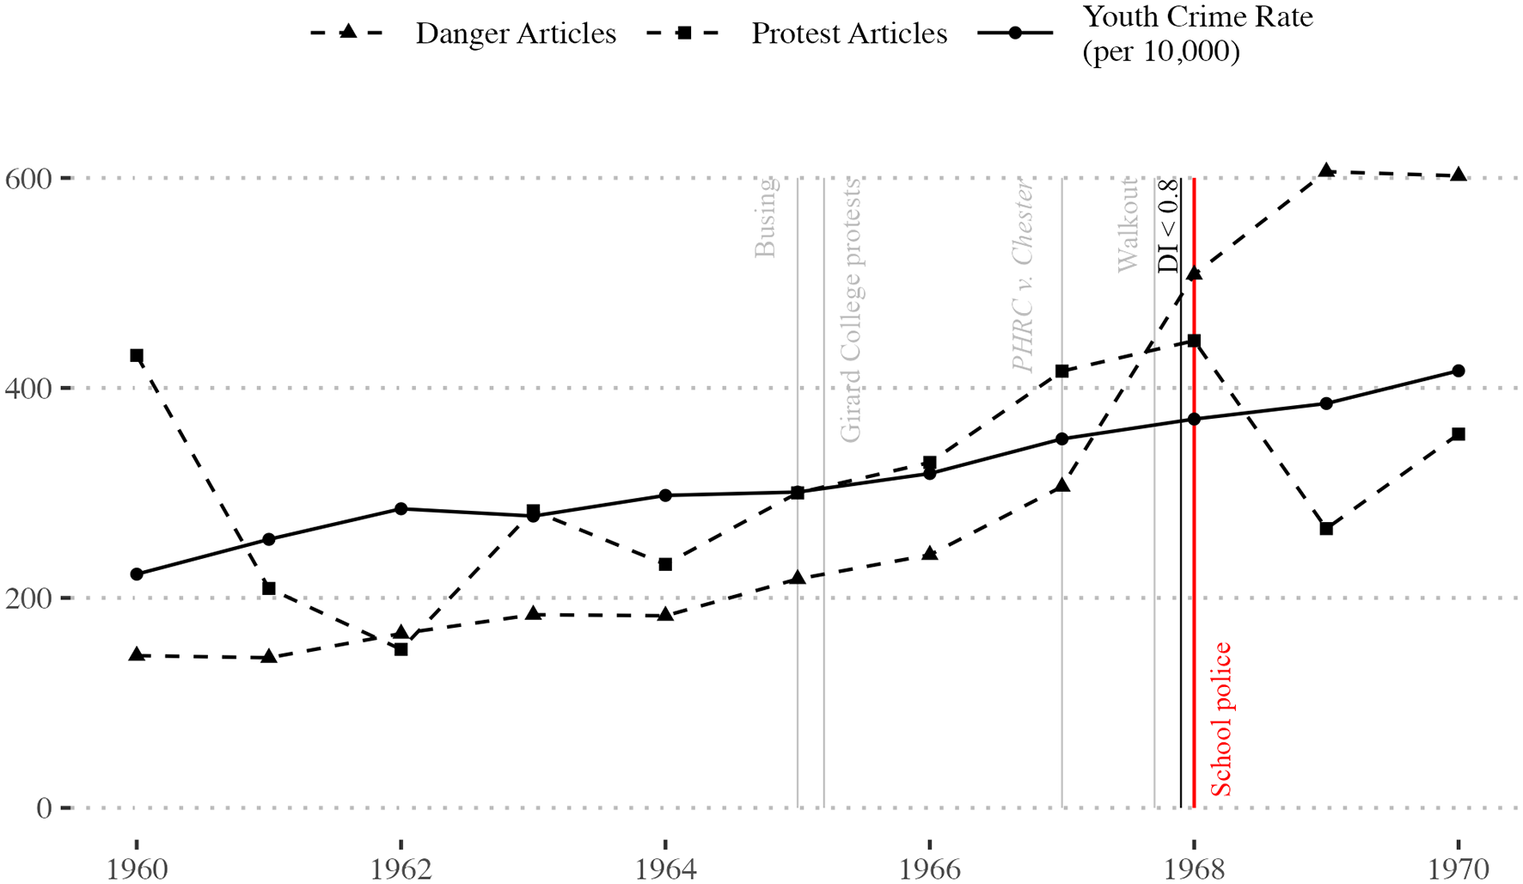
Figure 8. Long description
The x-axis spans years 1960 to 1970, and the y-axis ranges from 0 to 600. The dashed line with triangles represents Danger Articles, which starts near 200, remains flat, then rises sharply after 1966, peaking above 600 by 1970. The dashed line with squares shows Protest Articles, starting above 400 in 1960, dropping below 200 by 1962, fluctuating, then rising after 1966, peaking near 400, and dropping again by 1970. The solid line with circles represents Youth Crime Rate per 10,000, starting just above 200, rising steadily to over 400 by 1970. Vertical lines mark events: Busing, Girard College protests, PHRC v. Chester, Walkout, D I less than 0.8, and School police (in red). Event markers cluster around 1967-1968.
While there was a slight increase in the youth crime rate throughout the 1960s, state-sourced data does not substantively back Mayor Tate’s assertion that school policing was necessary because of the rampant increase in crime throughout the city. The slight rise in crime rate must be considered alongside the shifting racial dynamics within the city as well as the school-related protests led by Black youth and newspaper coverage of dangerous Black youth which increased more dramatically over the same period.
Detroit, MI
Detroit’s Black population exploded following WWII, jumping from just under ten percent in 1940 to almost thirty percent in 1960. As Black people fought for social, economic, and political equity, White people were simultaneously fighting to maintain the existing power structure (Sugrue Reference Sugrue2014; Thompson Reference Thompson1999). With explosive battles over issues ranging from housing to education, none were quite as contentious as issues over law enforcement. In 1957, the NAACP reported the rampant discrimination of the Detroit Police Department and recommended that a racially representative group of Detroiters survey the Department and make recommendations for improvement. At this point, White Detroiters were resistant to forming such an alliance (Thompson Reference Thompson1999).
In the 1960s, when racial tensions in the city were heightening, education and schooling became a focal point for Detroiters. Like many cities in the years following the Brown decision, advocates and public officials in Detroit attempted to integrate schools with limited success. Following years of protest by Black students, Black parents, the Black press, and Black advocacy groups—protesting the continued segregation of Detroit schools, mistreatment of Black students by White educators, poor funding, and anti-Black curriculum—advocates started to achieve some victories in the early 1960s. In February 1962, the Detroit Branch of the NAACP voted unanimously to create a Citizens Advisory Committee on School Desegregation (CACSD) to oversee the School Board’s efforts to desegregate and improve city schools and report those actions to the community (Turner and Johnson, Reference Turner and Johnson1962). In 1962, the Citizens Advisory Committee released a damning report highlighting the “rampant segregation and discrimination” and charged “obvious laxity by administrators in carrying out Board of Education integration policies” (Cleage Jr. 1962). The report refueled public protests, including boycotts, pickets, and marches.
These years of efforts proved fruitful. In 1965, the Detroit School Board successfully passed two programs designed to accelerate school integration. The first program focused on racially transitioning neighborhoods and sought to increase funds for intergroup relations (Savage Reference Savage2020). The second, known as the Shared Experiences Program (SEP), aimed to pair White and Black schools outside the classroom to develop the skills needed for an integrated society (Savage Reference Savage2020). Though the SEP gained traction, community advocates and the Board’s Task Force on Quality Integrated Education agreed that they needed more aggressive policies to meaningfully integrate schools. The Task Force ultimately recommended developing an interschool district to counter housing segregation (Savage Reference Savage2020). The Board rejected this recommendation, and instead, Governor William Milliken signed Public Act 244 into law in August 1969. Public Act 244 divided the Detroit school system into semiautonomous regions and gave the School Board the responsibility of drawing school attendance boundaries (Savage Reference Savage2020). On April 7, 1970, the Board released a revised plan that altered attendance patterns across Detroit and relocated roughly 9,000 students to different schools. As expected, the plan received significant opposition. Within a few months, White opponents of the plan launched a successful campaign to oust four Board members who voted in favor of integration (Savage Reference Savage2020).
While integration policy battles were happening within the School Board, Black protest movements were gaining traction across Detroit. By the mid-1960s, students at Northwestern High School, the epicenter of Black student protest in the city, reached a boiling point. On April 7, 1966, 2,300 students walked out of school to protest “grossly inferior educational opportunities for Negroes” and “a repressive high school administration at Northern” (Inner-City Voice 1969). Demonstrations at Northern lasted until April 26, 1966, and concluded with the Board creating a committee to examine the conditions at Northern and make recommendations for improvement. An article by Northern students, published in The Inner-City Voice three years later, suggests that no meaningful changes were made (Inner-City Voice 1969).
Just over a year following the Northern school walkout, Detroit experienced one of the most intense uprisings of the Long Hot Summer. On July 23, 1967, the Detroit Uprising erupted, and years of racial oppression and Black indignation boiled over into the streets (Locke Reference Locke2017). During the following six days, at least forty-three people were killed, 552 buildings were destroyed, and more than 7,000 people were arrested (Elnaiem Reference Elnaiem2020). The uprising was triggered by a police raid on an after-hours drinking establishment where Black Vietnam War veterans were celebrating. Detroit’s Black youth, who were politically active before the uprising, leveraged this moment to organize for a better education. By the end of the 1960s, students formed the Black Student United Front (BSUF), a student organization fighting for Black self-determination in Detroit schools. By the early 1970s, there were BSUF chapters in all twenty-two high schools in the city. The BSUF organized numerous protests in Detroit Public Schools and was frequently subjected to brutalization by the Detroit Police Department.
In March 1968, hundreds of Black students staged a series of walkouts to protest school conditions and treatment from White school officials and teachers at Post Junior High School (TMU 1968). In November 1969, twenty students from the Association of Black Students at Phillip-Wright High School threatened to shut down the school if the White principal, Lucy Duck, was not removed from her position (Owosso Argus Press 1969). Rather than listening to the demands of Black students, the School District responded to peaceful protests by stationing police officers in schools. An article in The Detroit Free Press (Allaway Reference Allaway1969) describes a plan created by public school officials and the City’s Urban League to assign “police counselors” to schools to reduce crime. Under the proposed plan, a police officer in plain clothes would be assigned to each high school. In 1969, Roman Gribbs called for stationing police in schools during his successful mayoral campaign (Hoyt Reference Hoyt1969). The city followed through with its promise, stationing a school security guard in each of the city’s twenty-two high schools in the fall of 1970 (Grant Reference Grant1970).
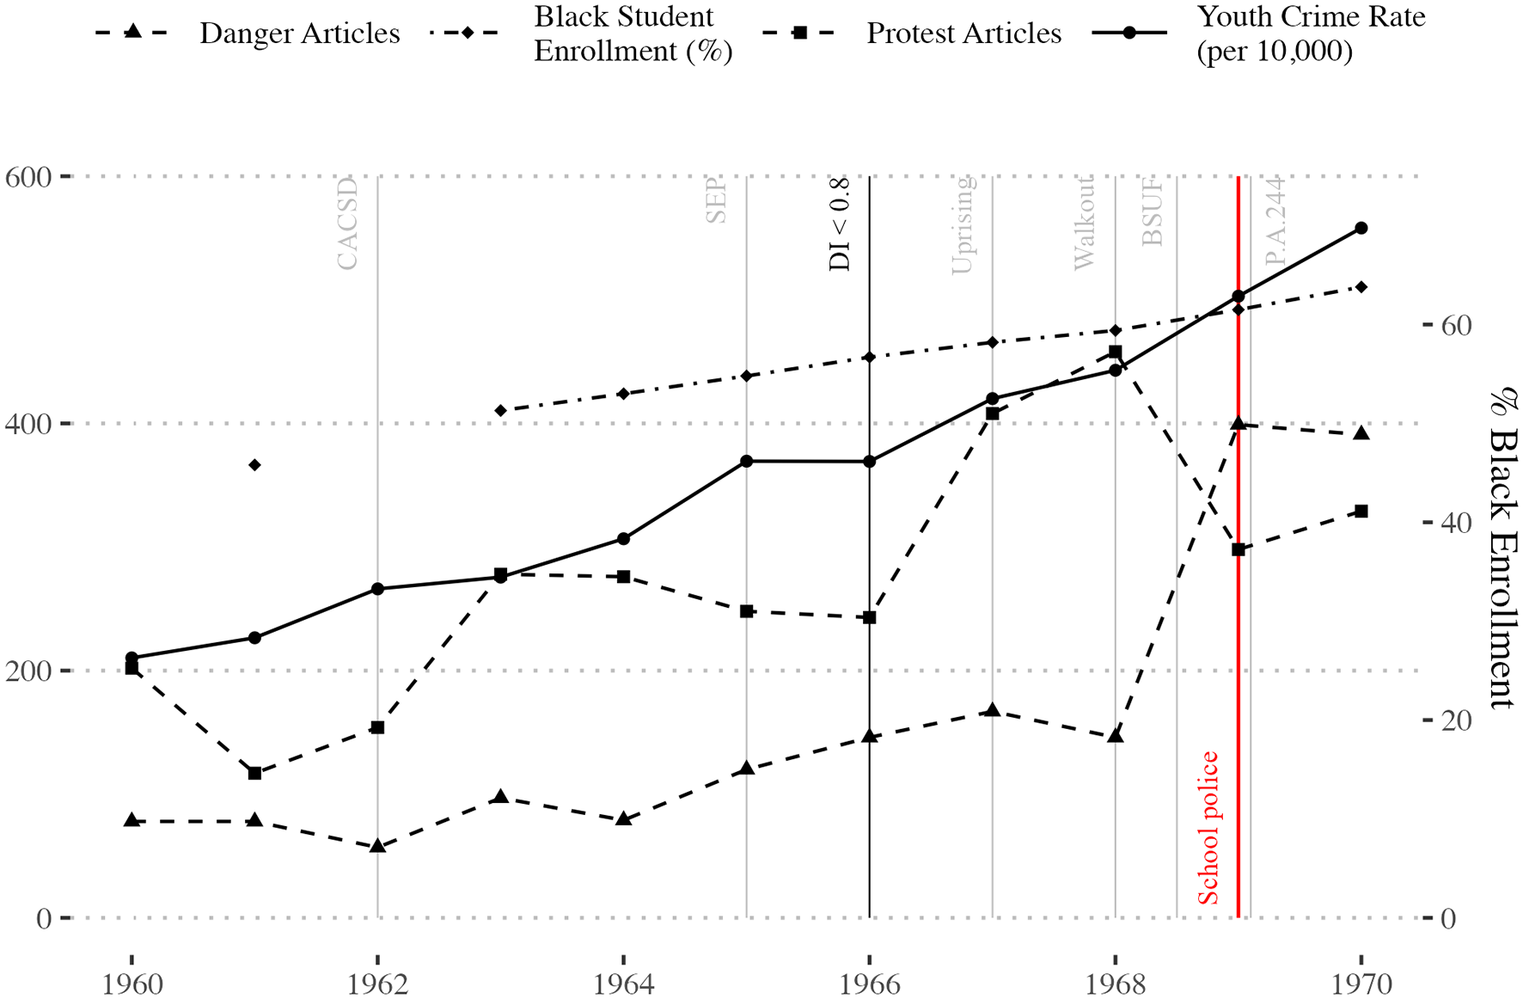
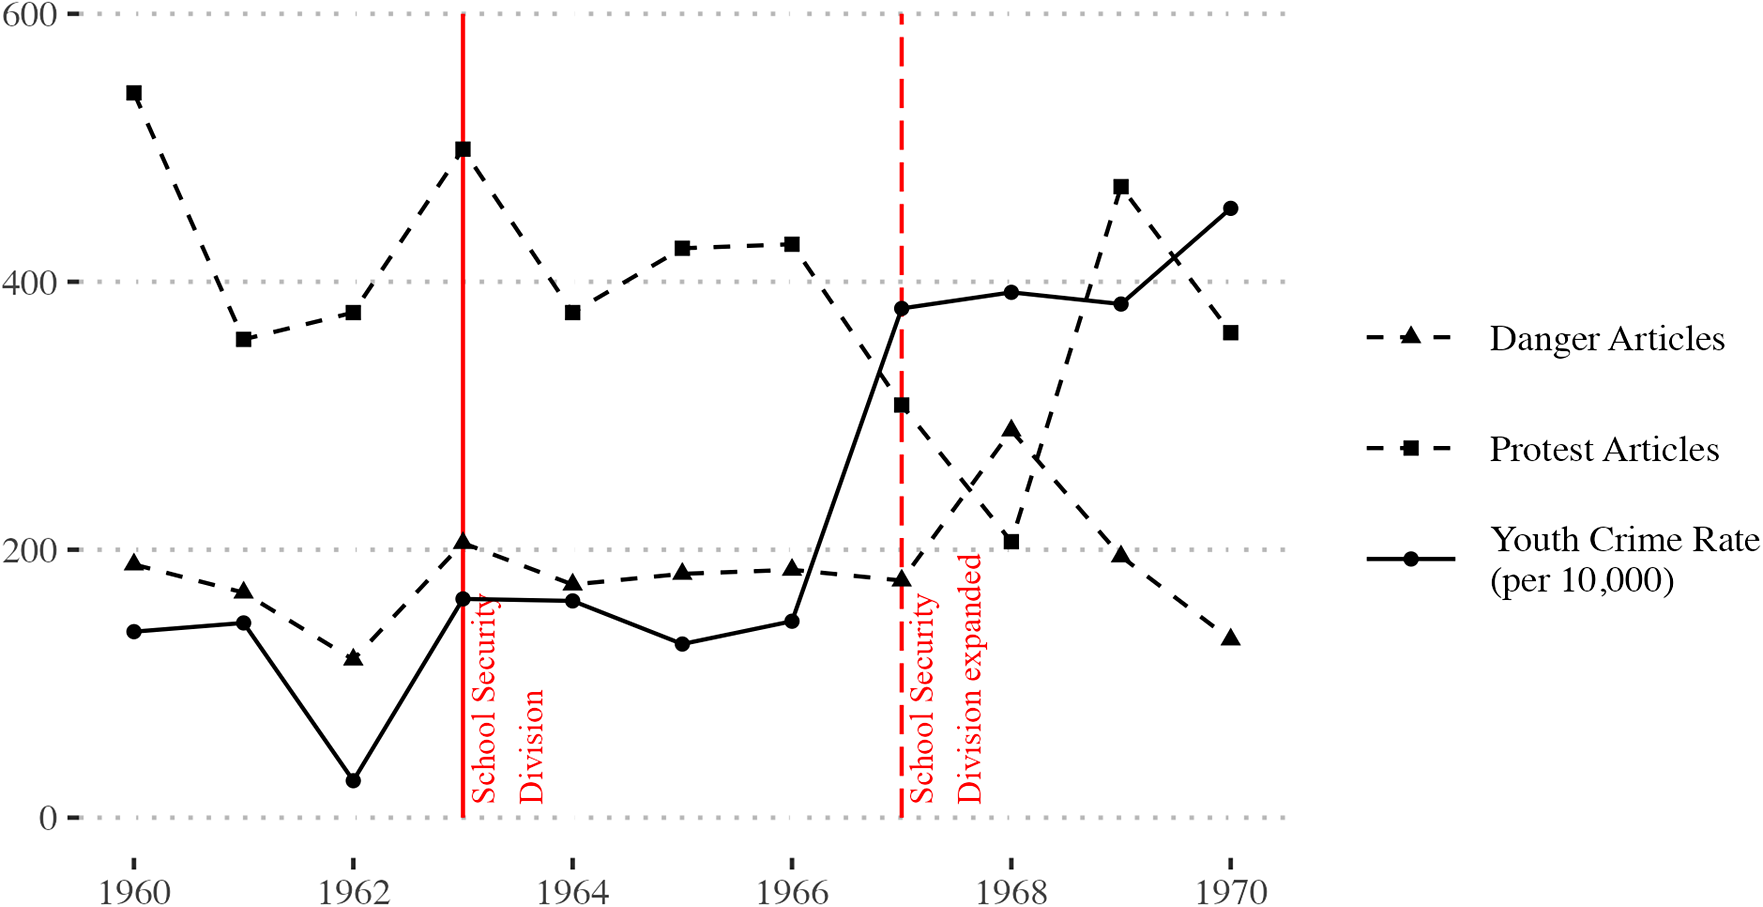
Like Philadelphia, Detroit officials cited the increases in crime as a primary reason for installing police in schools. In Figure 9 we provide contextual factors leading up to the stationing of school police in Detroit. The trend lines indicate time-series data, including the youth crime rate (solid black), newspaper coverage lines measuring Black youth-led protests (dashed with squares) and Black danger articles (dashed with triangles), and the percent Black student enrollment (dash dot). The vertical grey lines indicate important markers, including the SEP, the year of the Detroit uprising, mass school walkouts, the founding of the BSUF, the passage of Public Act 244. The solid grey vertical lines shows when the public school DI dropped below 0.8. The solid vertical red line indicated the year police were stationed in schools.
Events leading to the creation of Detroit School Police, 1960–1970
Enrollment data obtained from LDF Archives, Milliken v. Bradley. URL: https://ldfrecollection.org/content/archives/2b316ade-abe7-4909-8fbe-b42bfa32f11f
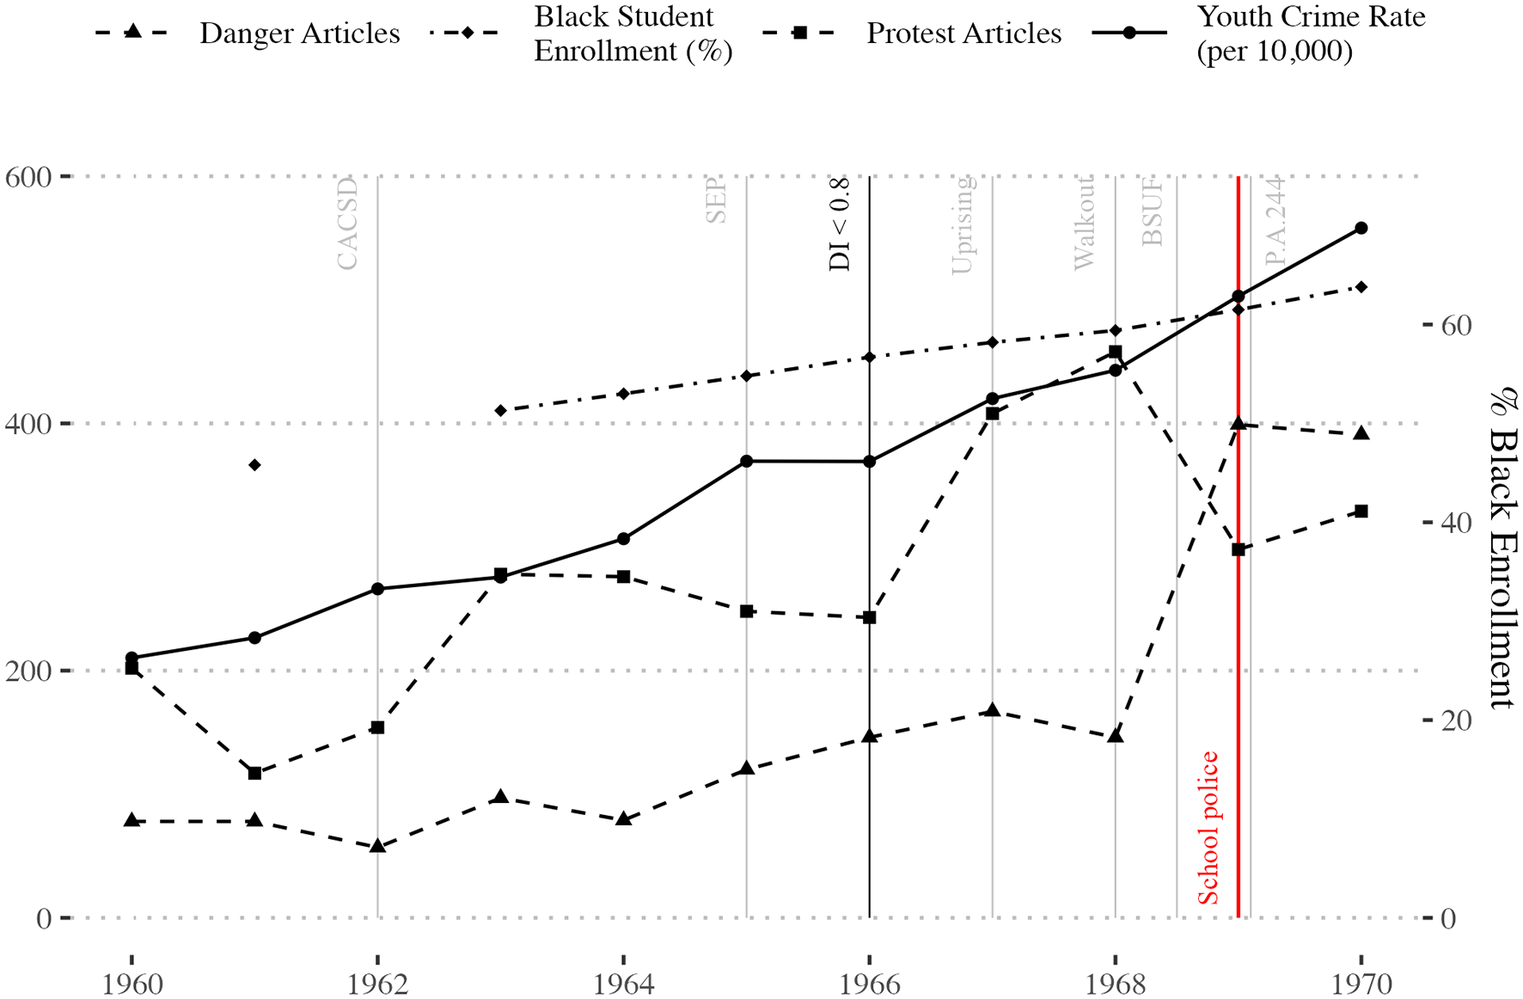
Figure 9. Long description
From left to right, the x-axis spans 1960 to 1970. The left y-axis ranges from 0 to 600 for youth crime rate per 10,000 and article counts. The right y-axis ranges from 0 to 60 percent for Black student enrollment. Four data series are plotted: youth crime rate (solid line with circles) rises steadily from about 200 to nearly 600; Black student enrollment (dashed line with diamonds) increases from about 35 percent to over 55 percent; protest articles (dashed line with squares) fluctuate, peaking near 1968; danger articles (dashed line with triangles) remain lower but rise after 1967. Vertical lines mark events: C A C S D, S E P, D I less than 0.8, Uprising, Walkout, B S U F, P A 244, and a red line labeled School police. The school police line appears just after 1968, coinciding with increases in youth crime rate and Black student enrollment.
Despite the unique circumstances of Detroit, the story leading up to the establishment of school policing follows a pattern in Philadelphia. While it was true that youth crime rates were rising, so too were youth protests, a portrayal of Black youth as dangerous, an increase in the Black student population, and various policies aimed at integrating the public schools. Again, we see that the implementation of school policing cannot be understood absent these events.
Los Angeles, CA
The Police School Liaison Program, established in Flint, MI, in 1959, is commonly referred to as the first school policing program (Girouard Reference Girouard2001). The first school policing program that we identified among the BCMs was implemented in Los Angeles over a decade earlier. At first glance, Los Angeles deviates from what we might expect: policing was established in 1949, more than two decades before most public schools were integrated, and its Black population remained in the single digits until around 1960. However, given that Los Angeles has long been home to a sizeable Mexican population and experienced battles for desegregation in two distinct time periods. It is not a far stretch to see how similar dynamics were at play.
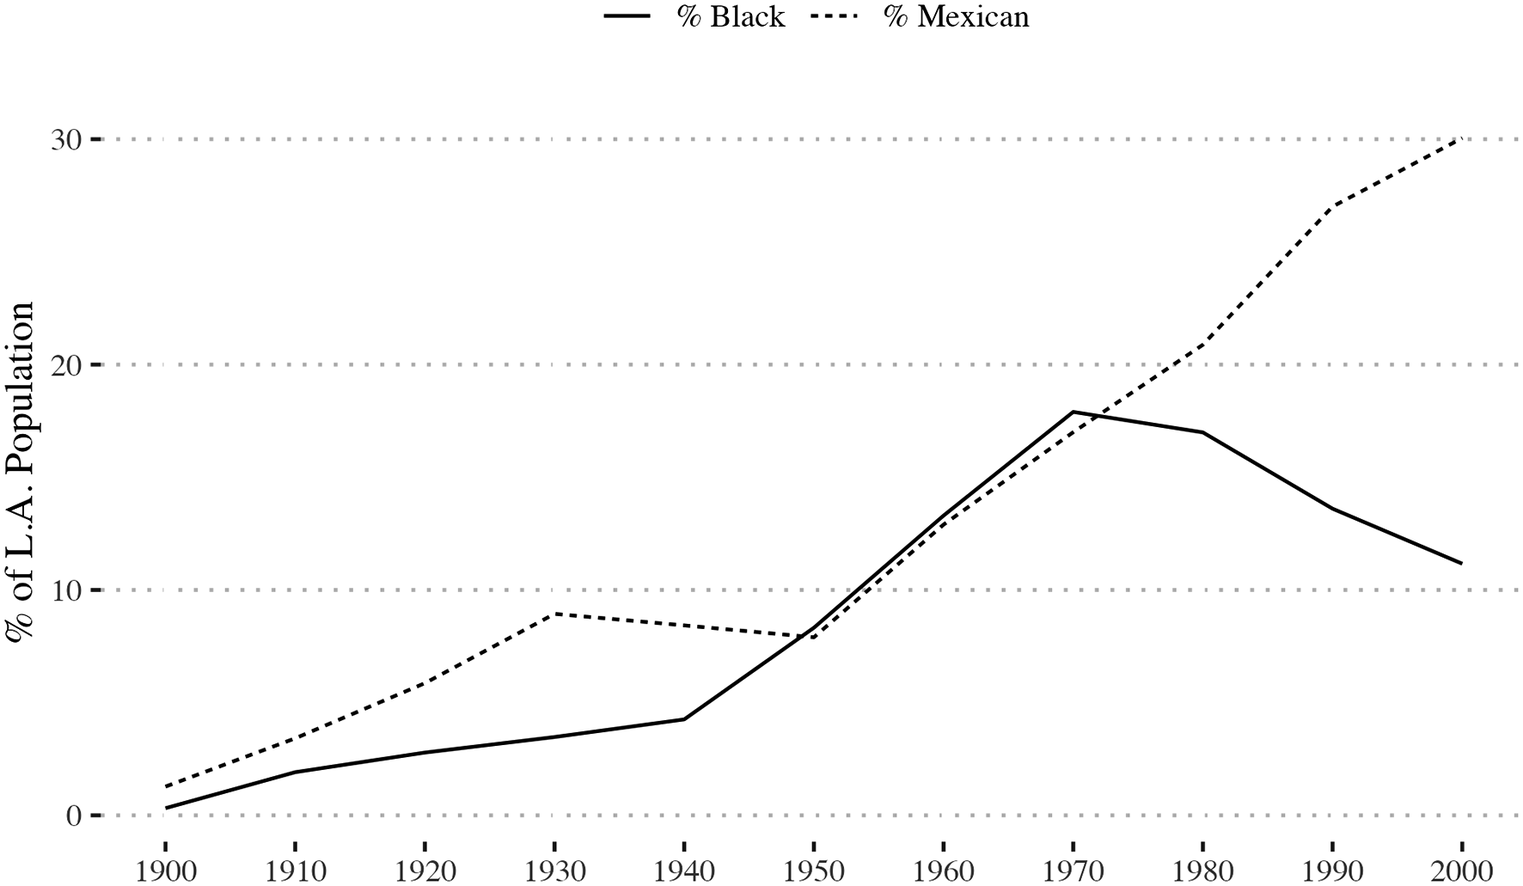
Los Angeles experienced major demographic and economic shifts in the early twentieth century. The population rose from just under 100,000 in 1900 to over two million in 1950. The Black population grew from fewer than 2,000 to just over 180,000. The Latine population increased from 2,500 to over 370,000, with most of the population of Mexican descent. By mid-century, Los Angeles was the Mexican capital of the United States (Romo Reference Romo1983). Figure 10 shows the percentage of Black and Mexican population in each census.
LA Black and Mexican population
Data from IPUMS USA data extracts, University of Minnesota.

Figure 10. Long description
The x-axis displays years from 1900 to 2000 in ten-year increments. The y-axis shows percent of L A population from 0 to 30 in increments of 10. The solid line for Black population starts near zero in 1900, rises gradually, peaks just above 20 percent around 1970, then declines to about 10 percent by 2000. The dashed line for Mexican population starts near zero, rises more sharply, surpasses the Black population after 1970, and continues to increase, reaching about 30 percent by 2000. Both lines show low values before 1940, with the Mexican population increasing more rapidly after 1960.
Following a rapid increase in the Mexican population through the first three decades of the Twentieth Century, in June 1943 racial stereotyping against Mexican Americans, systematic discrimination, and unjustified fear of Mexican American youth, spurred by racist depictions in media (del Castillo Reference del Castillo2000), culminated in what is widely referred to as the Los Angeles Zoot Suit riots. The violence took place for over a week, and the event is more accurately described as an attack by the U.S. military on young Pachucos (del Castillo Reference del Castillo2000).
One of the implications of the Los Angeles “Zoot Suit Riots” was a heightened awareness of systematic discrimination against Mexican Americans in education, housing, employment, and social services (del Castillo Reference del Castillo2000). This awareness led to efforts to desegregate schools for Mexican American students in California, predating Brown v. Board of Education of Topeka (1954) by seven years. Represented by Thurgood Marshall, Mendez et al. v. Westminster School District of Orange County et al. (1947) was the first case to successfully challenge segregation in federal court. Marshall argued that Sylvia Mendez, a Mexican American, was discriminated against based on ancestry and perceived language deficiencies by being turned away from an all-White California public school, violating her Fourteenth Amendment right to equal protection under the law. Subsequently, in June 1947, two months after the Ninth Circuit Court of Appeals ruled in favor of Mendez, Governor Warren signed the Anderson Bill, ending public school segregation of White and Mexican Americans in California. The Los Angeles Unified School District (LAUSD) Security Section was established the following year on October 1, 1948.
The Security Section had a two-fold purpose: “to protect school board property and to help possible juvenile delinquents become good and useful citizens” (Southwest Wave 1951). Ostensibly designed to decrease rising rates of vandalism and other crimes in Los Angeles Schools, the Security Section consisted of five “roving watchmen” who investigated “all cases of depredations” (Evening Vanguard 1949), and were directed to “apprehend criminals, juvenile and otherwise” (Southwest Wave 1949). Though not a permanent stationing of police in schools, the establishment of the Security Section with the power to arrest on school campuses marked the first step toward creating a policing apparatus targeted at students attending schools, making it the first school district to adopt school policing according to our definition. Relying on data from the Los Angeles Police Department (LAPD), we find little evidence of increased crime in the city.
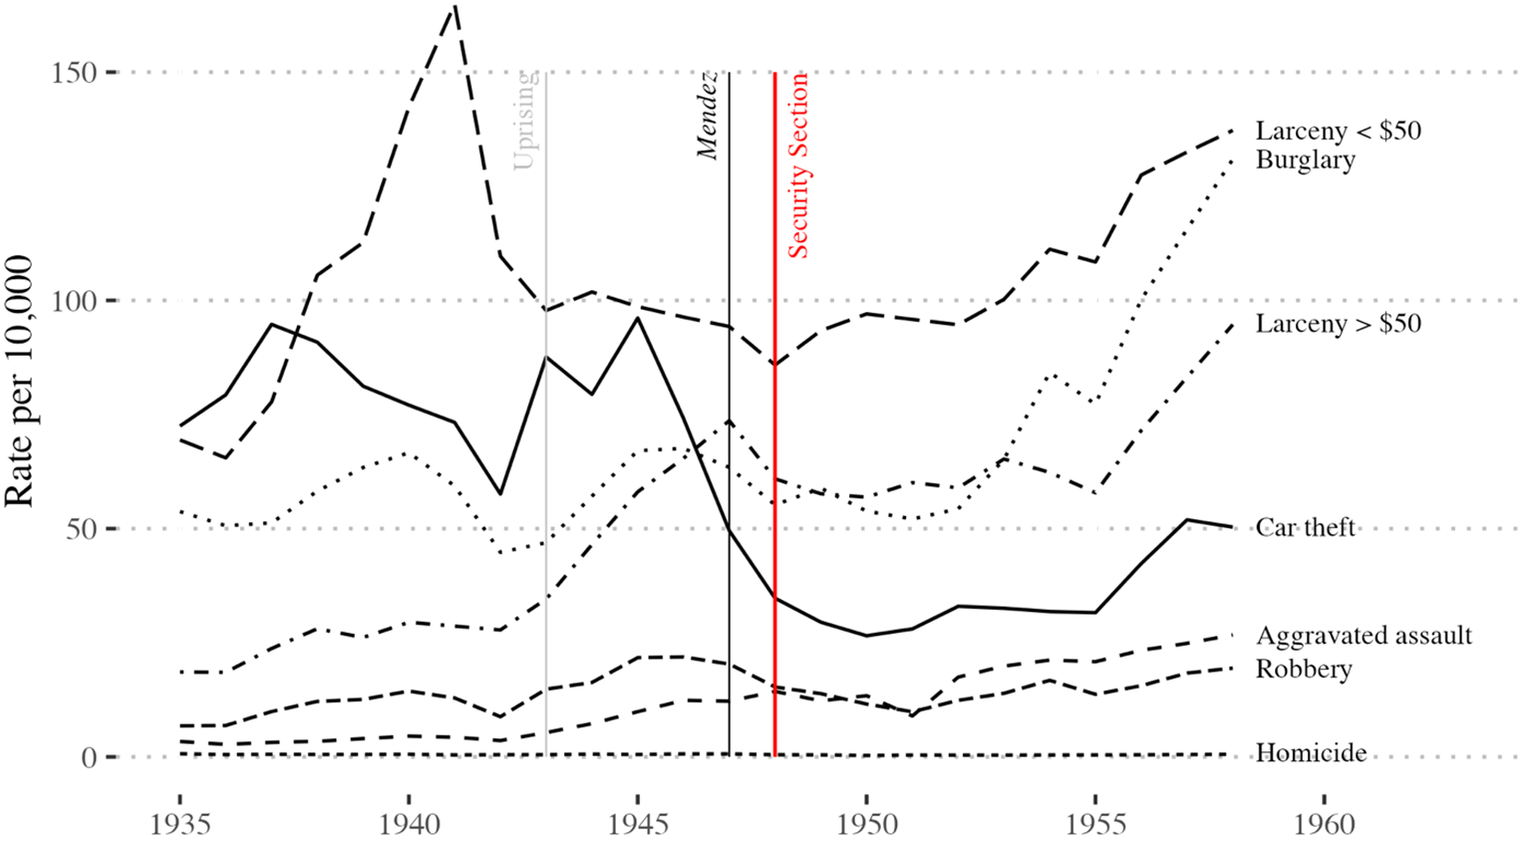
Figure 11 tracks the crime rates from 1935 to 1958. Each line corresponds to a different crime category, as indicated by the label to the right. The values represent the rate per 10,000 residents, except for car thefts, which are per 10,000 registered vehicles. The vertical lines indicate three significant events: the “Zoot Suit” uprising, the Mendez case prompting school integration, and the establishment of the Security Section.
Crime rate in the city of Los Angeles, 1935–1959
Data from LAPD Annual Reports and UCR Crime Reports.

Figure 11. Long description
The x-axis spans from 1935 to 1960, and the y-axis is labeled rate per 10,000, ranging from 0 to 150. Six crime categories are plotted: Larceny less than 50 dollars, Burglary, Larceny greater than 50 dollars, Car theft, Aggravated assault, Robbery, and Homicide. Larceny less than 50 dollars and Burglary are the highest, peaking near 150 around 1945, then declining and rising again after 1950. Larceny greater than 50 dollars and Car theft follow, with Car theft rising sharply after 1955. Aggravated assault and Robbery remain lower, with minor fluctuations. Homicide is consistently the lowest. Three vertical lines mark events: Uprising (circa 1943), Mendez (circa 1946), and Security Section (in red, circa 1948). Crime rates shift around these events, with notable peaks and declines.
Figure 11 shows a decline in crime rates across the city by the time the Security Section was established. Car theft rates were at the lowest point since the LAPD began reporting crime data. Larceny of less than $50, burglary, larceny of more than $50, and robbery had all declined in the five years leading up to the creation of the Security Section. Aggravated assault rose in the mid-1940s, but the overall rate was still very low, with only twelve per 10,000 residents reported. Eighty-six homicides were reported in 1940, and the number rose to a high of 119 in 1947 before declining to eighty-four by the year the Security Section was established. Contrary to the LAPD’s stated reasons, reported crime rates were declining, and we can identify no other indication that crime was widespread throughout the city. Nevertheless, the Security Section was expanded the following year, citing its tremendous success in reducing school depredations (Southwest Wave 1949).
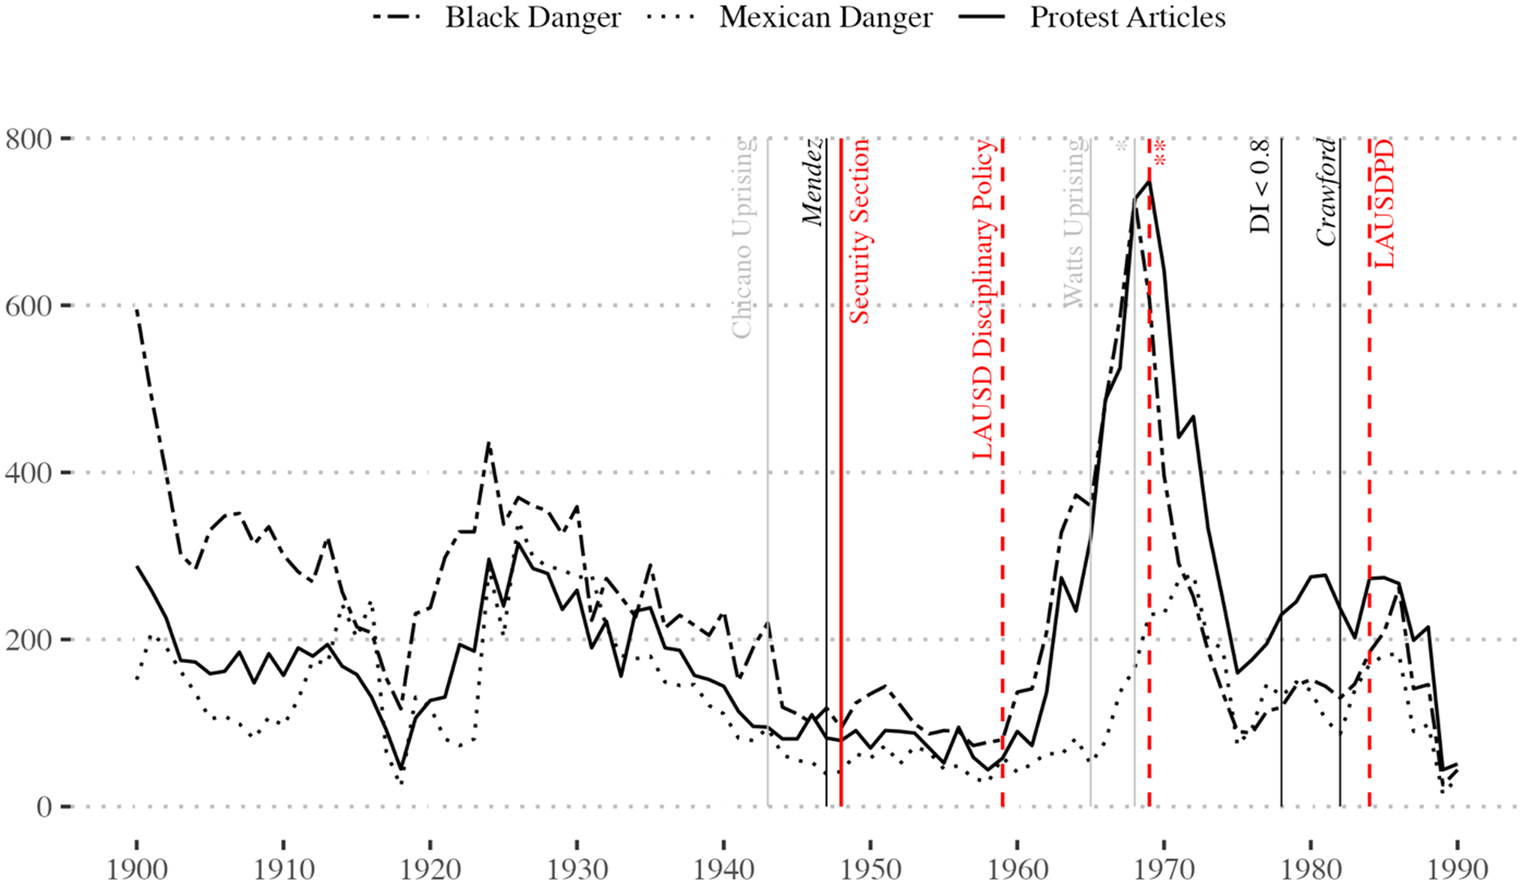
As the demography of the city continued to shift, with substantial increases in both the Mexican and Black population, there was a growing hysteria surrounding the criminality among the city’s youth, with an increasing focus on schools as being a prime site for intervention. Examining media coverage of Black and Mexican American youth highlights different periods of newspaper coverage using dangerous frames in the Los Angeles Times. With relatively high rates of dangerous newspaper framing for both groups in the 1930s, rising again beginning in 1960, reaching its peak in the late 1980s, and another uptick in the mid-1980s. We also annotate the Figure with notable events related to school protests and integration.
The uptick in danger frames for both Mexican and Black people very closely coincide with the number of protest articles, with slightly higher numbers of danger-framed articles referencing Black people across the time period. The high number of dangerous articles in the early 1900s correspond with the movement of Black and Mexican people into the city, as shown in Figure 10. Declines beginning in the 1930s happened alongside the plateau in each population size, and the increase in both dangerous frames and protest articles increase again with the fast rise in each population. Most importantly, Figure 12 shows that the creation and strengthening of school policing in Los Angeles (indicated by the various vertical red lines) comes at the heels of youth led protests and civil rights victories for the non-White population.
Danger articles appearing in the LA Times, 1930–1990
Note: The asterisks in the figure convey the following events: * School Blowouts; **LAUSD emergency procedures.

Figure 12. Long description
The x-axis shows years from 1900 to 1990, and the y-axis shows article counts from 0 to 800. Three lines are plotted: Black Danger (dash-dot), Mexican Danger (dotted), and Protest Articles (solid). All lines start high around 1900, drop sharply by 1910, and fluctuate with peaks near 1925 and 1940. The Protest Articles line rises steeply to a maximum near 1970, marked by a red asterisk, then falls. Vertical lines indicate events: Mendez, Security Section, LAUSD Disciplinary Policy, Watts Uprising, School Blowouts (red asterisk), DI less than 0.8, Crawford, and LAUSD PD. Red lines and text highlight policy changes and school events. The Black Danger and Mexican Danger lines show similar but lower peaks and less dramatic changes than Protest Articles. All lines decline after 1970.
In documenting the rise in disciplinary policies of the LAUSD, Araceli Centanino (Reference Centanino2021) notes that following several high-profile protests by Black youth, the LAUSD was swift in implementing disciplinary school policies, including the implementation of a district-wide disciplinary policy in 1959, which allowed for the use of corporal punishment and expanded grounds for suspensions and exclusions (Centanino Reference Centanino2021). While the 1959 disciplinary policy was written in a race-neutral manner, its application was highly racialized. Over the following decade, the LAUSD ramped up disciplinary policies and increased the Security Section’s capacity. By 1955, the Section had grown to twenty-two officers (Highland Park News-Herald 1955). In 1960, the Los Angeles Times reported that “more than 120 schools in the Valley are under constant surveillance by armed plain clothesmen of the school district’s security section” (1960).
Following almost a decade of discriminatory disciplinary practices by the LAUSD, Black and Chicano students staged a mass walkout known as the East Los Angeles School Blowouts in 1968, protesting LAUSD’s failure to implement a cultural curriculum (Bernal Reference Bernal1998). During the Blowouts, the Los Angeles Police Department coordinated with the Security Section and made Locke High School a police command (Los Angeles Times 1968), which outraged the American Federation of Teachers. The ease with which police could set up in a public school was facilitated by the policing infrastructure set up in 1948. The Blowouts marked the expansion of the Security Section in the 1960s, when plainclothes officers “ventured on campuses by day” (Helfand Reference Helfand1998, p. A15). In 1969, LAUSD enacted emergency procedures for “prompt arrest by school security officers” (Lincoln Heights Bulletin-News 1969). The policy allowed the arrest of any person who failed to comply with school administrators’ directives, with “reasonable time” defined as not exceeding “two to three minutes” (Lincoln Heights Bulletin-News 1969).
While the city went through waves of uprisings, the fight for desegregation continued with fierce intensity. Like the rest of the country, Los Angeles was exceedingly slow to make meaningful progress toward integrating its schools following the Mendez and Brown decisions. In 1963, the ACLU initiated a case on behalf of Black and Brown students to desegregate Los Angeles schools in Crawford v. Board of Education (1982). In 1970, the trial court found de jure segregation in violation of both the State and Federal Constitutions and ordered the school district to prepare a desegregation plan. In 1979, when the courts were considering a new plan that included mandatory pupil reassignment and busing, California voters ratified an amendment to the state Constitution that allowed desegregation efforts through busing only when the federal Constitution required it. In 1982, the U.S. Supreme Court held that the constitutional amendment was valid. Perhaps not coincidentally, in 1982 the officers transitioned to uniforms, and in 1984 the Security Section became a “full-fledged police department” (Helfand Reference Helfand1998).
Los Angeles exhibits the same patterns in establishing school policing. The rise in the Black and Mexican population were met with increased fears as demonstrated by the increased articles appearing in the city’s major newspaper framing youth as dangerous. The Mendez decision, compelling LAUSD to begin integrating public schools, prompted the city to begin the process of placing police in schools. Over the next few decades, protests continued sweeping through the city as both the Black and the Mexican Angelenos continued speaking out against injustices. In the 1980s, following another legal victory in the fight for school desegregation, the city took the final step in their dedication to school policing by creating the Los Angeles Unified School District Police Department (LAUSDPD).
Conclusion
In documenting and examining the origins of school policing across cities, we highlight that its establishment cannot be separated from the state’s racialized motivations. Crime rates were rising in some areas, but so were movements toward integration, Black student-led protests for educational equity, and rising fears of Black youth. Relying primarily on crime statistics to justify school police obscures these key dynamics and leads to expanding carceral infrastructures in schools that disproportionately harm Black students.
Focusing on when cities first placed police in schools, rather than later dates when school police departments expanded to their current form, allows us to critically examine the contextual factors that led to school districts taking the dramatic step of assigning police officers to surveil students in school. In each of the cases that we have presented, rather than listen to the demands of growing Black student populations, local elected officials feared Black bodies and used their power to create school policing programs that established the framework for today’s school policing infrastructure. While there are, of course, specific circumstances and unique factors to each locality, the broader trends hold constant across cities in their establishment of school policing, as demonstrated in our examination of large Black metropolitan areas.
This goes beyond exploring an intellectual curiosity and highlights troubling trends in the state’s carceral responses to Black youth. School policing programs expanded and were reinforced in the late 1980s when a highly racialized, unjustified moral panic on youth violence led to bipartisan support for bills that increased federal funding for school policing and required schools to implement zero-tolerance policies. These policies continue to disparately funnel Black and Latine students into the youth and adult punishment systems (Javdani Reference Javdani2019).
The number of law enforcement officers in schools is currently at an all-time high, and these officers remain concentrated in schools with high rates of low-income students of color (Harper and Cahill, Reference Harper and Cahill2018). In 1997, only ten percent of schools nationwide had a law enforcement officer—a figure that rose to fifty-eight percent by the 2017-2018 school year (Klein Reference Klein2020). In total, state and federal government funding for school resource officers since 1999 is close to $2 billion (Strategies for Youth 2019), and there are currently between 20,000 and 30,000 law enforcement officers in elementary, middle, and high schools throughout America (Fedders Reference Fedders2021). Black and Brown youth bear the burden of these carceral investments. Black students are disproportionately arrested and referred to law enforcement while attending school (Homer and Fisher, Reference Homer and Fisher2019), and students of color are disproportionately subjected to strict and harmful security measures, including the use of metal detectors and random searches of students and their property (Nance Reference Nance2017).
When we understand the social and political context in which school policing was created and the purpose it fulfilled within that context, racial disparities in the consequences of school policing are far less surprising. The origins of today’s school policing infrastructure are not based on crime prevention or intervention, they are rooted in the desire of the state to suppress Black and Brown student voice and quell their dissent. This knowledge should prompt us to reconsider plans to reform school policing and think more seriously about the need to abolish the practice altogether.
Acknowledgements
The authors would like to thank, first and foremost, Maria Fernandez, Jonathan Stith, Niya Kenny, and the National Campaign for Police Free Schools, co-convened by the Advancement Project and the Alliance for Educational Justice, for their research, organizing, and advocacy to protect youth. We thank participants at the 2023 Annual Conference of the National Conference of Black Political Scientists, Frank Baumgartner, Christopher Clark, Megan Rickman-Blackwood, Spencer Piston, and Adaku Onyeka-Crawford for their feedback on earlier versions of this article. We would also like to thank Louise Hoff for their research assistance. Finally, we would like to thank Sara Bruya for fantastic editorial assistance, and the editor and anonymous reviewers for their generous and insightful comments.
Appendix A
Table A1 provides the search terms used in historical newspaper analysis. We also indicate the figure number, newspapers in the search, and the database used.
Search terms for historical newspaper searches
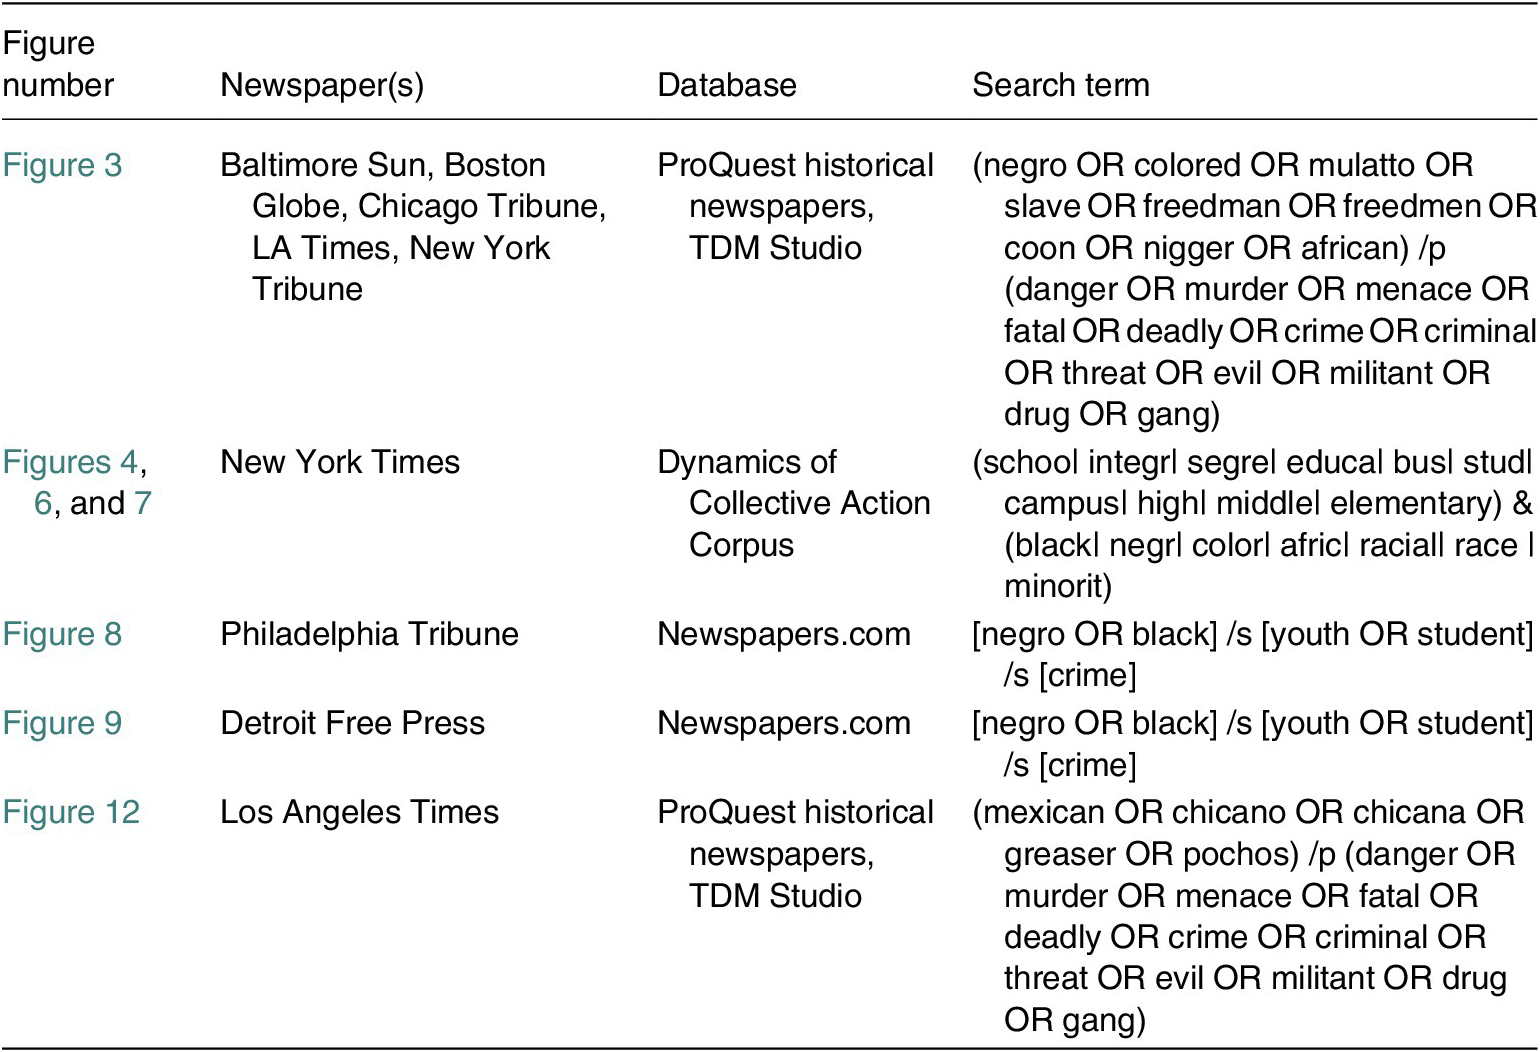
Table A1. Long description
The table has four columns. The first column, Figure number, lists: Figure 3; Figures 4, 6, and 7; Figure 8; Figure 9; Figure 12. The second column, Newspaper(s), lists: Baltimore Sun, Boston Globe, Chicago Tribune, LA Times, New York Tribune; New York Times; Philadelphia Tribune; Detroit Free Press; Los Angeles Times. The third column, Database, lists: ProQuest historical newspapers, TDM Studio; Dynamics of Collective Action Corpus; Newspapers dot com; Newspapers dot com; ProQuest historical newspapers, TDM Studio. The fourth column, Search term, lists: open parenthesis negro or colored or mulatto or slave or freedman or freedmen or coon or nigger or african close parenthesis forward slash p open parenthesis danger or murder or menace or fatal or deadly or crime or criminal or threat or evil or militant or drug or gang close parenthesis; open parenthesis schoo vertical bar integr vertical bar segre vertical bar educa vertical bar bus vertical bar stud vertical bar campus vertical bar high vertical bar middle vertical bar elementary close parenthesis ampersand open parenthesis black vertical bar negr vertical bar color vertical bar afric vertical bar racial vertical bar race vertical bar minorit close parenthesis; open bracket negro or black close bracket forward slash s open bracket youth or student close bracket forward slash s open bracket crime close bracket; open bracket negro or black close bracket forward slash s open bracket youth or student close bracket forward slash s open bracket crime close bracket; open parenthesis mexican or chicano or chicana or greaser or pochos close parenthesis forward slash p open parenthesis danger or murder or menace or fatal or deadly or crime or criminal or threat or evil or militant or drug or gang close parenthesis. A footnote states that T D M searches only include article, feature, front page or cover story.
TDM searches only include article, feature, front page/cover story
Appendix B
Establishment of school policing in Chicago, IL

Figure B-1. Long description
The x-axis shows years from 1960 to 1970. The y-axis shows counts from 0 to 1000. Three lines are plotted: Danger Articles (dashed line with triangles), Protest Articles (dashed line with squares), and Youth Crime Rate per 10,000 (solid line with circles). Danger Articles start near 250 in 1960, dip below 100 in 1961, then rise to about 300 in 1963, peaking near 350 in 1966, and declining to about 200 by 1970. Protest Articles start below 100 in 1960, rise sharply to a peak above 1000 in 1964, then drop to about 500 in 1966, and decline further to about 250 by 1970. Youth Crime Rate starts near 200 in 1960, rises steadily to about 400 by 1970. A vertical red line labeled School police marks 1966. A faint vertical line labeled D I less than 0.8 appears after 1966. The legend at the right identifies each line style and marker.
Establishment of school policing in Baltimore, MD

Figure B-2. Long description
The x-axis spans years 1960 to 1970, and the y-axis ranges from 0 to 600. Three data series are plotted: Youth Crime Rate (solid line with circles), Danger Articles (dashed line with triangles), and Protest Articles (dashed line with squares). Two vertical red lines are present: the first at 1963 labeled ‘School Security Division’, and the second at 1967 labeled ‘School Security Division expanded’. Youth Crime Rate starts near 150 per 10,000 in 1960, dips below 100 by 1962, rises sharply to about 180 in 1963, then remains steady until a sharp increase after 1967, peaking near 300 by 1970. Danger Articles fluctuate between 100 and 200, peaking at 200 in 1963, then declining steadily after 1967. Protest Articles start above 500 in 1960, drop to about 400 by 1962, spike to 500 in 1963, then remain around 400 until a decline after 1967. The legend on the right identifies each line style and marker.
Establishment of school policing in Boston, MA

Figure B-3. Long description
The x-axis shows years from 1960 to 1976. The y-axis shows counts from 0 to 1500. The dashed line with triangles represents danger articles, which rise sharply from about 1962, peaking near 1500 in 1970, then declining. The dashed line with squares shows protest articles, increasing gradually and peaking around 1970 at about 200, then decreasing. The solid line with circles shows youth crime rate per 10,000, which increases slowly and steadily from about 0 in 1960 to just over 100 in 1976. A vertical red line labeled ‘School police’ appears at 1970. The legend at the right identifies each line style and marker.