INTRODUCTION
Measuring the radiocarbon (14C) content of organic carbon (OC) in sediments is useful for understanding the sources and dynamics of the sedimentary OC in the aquatic environment (Griffith et al. Reference Griffith, Martin and Eglinton2010; Blair and Aller Reference Blair and Aller2012; Canuel and Hardison Reference Canuel and Hardison2016). In practice, obtaining the 14C content of OC in sediments requires first removing inorganic carbon (IC) by acid treatment. However, there is evidence that sample acidification can affect the measured total OC (Froelich Reference Froelich1980; Hedges and Stern Reference Hedges and Stern1984; Kennedy et al. Reference Kennedy, Kennedy and Papadimitriou2005; Komada et al. Reference Komada, Anderson and Dorfmeier2008; Brodie et al. Reference Brodie, Leng, Casford, Kendrick, Lloyd, Yongqiang and Bird2011) and total nitrogen (TN) contents (Kennedy et al. Reference Kennedy, Kennedy and Papadimitriou2005), as well as the stable carbon (13C) (Jaschinski et al. Reference Jaschinski, Hansen and Sommer2008; Komada et al. Reference Komada, Anderson and Dorfmeier2008; Brodie et al. Reference Brodie, Leng, Casford, Kendrick, Lloyd, Yongqiang and Bird2011), nitrogen (15N) (Kennedy et al. Reference Kennedy, Kennedy and Papadimitriou2005; Brodie et al. Reference Brodie, Leng, Casford, Kendrick, Lloyd, Yongqiang and Bird2011; Vafeiadou et al. Reference Vafeiadou, Adão, De Troch and Moens2013), sulfur (34S) (Connolly and Schlacher Reference Connolly and Schlacher2013), and 14C compositions (Komada et al. Reference Komada, Anderson and Dorfmeier2008) as a consequence of the various treatment procedures.
Two common treatments are “acid rinsing” and “acid fumigation.” The former approach involves direct acid titration using strong hydrochloric (e.g., ~1N HCl) or weak phosphoric (e.g., ~0.6 N H3PO4) acid and subsequent rinsing with Milli-Q water to neutralize the sample as well as remove hygroscopic salts (Komada et al. Reference Komada, Anderson and Dorfmeier2008; Brodie et al. Reference Brodie, Leng, Casford, Kendrick, Lloyd, Yongqiang and Bird2011). After completely drying, the sample can be analyzed on an elemental analyzer or combusted for further isotopic analysis (Kennedy et al. Reference Kennedy, Kennedy and Papadimitriou2005; Brodie et al. Reference Brodie, Leng, Casford, Kendrick, Lloyd, Yongqiang and Bird2011). Previous studies have tested different conditions (e.g., varying concentrations of HCl used to remove IC in the sediment; Brodie et al. Reference Brodie, Leng, Casford, Kendrick, Lloyd, Yongqiang and Bird2011) in order to evaluate changes in OC 13C composition (δ13C) during acid rinsing (Jaschinski et al. Reference Jaschinski, Hansen and Sommer2008; Komada et al. Reference Komada, Anderson and Dorfmeier2008; Ramnarine et al. Reference Ramnarine, Voroney, Wagner-Riddle and Dunfield2011). These studies demonstrated that some organic components may be lost during the rinsing process, thus influencing measured isotope ratios (Komada et al. Reference Komada, Anderson and Dorfmeier2008; Brodie et al. Reference Brodie, Leng, Casford, Kendrick, Lloyd, Yongqiang and Bird2011). Acid fumigation exposes samples to vaporous acid in a sealed desiccator to remove IC. Prior studies have examined variations in carbon isotopic composition after acid fumigation as a function of acid exposure duration (Komada et al. Reference Komada, Anderson and Dorfmeier2008; Brodie et al. Reference Brodie, Leng, Casford, Kendrick, Lloyd, Yongqiang and Bird2011), and concluded that isotopic compositions can vary depending on duration of fumigation as well as acid concentration. However, the question about how specific changes in OC components during the acid treatment lead to alteration of isotopic signatures remains unresolved, hindering our understanding of discrepancies in 14C contents between different acid treatments and selection of optimal IC removal methods.
A recently developed analytical approach allows separation of OC components in sediments by their thermochemical stability when exposed to a linear temperature program (Rosenheim et al. Reference Rosenheim, Day, Domack, Schrum, Benthien and Hayes2008). This method has been successfully applied to both river and ocean sediments and holds great potential for shedding new light on 14C age variations within sedimentary organic matter (OM) (Plante et al. Reference Plante, Beaupré, Roberts and Baisden2013; Schreiner et al. Reference Schreiner, Bianchi and Rosenheim2014; Williams et al. Reference Williams, Rosenheim, Allison, McNichol and Xu2015; Hemingway et al. Reference Hemingway, Galy, Gagnon, Grant, Rosengard, Soulet, Zigah and McNichol2017a; Bao et al. Reference Bao, McNichol, McIntyre, Xu and Eglinton2018a, Reference Bao, Strasser, McNichol, Haghipour, McIntyre, Wefer and Eglinton2018b). The methodology is relatively straightforward, involving ramped-pyrolysis-oxidation (RPO) followed by 14C analysis of evolved CO2 collected over user-defined temperature (time) windows. This simple yet effective approach can yield a broad spectrum of 14C ages that provides novel insight into the composition and age of organic components.
In order to address changes of 14C contents of OM after acidification, and to evaluate changes in the resulting OC concentrations and isotopic compositions under different acid treatments, we here apply the RPO technique to sediment residues prior to and after different acidification protocols. Focus is placed on the differences in OC 14C contents between two commonly used acid treatments—rinsing and fumigation. This study represents the in-depth results of the first systematic comparison of 14C contents of organic components after the two most common acid treatments.
MATERIALS AND PROCEDURES
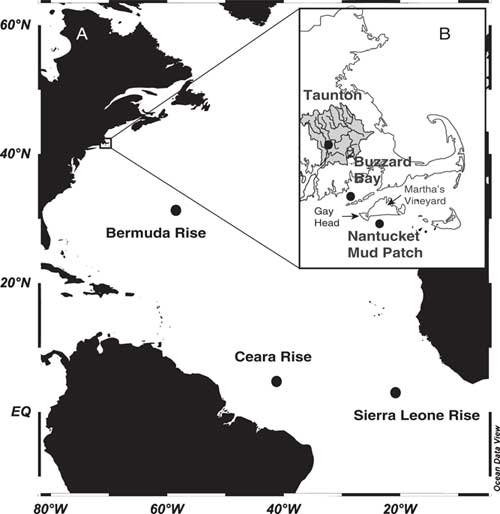
In this study, we selected six aquatic sediment samples that represent both marine and fluvial settings (Figure 1 and Table 1). Low carbonate marine sediments were obtained from the Nantucket Mud Patch (“Nan,” fine-grained sediment; Bothner et al. Reference Bothner, Spiker, Johnson, Rendigs and Aruscavage1981; Poppe et al. Reference Poppe, Commeau and Valentine1991) and Buzzards Bay (“Buzz,” silty-clay sediment; McNichol et al. Reference McNichol, Lee and Druffel1988); high carbonate deep-sea sediments were obtained from Bermuda Rise (“Berm”), Sierra Leone Rise (“Sierra”), and Ceara Rise (“Ceara”) (Martin et al. Reference Martin, McNichol and McCorkle2000); and one river suspended particulate matter (SPM) sample was obtained from the Taunton River (“Taun”). All sample materials were freeze-dried, homogenized, and preserved in a desiccator or dry box until analysis. All sample preparation and analyses were conducted at the National Ocean Sciences Accelerator Mass Spectrometry Facility (NOSAMS) at the Woods Hole Oceanographic Institution (WHOI).
Locations of all six samples with high (A) and low (B) carbonate concentrations.

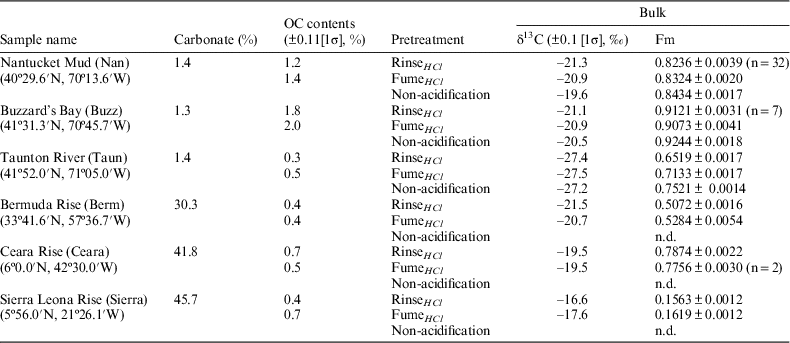
Sample locations and results of bulk measurements.

Note: n.d. indicates not determined.
Acidification Methods
Rinse HCl
The first acid treatment we used was HCl rinsing (Rinse HCl ). In this treatment, samples were first acidified and then rinsed with Milli-Q water prior to combustion. All glassware used was pre-combusted at 550°C for 5 hr prior to use. Each sample (~2–3 g dry weight) was weighed into a 60-mL glass centrifuge tube and 10 mL of 1.0 N HCl was added (Fisher Trace Metal Grade, A508-P212). After gentle agitation, the glass tubes were placed in a 60ºC water bath for 1 hr. The samples were then centrifuged (2500 rpm) and the aqueous acid solutions were carefully pipetted out. The above steps were repeated until no visible dissolution was present. To remove residual acid, Milli-Q water (10 mL) was added to the centrifuge tubes, which were then agitated, centrifuged, and decanted as above (repeated three times). Finally, the samples were vacuum filtered onto a pre-combusted GF/F filter (0.7 µm) using a glass funnel, placed into a petri dish, and dried (60ºC, 24 hr).
Fume HCl
The second acid treatment we used was HCl fumigation (Fume HCl ). Freeze-dried samples (~2–3 g dry weight) were weighed into 5 cm diameter pre-combusted glass petri dishes. A beaker filled with approximately 50 mL of 37% HCl (Fisher Trace Metal Grade, A508-P212) was placed at the bottom of a 250 mm ID glass desiccator, and samples were placed on a ceramic tray above the acid. The desiccator was evacuated and samples were treated at 60°C for 72 hr. To remove excess acid and residual chloride ions (that would otherwise corrode the RPO instrument), the samples were neutralized by replacing the acid beaker with ~20 g NaOH pellets in a pre-combusted petri dish after fumigation. The desiccator containing the acidified samples with NaOH pellets was again evacuated and placed in an oven (60°C, 72 hr). The acidified samples were stored in a drying oven (60°C) prior to analysis.
Bulk Measurements
Resulting total OC contents (TOC) and carbon isotopic compositions after both acid treatments (Rinse HCl and Fume HCl ) were determined using an elemental analyzer (Costech, ECS 4010). Samples (~20 mg) were weighed into 5×9 mm tin capsules and combusted in the elemental analyzer at 1025oC. The generated CO2 was trapped cryogenically, separated from the helium carrier gas, and stored for 13C and 14C measurements (McNichol et al. Reference McNichol, Osborne, Gagnon, Fry and Jones1994). The precision (standard deviation, σ) of measured TOC content is 0.11 % (1σ, n=26). Approximately 7% of the gas was taken for stable isotope determination via isotope ratio mass spectrometry on either a VG Optima or VG Prism dual-inlet stable isotope ratio mass spectrometer. δ13C values, reported in per mille notation (‰) relative to Vienna Pee Dee Belemnite (VPDB), were determined with precision better than±0.1 ‰ (1σ). The remaining CO2 was reduced with H2 to filamentous (graphitic) carbon using standard procedures (McNichol et al. Reference McNichol, Gagnon, Jones and Osborne1992; von Reden et al. Reference von Reden, McNichol, Pearson and Schneider1998) and 14C analysis was conducted at NOSAMS (Longworth et al. Reference Longworth, von Reden, Long and Roberts2015). 14C data are reported using Fraction modern (Fm) notation and corresponding errors are shown in Table 1 and Figure 2.
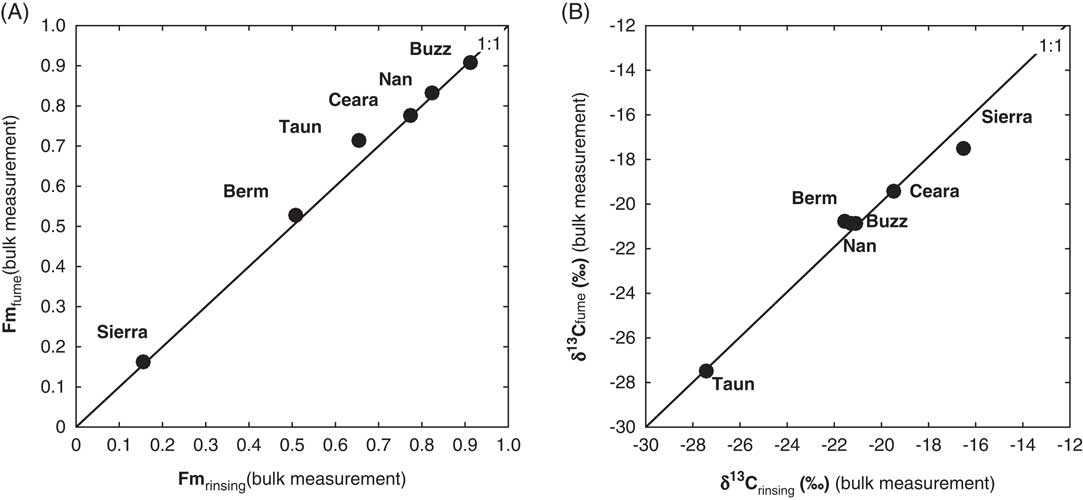
Cross-plots of bulk measurements (A: Fm and B: δ13C) between Rinse HCl and Fume HCl .

Ramped Pyrolysis/Oxidation (RPO)
Unacidified and acidified samples were analyzed using the RPO system at NOSAMS. Pre-weighed samples (~35–400 mg) were loaded into a pre-combusted quartz reactor, and subjected to a constant rate of temperature increase (5°C min–1) until reaching 900°C. Evolved gases were simultaneously oxidized and removed from the reactor using a carrier gas mixture of O2 and He (~8 % O2, 35 mL min–1 total flow rate). Gases other than CO2 that are deleterious to the analysis (e.g., SO2, vapor HCl) were subsequently removed by passage over CuO, Ag, and MnO catalyst (“chemical oven”) held at isothermal conditions (~520ºC) (Froelich Reference Froelich1980; Fry et al. Reference Fry, Peltzer, Hopkinson, Nolin and Redmond1996). No significant isotopic fractionation was observed as a consequence of this step (see Supplementary Material for further details). Downstream of the chemical oven, a continuous record of evolved CO2 was obtained via a flow-through infrared CO2 analyzer (Sable Systems International Inc., CA-10a). The evolved CO2 was collected within five different temperature intervals (Tn; indicated in Table 2 and Figure 3 and 4, except that Taun sample has six thermal intervals). After isolation, the individual CO2 fractions were further distilled and quantified using standard vacuum line techniques and sealed into combusted glass tubes with ~50 mg CuO and 10 mg Ag granules. Tubes were subsequently combusted (525ºC, 1 hr) as a final gas purification step prior to isotopic measurement. CO2 was then split into two aliquots for 13C and 14C analyses.
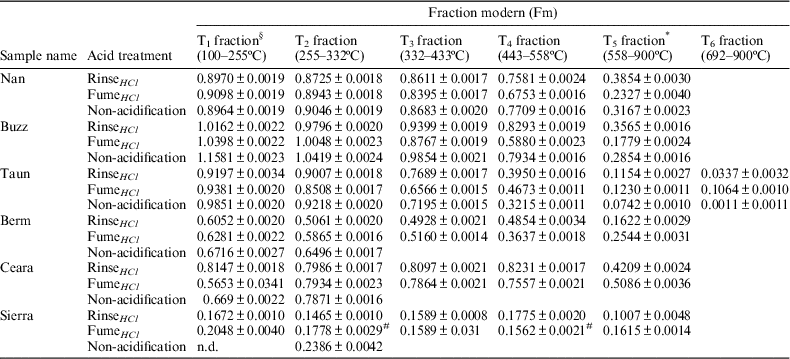
Radiocarbon data of each thermal fraction among acidified and non-acidified samples.

* T5 fraction in Taun sample is a range of temperature (558–692ºC).
§ T1 fractions in Nan, Taun, and Ceara sample start from 120ºC, T1 fraction in Sierra starts from 157ºC. T5 fractions in Sierra and Ceara sample stops at 835ºC and 723ºC, respectively. The non-trapped CO2 account for <1% of total mass, which do not affect the mass balance results shown in supplementary Figure S1.
# Indicates that results are average values (n=2).
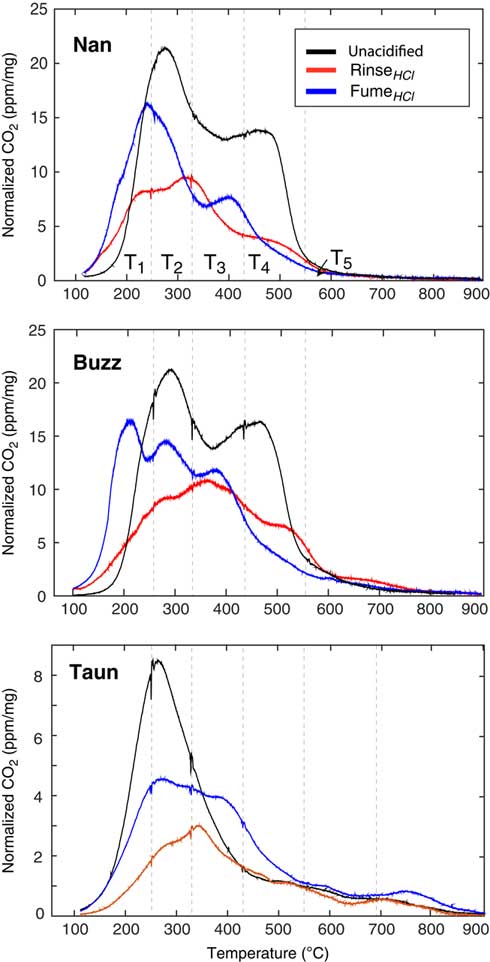
Thermograms displaying CO2 evolution for the acidified and unacidified samples with low carbonate content during RPO. The dotted lines show temperature interval “windows.” The CO2 concentrations are normalized by the mass of sediments loaded into the RPO instrument. Taking Nan sample as an example, T1, T2, T3, T4, and T5 are labeled.

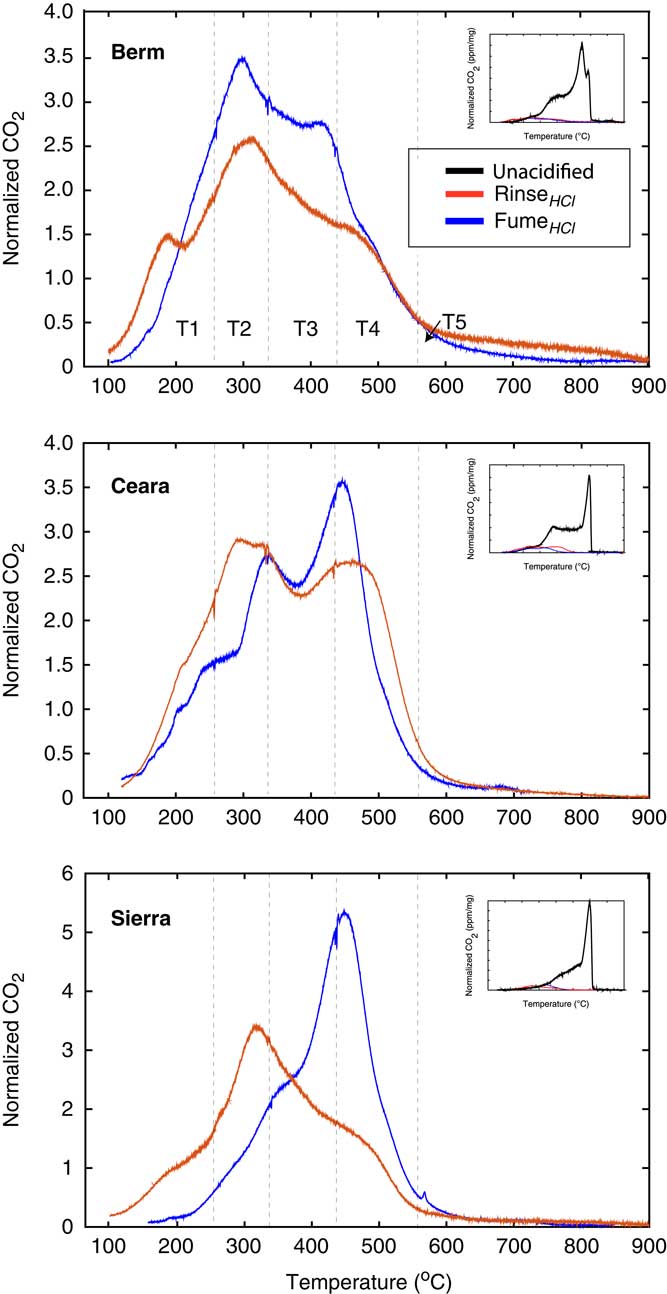
Thermograms displaying CO2 evolution for the acidified and unacidified samples with high carbonate content during RPO. The dotted lines show temperature interval “windows.” The inserts show the full Y axis scales. The CO2 concentrations are normalized by the total mass. Taking Berm sample as an example, T1, T2, T3, T4, and T5 are labeled.

RESULTS AND DISCUSSION
The results from carbon isotopic analysis of bulk unacidified, Rinse HCl , and Fume HCl samples are listed in Table 1, with discrepancies between two acidification methods highlighted in Figure 2. The offsets of Fm values range from 0.0614 ±0.0034 (Taun) to 0.0048±0.0072 (Buzz); the offsets of δ13C values range from <0.1 (Ceara) to 1.0‰ (Sierra). In low-carbonate sediments, bulk Fm and δ13C values of unacidified samples are generally higher than those of sediments subjected to either acidification method (Table 1). This likely reflects the presence of biogenic IC that is enriched in 14C (younger 14C age) and 13C (higher δ13C) relative to OC. Indeed, modern biogenic carbonates (e.g., mollusk shells, foraminiferal tests) in coastal and riverine settings, likely contribute to the enriched carbon isotopic compositions (Fm > 1, Druffel et al. Reference Druffel, Honju, Griffin and Wong1986; McNichol and Aluwihare Reference McNichol and Aluwihare2007; δ13C=~ 0 ‰, Meyer Reference Mayer1994; Martin et al. Reference Martin, McNichol and McCorkle2000). Thus, IC in unacidified samples contributes to the enrichment in isotopic composition for bulk measurements.
However, based solely on bulk results from unacidified and/or acidified samples, it is difficult to evaluate whether or how the different acidification methods influence the 14C results. In order to better understand underlying factors, we utilize RPO to examine the isotopic differences of thermally separated components of the OM before and after acidification. This study yields improved insights into changes in the content and isotopic distribution of OC introduced by different methods of IC removal. The RPO analyses of samples after Rinse HCl and Fume HCl and corresponding unacidified samples show different thermograms (Figure 3 and 4). In the low-carbonate samples, the Fume HCl thermograms contain more carbon than those after Rinse HCl (integrated area ratios of Rinse HCl thermograms to Fume HCl thermograms: 0.8:1 (Nan), 0.8:1 (Buzz), and 0.6:1 (Taun)). The major difference between the thermograms from the two methods occurs in the relatively low temperature windows (e.g., T1 and T2) (Figure 3). In contrast, for the high-carbonate samples, the greatest differences are seen in the relatively higher temperature windows (e.g., T3 and T4). Tables 2 and 3 summarize the variability of Fm and δ13C values among thermal windows obtained from both low- and high-carbonate samples.
Low-Carbonate Samples
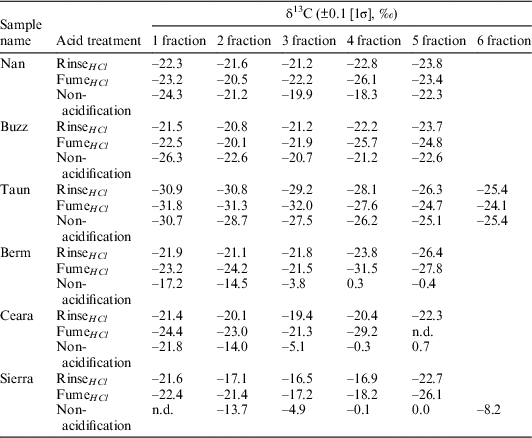
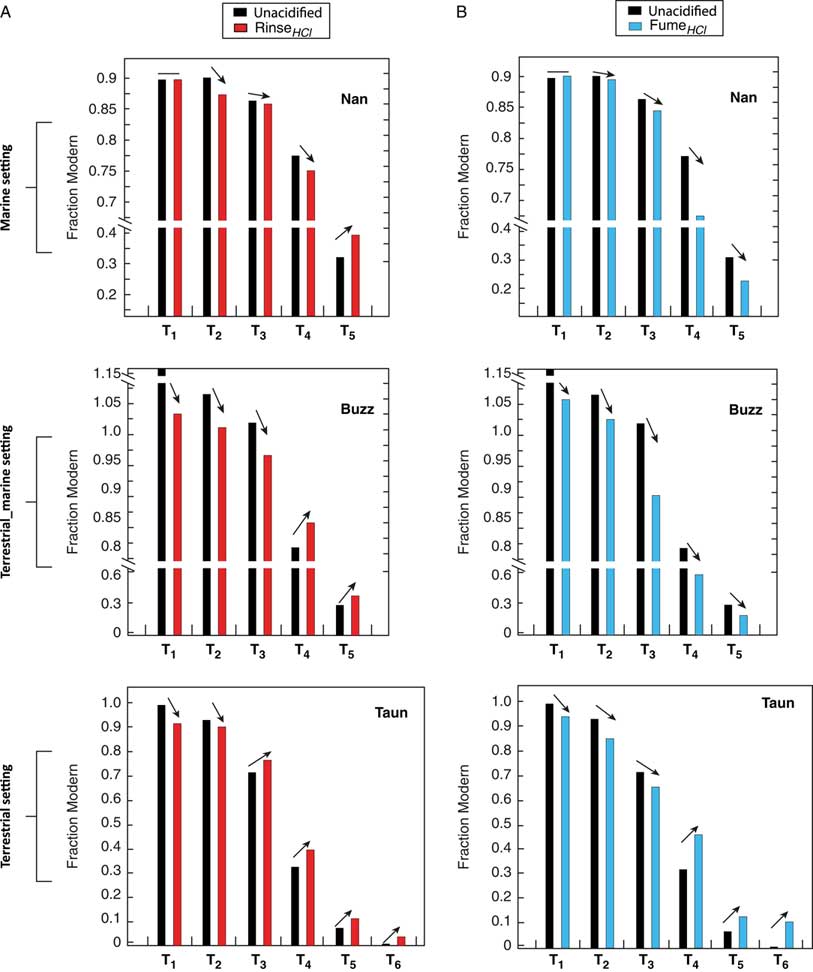
We find that the Fm values of low temperature fractions following Rinse HCl treatment are lower relative to those of corresponding fractions from unacidified samples (Figure 5A). It is possible that IC with higher Fm values contributes to all the thermal fractions of unacidified samples. However, this is not supported by associated δ13C data, since δ13C values of the lowest temperature fractions (T1) of unacidified Nan and Buzz samples are lower than those in the corresponding Rinse HCl fractions (Table 3). The above therefore implies that influences of (residual) IC are not primarily responsible for the Fm offsets between unacidified and Rinse HCl samples. The thermograms of low-carbonate samples subjected to Rinse HCl produce markedly less CO2 (i.e. the integral of CO2 concentrations during RPO) than the corresponding unacidified samples (Figure 3). Acid treatment can lead to removal of OC in addition to IC during Rinse HCl , likely either through solubilization or acid hydrolysis (Brodie et al. Reference Brodie, Leng, Casford, Kendrick, Lloyd, Yongqiang and Bird2011; Harris and Juggins Reference Harris and Juggins2011). For example, hydrolysis, in the presence of dilute acid, can convert esters present in macromolecules into a carboxylic acid and an alcohol (Charton Reference Charton1975; Li Reference Li1993); these soluble and labile compounds may be removed during the rinsing process (Komada et al. Reference Komada, Anderson and Dorfmeier2008). The decrease in Fm value of low temperature fractions (Figure 5A) likely reflects the removal of organic material with relatively high Fm (i.e. young) during the Rinse HCl method. According to the definition of thermal stability and nature of OM from Capel et al. (Reference Capel, de la Rosa Arranz, González-Vila, González-Perez and Manning2006) and reference therein, the OC decomposed at <400oC is considered as “labile OC.” The data collected here suggest that application of the Rinse HCl method to low-carbonate samples can lead to the loss of young, thermally labile, OC. The amount lost will depend on the chemical characteristics of OM in the low-carbonate sample. While thermal stability of OM in sediment does not completely represent the chemical stability, the former can reflect the latter (Kleber et al. Reference Kleber, Nico, Plante, Filley, Kramer, Swanston and Sollins2011). Therefore, the accuracy of OM 14C measurements using Rinse HCl is related to the overall thermal, and likely chemical, lability of OM within samples.
Stable carbon isotopic composition data of each thermal fraction among acidified and non-acidified samples.

Comparisons between unacidified vs. Rinse HCl (A panels) and unacidified vs. Fume HCl (B panels) Fm values for all thermal fractions from low-carbonate samples.

The Fm values of the highest temperature windows for low-carbonate samples (Nan and Buzz) under Rinse HCl are higher than those of the unacidified ones (Figure 5A). The δ13C values of the T5 fractions under Rinse HCl are higher than those of corresponding unacidified fractions (Table 3). The finding implies a loss of old and 13C enriched material during Rinse HCl , either carbonate or 13C-enriched organic material. Fm values for different thermal windows generally decrease with increasing temperature (Table 2), indicating that the thermally recalcitrant OM is older (lower Fm values). The observed changes of Fm and δ13C values of the highest temperature windows indicate the loss of some older and refractory components, with relatively enriched 13C, during Rinse HCl . These losses must be small based on the minor shift in the thermograms. It is not possible for us to distinguish if the material loss is carbonate or OM. A potential source of old carbonate near the Nan and Buzz samples is siderite from Gay Head in Martha’s Vineyard. Outcrops of older sedimentary carbonate rock may be eroded and deposited in Buzzards Bay and the Nantucket Mud Patch. However, this is unlikely based on the reported absence of siderite in Nan sediments (Poppe et al. Reference Poppe, Commeau and Valentine1991).
Application of the Fume HCl method to the coastal marine sediments (Nan and Buzz samples) results in lower Fm values for almost all thermal fractions relative to their unacidified counterparts (Figure 5B, the T1 fraction from Nan sample is the exception). One potential explanation is degradation of 13C- and 14C-enriched OC during Fume HCl . Although the Fume HCl method does not include a rinsing step, there is a potential for OM to be degraded. Since HCl can react with OM, especially at the relatively high temperature used in the acidification (>60ºC) (Csapá et al. Reference Csapá, Csapó-Kiss, Wágner, Tálos, Martin, Folestad, Tivesten and Némethy1997), we suspect that younger OC enriched in 13C is lost through the hydrolysis of labile OM (Trumbore and Zheng Reference Trumbore and Zheng1996; Schmidt and Gleixner Reference Schmidt and Gleixner2005). Additionally, the low-carbonate samples do not reveal any discrepancy between reconstructions of CO2 isotopic compositions from RPO mass-balance under Fume HCl and corresponding bulk values (supplementary Figure S1). The δ13C values for the high temperature fractions, where the influence of IC removal is expected to be the greatest, under Fume HCl are lower than corresponding windows from the unacidified aliquots (Table 3), indicating that IC is effectively removed during Fume HCl . We suggest that the observed decreases of Fm values under Fume HCl relative to their unacidified counterparts do not result from potential remains of IC, but from degrading younger and labile components and leaving more refractory organic parts that may be more depleted in 13C and 14C. As with the Rinse HCl results, we find that the Fm values of the low temperature fractions following Fume HCl are lower relative to the corresponding fractions in the unacidified samples. The themograms in the low temperature range of the low carbonate samples after Fume HCl generate more CO2 than those after Rinse HCl but smaller than the unacidified samples (Figure 3). We speculate that Fume HCl removes OM, particularly in thermally labile fractions.
The variability in Fm values for the different treatments of the riverine sample (Taun) differs from the coastal marine sediments (Figure 5). In the higher temperature fractions (T5, T6), the Fm and δ13C values using Fume HCl are both higher than those in their unacidified fractions (Table 2 and 3). We speculate that the different patterns of variability in Fm values between Nan and Buzz, and Taun samples are likely related to the environmental matrix. The OC from the marine samples is primarily marine, while the OC from the river sample is mainly terrestrial. The distinct OC sources are likely an important factor influencing the Fm values measured on OM after Fume HCl (Brodie et al. Reference Brodie, Leng, Casford, Kendrick, Lloyd, Yongqiang and Bird2011). A broad distinction may exist between deep oceanic vs. terrestrially-involved marginal samples in terms of their susceptibility to different acid hydrolysis methods (Roland et al. Reference Roland, McCarthy and Guilderson2008) as indicated by distinct Fm values of carbohydrates and amino acids. Studies of more samples from different environmental and depositional settings will be required to fully investigate the influence of Fume HCl on Fm values of refractory OC in low-carbonate samples.
Rinse HCl versus Fume HCl for Low-Carbonate Samples
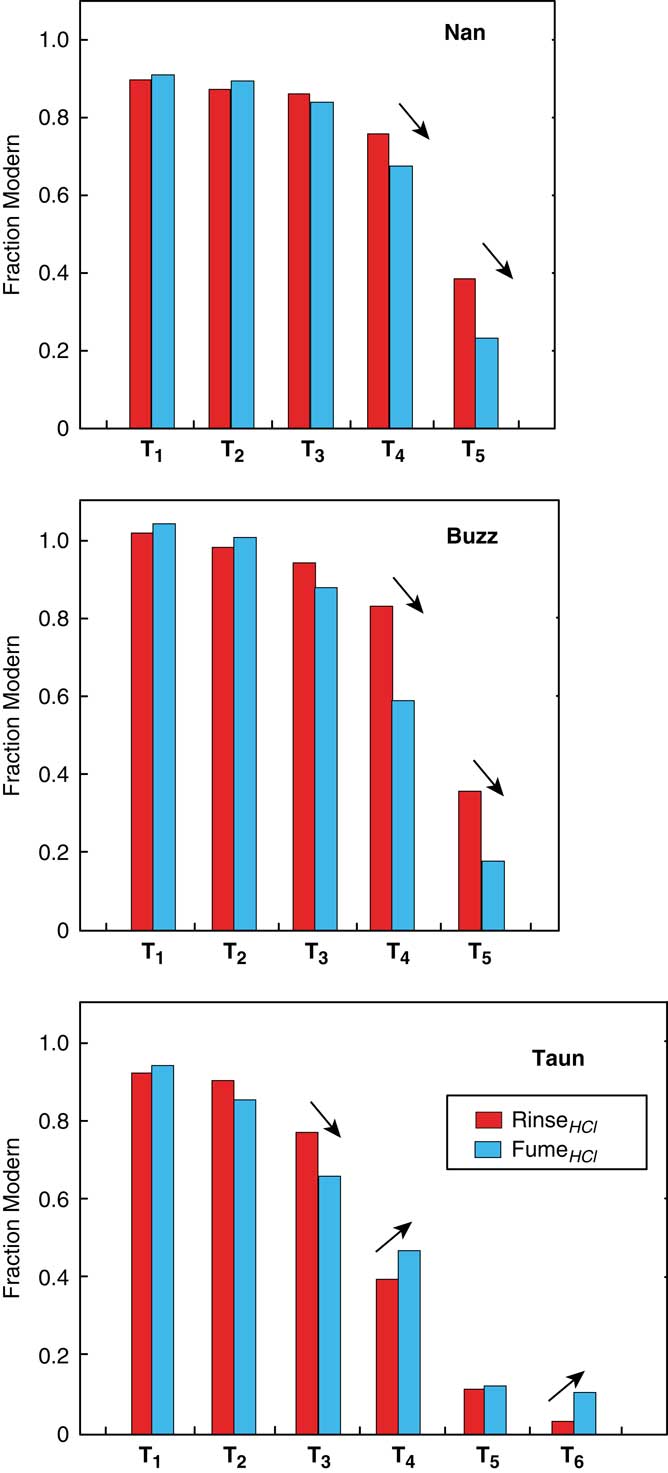
Bulk Fm offsets between Fume HCl and Rinse HCl fall within 2σ of each other (standard deviation) (Figure 2A), but RPO analysis indicates the methods have different impacts on the OC (Figure 3). RPO yields for the samples treated with Fume HCl are greater in the low temperature range than for those treated with Rinse HCl . Rinse HCl has a greater impact on labile OM than Fume HCl . The Fm values of T1 fractions after Fume HCl are slightly higher (younger) than those after Rinse HCl (Figure 6), yet, the offsets are not marked. This suggests that both methods have a similar impact on the Fm values of OC in samples with mostly labile and younger OC. In contrast, the highest temperature windows show marked Fm differences for Nan and Buzz samples. The Fm values of high temperature fractions after Rinse HCl are higher (younger) than those after Fume HCl , suggesting that Fume HCl may remove the more relatively 14C-enriched components from refractory OM in marine sediment, compared with Rinse HCl . This implies that samples containing more thermally stable, i.e. refractory, OC will show greater differences between the two methods. An implication of this finding is that thermally labile OC is 14C homogeneous but thermally refractory OC is more heterogeneous. Results from the riverine sample (Taun) show more modest differences, and in opposite directions to those of coastal marine sediments. Overall, these findings suggest that the application of either method to low-carbonate samples comprised mostly of labile OM will result in similar Fm values. However, samples containing a marked proportion of refractory OM may yield different Fm values depending on the method employed as well as the environmental and depositional conditions.
Comparisons of Fm values for thermal windows of low-carbonate samples under Rinse HCl and Fume HCl .

High-Carbonate Samples
Compared with low-carbonate samples, removing IC from high-carbonate samples is more difficult (Phillips et al. Reference Phillips, Johnson, Miranda and Disenhof2011). Due to the high abundance of IC in unacidified samples, their RPO thermograms are characterized by large total peak areas (Figure 4B, inserts). We did not make 14C measurements on the high temperature fraction of these samples. In high carbonate samples, IC may start to decompose at lower temperatures than expected based on thermodynamics due to non-first-order decay (Rosengard Reference Rosengard2017; Hemingway et al. Reference Hemingway, Rothman, Rosengard and Galy2017b). The δ13C results suggest that IC can be present in even the lowest temperature interval in some instances (T1, Berm) (Table 3). The δ13C results also indicate that IC is effectively removed by both acidification methods.
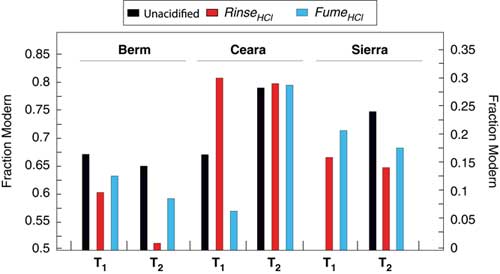
We note that the T1 window from the Ceara sample under Rinse HCl has a higher Fm (0.8147±0.0018) value than the same interval in the unacidified sample (0.6690±0.0022; Figure 7 and Table 2). Due to their similar δ13C values (–21.4‰ and –21.8‰, respectively), we suggest that that Rinse HCl removes relatively low Fm components from the thermally labile OM (T1, lowest temperature window) in this sample. We cannot make similar inferences for the Berm and Sierra samples, because the δ13C data do not support the suggestion. In the Berm sample, the δ13C value of T1 windows of unacidifed Berm sample is much higher (–17.2‰) than that of corresponding Rinse HCl sample (–21.9‰), and, in the Sierra sample, we do not have the δ13C data. Nevertheless, the Ceara results indicate that it is possible for high-carbonate samples to lose relatively old organic components during Rinse HCl processes (Komada et al. Reference Komada, Anderson and Dorfmeier2008).
Comparisons of low-temperature fraction Fm values resulting from Rinse HCl , Fume HCl , and unacidified treatments for high-carbonate samples. Berm and Ceara samples response to left y-axis, Sierra sample responses to right y-axis.

After Fume HCl , the δ13C values of the T1 fractions are lower than after Rinse HCl (Table 3). If Rinse HCl completely removes IC in the T1 windows as discussed above, we can infer that Fume HCl also removes IC completely in this window. Similarly, we also note that the T1 window from the Ceara sample under Fume HCl (0.5653 ±0.0341) has lower Fm values than the T1 windows in the corresponding unacidified sample (0.6690±0.0022, Table 2), suggesting that Fume HCl may remove OM with a relatively high Fm. It is likely that acid hydrolysis contributes to the change in the Fm value of labile OC after Fume HCl . IC reacts with HCl to produce H2O and CaCl2 during Fume HCl . Since CaCl2 is hygroscopic (i.e., it absorbs water), this can lead to the formation of a concentrated acid pool in the petri dish containing the sample. Compared with the short duration (1 hr) of Rinse HCl treatment, the markedly longer sample exposure time period during Fume HCl (i.e., 72 hr) may lead to high in situ acid concentrations, favoring hydrolysis that can change the 14C content of OC. Results from Komada et al. (Reference Komada, Anderson and Dorfmeier2008) support this interpretation, as they indicated that fumigation time is an important factor when considering the consequences of acidification. Our results indicate that Fume HCl affects the Fm results in an unpredictable manner (Table 2). In summary, Rinse HCl and Fume HCl both affect the Fm values of OC in the high-carbonate samples, probably causing the increasing and decreasing corresponding Fm values for labile organic components, respectively. Due to the overwhelming IC contribution in the higher temperature windows of unacidified samples, we cannot compare the Fm results in these fractions and make conclusions about the influence of two acidifications on the Fm values of refractory OM.
Rinse HCl versus Fume HCl for High-Carbonate Samples
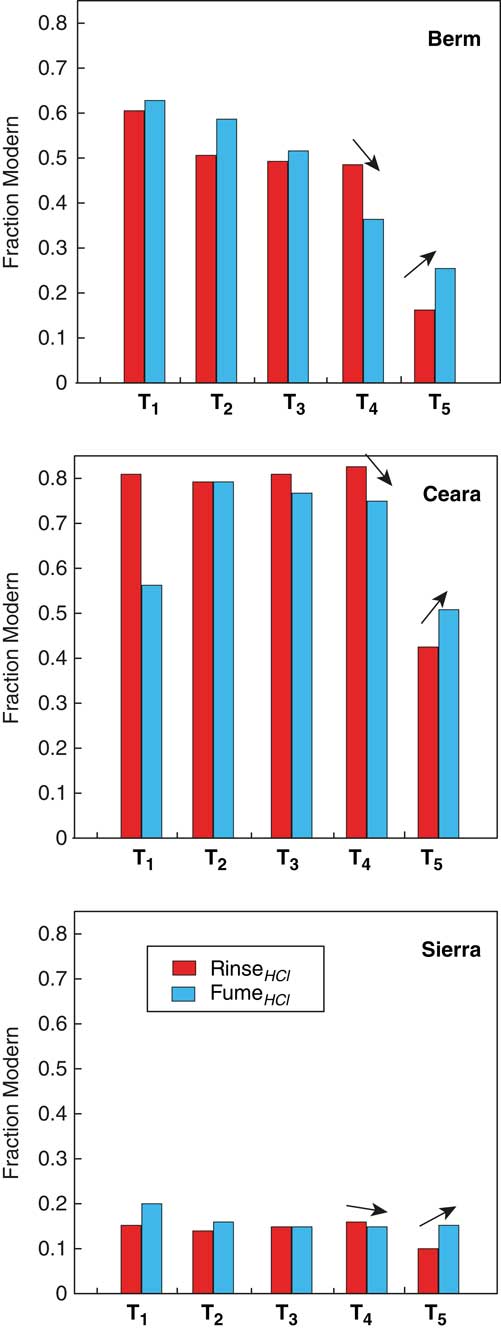
We compare the Fm values of corresponding RPO thermal windows of three high-carbonate samples under Fume HCl and Rinse HCl . The Fm values of T4 window after Rinse HCl are higher than those after Fume HCl ; in contrast, the Fm values of T5 window after Rinse HCl are lower than those after Fume HCl (Figure 8), suggesting that the methods have opposite effects on Fm values for the thermally refractory organic components. Since the T4 fraction contains much more carbon than T5, we suggest that Fume HCl will produce lower Fm values for the thermally refractory OM than Rinse HCl . For the low temperature fractions, the measured Fm values do not show clear a trend between the two methods (Figure 8).
Comparisons of Fm values for thermal windows of high-carbonate samples under Rinse HCl and Fume HCl .

Factors Influencing 14 C Results during Acidification Treatment
IC abundance in the samples is an important factor differently influencing the 14C contents under Rinse HCl or Fume HCl . For instance, Rinse HCl appears to result in greater removal of young components from labile OM pools in low-carbonate samples but old components in high-carbonate samples. Nevertheless, Fume HCl can cause Fm values of labile organic components to decrease regardless of IC abundance. These differences in Fm values of OC between the two acidification methods are likely dependent on the mineralogy (Komada et al. Reference Komada, Anderson and Dorfmeier2008) and abundance of IC (Philips et al. Reference Phillips, Johnson, Miranda and Disenhof2011) in the samples. Further studies spanning a greater range of IC contents would improve our understanding of the role of IC on 14C contents following pretreatment, especially with respect to Rinse HCl .
We find that the proportions of labile and refractory OC in sediment samples may influence the impact of the acidification method on bulk OC Fm values. For instance, we find no marked effect of either acidification method on measured Fm values of labile OM in low-carbonate samples, implying that samples dominated by labile OM will likely yield similar bulk OC Fm values when prepared by either acidification method. In contrast, if a sample contains mostly refractory OM (e.g., river samples with a large percentage of refractory OC; Hemingway et al. Reference Hemingway, Hilton, Hovius, Eglinton, Haghipour, Wacker, Chen and Galy2018), bulk Fm values under two methods will likely be different. We think that RPO can be a good screening method for choosing an appropriate acidification treatment for a suite of similar samples by defining heterogeneous 14C contents in a sediment sample. Alternative less direct methods, such as determining the C/N ratio, can be used to define OC heterogeneity before measuring 14C content. The C/N ratio can be used to distinguish between algal and land-plant origins of sedimentary OM, and selective degradation of organic components during early diagenesis (Meyers Reference Meyers1994).
In addition, the environmental matrix of samples should also be considered when choosing an acidification method. For low-carbonate samples, results from the marine and river samples exhibit distinct differences in Fm values under Rinse HCl and Fume HCl (Figure 5). This might reflect differing proportions of labile and refractory OC, with varying susceptibility to acidification conditions. Physical factors of sediment matrix can also indirectly affect the labile and refractory OC preservation (Zonneveld et al. Reference Zonneveld, Versteegh, Kasten, Eglinton, Emeis, Huguet, Koch, de Lange, De Leeuw and Middelburg2010). For instance, sediment grain size (Bao et al. Reference Bao, McIntyre, Zhao, Zhu, Kao and Eglinton2016, Reference Bao, McNichol, McIntyre, Xu and Eglinton2018a), density (Wakeham et al. Reference Wakeham, Canuel, Lerberg, Mason, Sampere and Bianchi2009), and mineral surface area (Mayer Reference Mayer1994) may control the partitions of labile and refractory OC preservation in the sample. In addition, during rinsing processes under acidic condition, differing physical protections might affect the extent of labile OC lost. The potential influences of sediment matrix on carbon isotope composition during the pretreatments need be considered as well as studied further. Additionally, intrinsic chemical characteristics of different OM components might determine their susceptibility to hydrolysis during acidification (Trumbore and Zheng Reference Trumbore and Zheng1996; Schmidt and Gleixner Reference Schmidt and Gleixner2005). For instance, proteins, amino acids, and polysaccharides are particularly prone to hydrolysis and/or condensation reactions during acid-treatment (Li Reference Li1993; Sun and Cheng Reference Sun and Cheng2002). In summary, RPO analysis has provided insights into the impact of different acid treatments on the 14C content of sedimentary OM, but further research is needed to fully understand the factors influencing the impact of acidification.
CONCLUSIONS
This study provides a systematic comparison of the influence of two common acid treatment methods on the isotopic composition of OC in sediment samples from environmental settings ranging from riverine to marine and characterized by a wide range of carbonate contents (<1.5% to >30.3%). We show that the 14C contents of residual OM are affected by both acid-treatments. Based on the analytical approaches (bulk-level measurements and RPO) and range of sample types used in this study, we conclude:
∙ For low-carbonate samples, Rinse HCl and Fume HCl methods can lead to the loss of young labile OC, leaving the residual OC older.
∙ For high-carbonate samples, it is possible to remove relatively old OC during Rinse HCl processes and increase the Fm value of remaining material. Fume HCl may remove more young material than Rinse HCl (e.g., labile OC) leading to lower measured Fm values on sediment.
∙ Overall, there appear to be multiple factors that influence the Fm values of OC under different acidification pretreatments. We identify three factors (at least) that influence the measured 14C content of sedimentary OM: IC abundance, proportions of labile and refractory OC, and environmental matrix. We thus recommend taking these factors into account when selecting and applying acidification methods in order to yield consistent results and informed interpretation of resulting data.
For the determination of 14C content in low-carbonate samples, Fume HCl is recommended over Rinse HCl because less OC is lost with this method. For high-carbonate samples, Rinse HCl is recommended because of the complications introduced by high concentrations of hygroscopic salts and the absence of large differences between the results from the two methods. We also recommend choosing a straightforward pre-screening method (e.g., RPO, C/N ratio) to assess the potential 14C heterogeneity of OC prior to acidification for further 14C measurements.
ACKNOWLEDGMENTS
We thank the suggestions and comments of reviewers. This study is supported by Doc. Mobility Fellowship (P1EZP2_159064 to R.B.) from the Swiss National Science Foundation (SNSF), and by SNSF “CAPS-LOCK” project 200021_140850 (T.I.E.) and the National Science Foundation Cooperative Agreement for the Operation of a National Ocean Sciences Accelerator Mass Spectrometry Facility (OCE-0753487). We thank Alan Gagnon, Li Xu, Fabian Batista, Dana Gerlach and the rest of the NOSAMS staff for their support with technical assistance and carbon isotopic measurements for this project. We thank the two anonymous reviewers for their careful reading of our manuscript and their many insightful comments.
Supplementary material
To view supplementary material for this article, please visit https://doi.org/10.1017/RDC.2018.125