


1. Introduction
Tropical glaciers exist in South America (from Bolivia to Venezuela), Africa and Oceania (west Papua). The Andes mountain range is home to ∼99% of these tropical ice masses (Reference Kaser and OsmastonKaser and Osmaston, 2002). Of the 2500 km2 of tropical glaciers in South America, 70% are found in Peru, 20% in Bolivia and 10% in Ecuador, Colombia and Venezuela. In the tropics, the 0.1 °C atmospheric isotherm remains practically at the same altitude throughout the year, allowing glacier front ablation at any time (Reference Kaser and OsmastonKaser and Osmaston, 2002), in contrast to glaciers at higher latitudes.
Mountain glacier distribution is controlled, fundamentally, by two factors: precipitation and altitude. Mountain ranges ‘block’ air-mass humidity, forcing precipitation, and promoting glacier-forming conditions. The second factor controls the equilibrium-line altitude (ELA), as glaciers will only form where the ELA is below mountain summits (Reference ClappertonClapperton, 1993).
Some studies indicate that tropical glaciers are affected by regional climate variability. In the Andes, for example, glaciers exhibit a strong retraction during the positive phase of El Nino Southern Oscillation (ENSO) events (Reference Francou, Caceres, Gomez and SorucoFrancou and others, 2007). There is also evidence of strong glacial retraction for the past three decades along the full Andean mountain range due to atmospheric warming. This phenomenon reflects a glacial retraction rate increase and glacier thickness reduction, leading to the disappearance of many tropical glaciers (Reference Arenas and CadenaGTNH, 2010). The volume losses of mountain glaciers may be the clearest indicator of the rapid (if not accelerated) nature of climate change on a global scale (Reference Francou, Ribstein, Wagnon, Ramirez, Pouyaud, Huber, Bugmann and ReasonerFrancou and others 2005; Reference Lemke and SolomonLemke and others, 2007).
There are many reasons to maintain interest in the study of Andean glaciers. They are important indicators of climate change. They also affect almost all the South American regional hydrologic regimes, particularly those that present dry seasons (e.g. southern Peru and Bolivia). In low-precipitation years, ice melt maintains minimum water flow levels, thus ensuring water supply to urban centres and hydroelectric power plants (Reference Marengo, Herzog, Martınez, Jørgensen and TiessenMarengo and others, 2011).
This study determines ice extent variations at Nevado Illimani, Bolivia, from 1963 to 2009 using digital photogrammetry techniques. The results are compared with net accumulation rates obtained from ice cores extracted from the same ice mass (Reference RamırezRamirez and others, 2003). We then propose an interpretation of the recent environmental history (last 46 years) of the region based on the remotely sensed and ice-core data.
2. Study Area
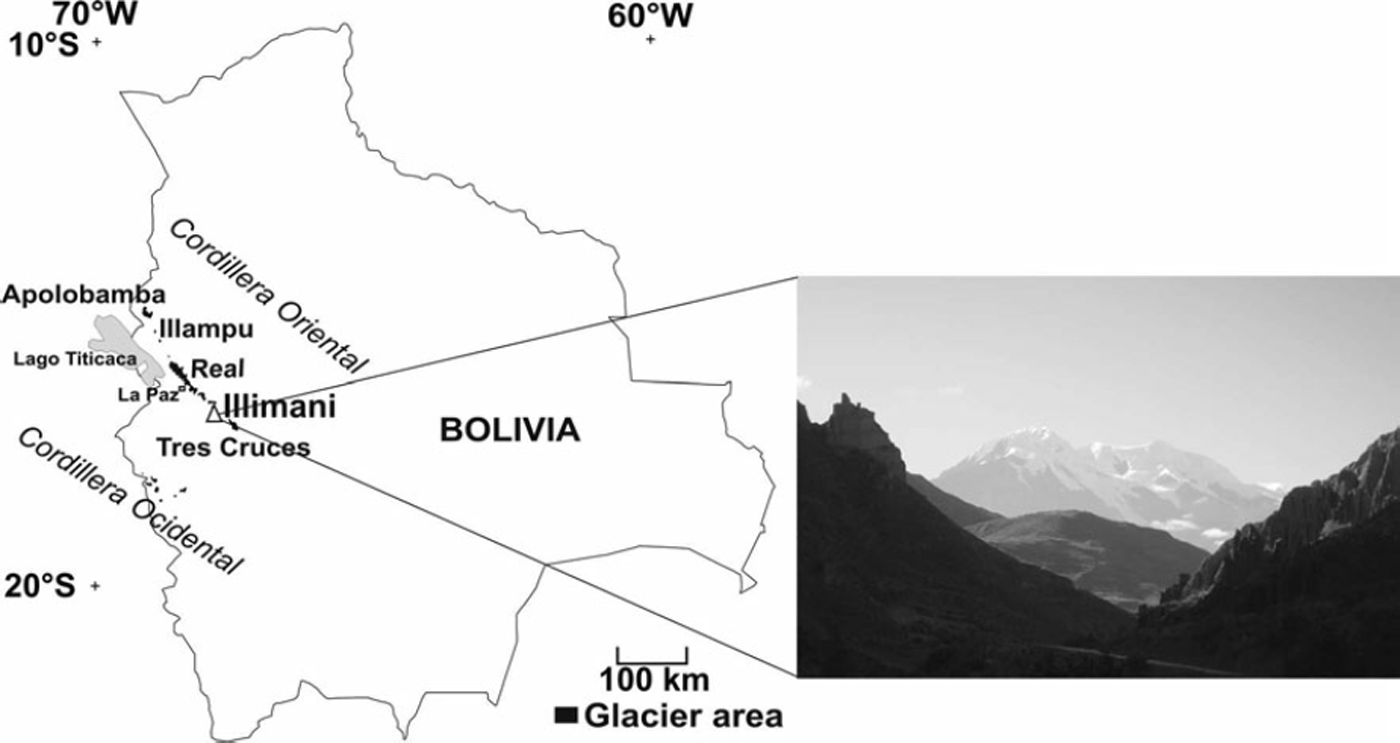
There are two main mountain ranges in Bolivia that are home to glaciers: the Cordillera Ocidental (Western Cordillera), which is formed by extinct volcanoes with crater glaciers and small isolated ice-covered peaks, and the Cordillera Oriental (Eastern Cordillera), with ∼600km2 of glaciers. The Cordillera Oriental has four constituent parts: Apolobamba, Real, Munecas and Tres Cruces/Nevado Santa Vera Cruz. Most types of glaciers are present, from ice caps and valley glaciers to small mountain glaciers (Reference Jordan, WIlliams and FerrignoJordan, 1998; Fig. 1). Our study site, Nevado Illimani, Bolivia (168380S, 678440W), is set within the mid-eastern sector of the Bolivian Andes, locally known as Cordillera Real. This mountain is 50 km south of La Paz and 180 km from Lake Titicaca. It is one of the oldest tertiary plutonic bodies in the westernmost sector of the Andes and is the product of lava intrusions. It has been greatly eroded by the La Paz river and its tributaries (Reference Jordan, WIlliams and FerrignoJordan, 1998). Its dimensions are ∼10km x4km, with some peaks over 6000ma.s.l. (e.g. Pico del Indio, Pico Layco Kkollu). Twenty-six glaciers were selected to represent a comprehensive range of size, aspect and elevation.
Location of Nevado Illimani, Cordillera Real, Bolivia.
Precipitation in this region occurs mainly during the austral summer (80% of annual precipitation), due to the humid air masses coming from the Amazon River basin (Reference Vuille, Bradley, Werner and KeimigVuille and others, 2003). In the dry season, corresponding to the austral winter (June-August), the prevailing wind directions are north and northwest. Extratropical precipitation events during the dry periods are attributed to the cold air masses flowing from Argentina, which originate from Antarctica. Reference VuilleVuille (1999) showed that in rainy seasons during El Nino events, the Bolivian Andes present negative precipitation anomalies. In La Nina years, the precipitation tends to be above average.
The decrease in precipitation during El Nino events delays snowpack formation. This, in turn, ‘exposes’ the glacial surface to solar radiation, promoting a more intense ablation process. According to Reference Francou, Ribstein, Wagnon, Ramirez, Pouyaud, Huber, Bugmann and ReasonerFrancou and others (2005), the glacial mass balance of the Bolivian Central Andes is strongly controlled by the ENSO phenomenon. During the positive phase, El Nino, precipitation can decrease by 10–30%, dry periods in summer are more frequent, and the air temperature increases by 1–38C. In such periods, the ELA may increase, trending downwards during the negative phase (La Nina). This atmospheric temperature variability is the determining factor for the annual mass balance because the altitude at which snow melts rises with temperature increase. When the glacier accumulation zone is observed at higher altitudes (i.e. >5500m a.s.l. in the Central Andes), glaciers can recover their ice masses in certain years. Therefore, information on both the snow precipitation volume and the liquid/solid phase over the total surface of the glacier is important. Small glaciers (<1 km2 for the Central Andes) are clear examples of the influence of atmospheric temperature variability. In some years, the entire glacier surface can be converted into an ablation zone or an accumulation zone (Reference RamırezRamirez and others, 2001; Comunidad Reference AndinaAndina, 2007). From 1974 to 1998, this region recorded an average atmospheric warming of 0.348C per decade (Reference Vuille, Bradley, Werner and KeimigVuille and others, 2003); no precipitation trends were identified by these authors.
3. Data
Aerial photographs
For the period 1963-83, we used aerial photographs from the Servicio Nacional de Aerofotogrametrıa (SNA), Bolivia, which were digitalized at 14mm resolution. To orientate the images, we performed fieldwork in 2010 using a pair of Ashtech Zmax L2 differential GPS (DGPS) units to produce 22 control points on the terrain (Table 1).
Aerial photograph data and root-mean-square errors (RMSE)

Satellite images and digital elevation model
We used a set of ALOS PRISM (Panchromatic Remote-sensing Instrument for Stereo Mapping aboard ALOS) satellite images for the period 1983-2009. This sensor has three independent optical systems, allowing the production of stereo pairs, and offers data at nadir and from 248 lateral sightings (http://www.eorc.jaxa.jp/ALOS/en/about/prism.htm). The same control points were employed for ortho-correction and to generate a digital elevation model (DEM) using these images (Table 2).
Satellite imagery and RMSE

Topographic data
Topographic data are derived from Reference Jordan and JordanJordan’s (1990) map using air photographs taken in 1975.
Climatic database
We compared annual variations in precipitation at the El Alto/La Paz weather station (16.528S, 68.188 W; 4070ma.s.l.) with Illimani ice mass areal variations and net accumulation rates for the period 1960-98. El Alto is ∼44 km to the northwest.
As discussed above, one of the main controls on the Bolivian glacier mass balance is the ENSO events. Thus we used the multivariate ENSO index (MEI), obtained from the Climate Diagnostic Center, Boulder, CO, USA, to examine whether changes in glacier area are associated with El Nino– La Nina events.
Ice-core data
In 1999, an international team led by the Institut de Recherche pour le Developpement, France, recovered a 138 m ice core from Nevado Illimani (168370 S, 678460 W), at 6350 m a.s.l., providing information about the Amazon basin’s atmospheric chemical composition and its evolution during the last century (Reference CorreiaCorreia and others 2003; Reference De Angelis, Simoes, Bonnaveira, Taupin and DelmasDe Angelis and others 2003; Reference RamırezRamirez and others 2003). Reference Hardy, Vuille and BradleyHardy and others (2003) and Reference HoffmannHoffmann and others (2003), comparing the regional meteorological data with the stable-isotope ratio (d18O) record in the Illimani ice core, concluded that precipitation rate variations are highly correlated to this ratio. They concluded that the stable-isotope ratios in the tropical Andes are more influenced by the precipitation rate than the atmospheric temperature.
4. Methods
To quantify areal variations of Nevado Illimani glaciers from 1963 to 2009, we used aerial photographs (1963, 1983) and a set of satellite images (2009). To digitize ice-covered areas and drainage basins, photogrammetric restitution was performed using the Leica Digital System (LPS) and Planar 3D application. The drainage basins were identified for each glacier. In some periods, the higher limits of these basins were snow-covered, making visual identification less reliable, in which case a 1 :70000 scale topographic map (Reference Jordan and JordanJordan, 1990) was employed. This map was georeferenced based on the 2009 ALOS image. The vectorization of the glacier terminus was manually determined based on the aerial photographs and satellite imagery. Due to variable snow cover, co-registering differences and imagery resolutions, we considered a 5% error in the determination of each glacier area. We also used Reference Jin, Xin, Che, Wu and MoolJin and others’ (2005) equation to determine the total error in the determination of the Illimani glacierized area in 1963, 1983 and 2009:

where Sn is the glacierized area and n is the number of glaciers.
The plane areas on the 1963 and 1983 aerial photographs and the 2009 ALOS image made it possible to calculate the glacial retractions for the 46 year period (Fig. 2). Finally we compared the area variations with the accumulation rate variations obtained from a Nevado Illimani ice core taken during a 1999 field campaign (Reference RamırezRamirez and others, 2003).
Glacier limits of Nevado Illimani in 1963, drawn over an ALOS PRISM satellite orthoimage (1 June 2009). Numbers identify glaciers used in this study (as they do not have known names); see Table 3 for area and extent details.

5. Results
Area changes
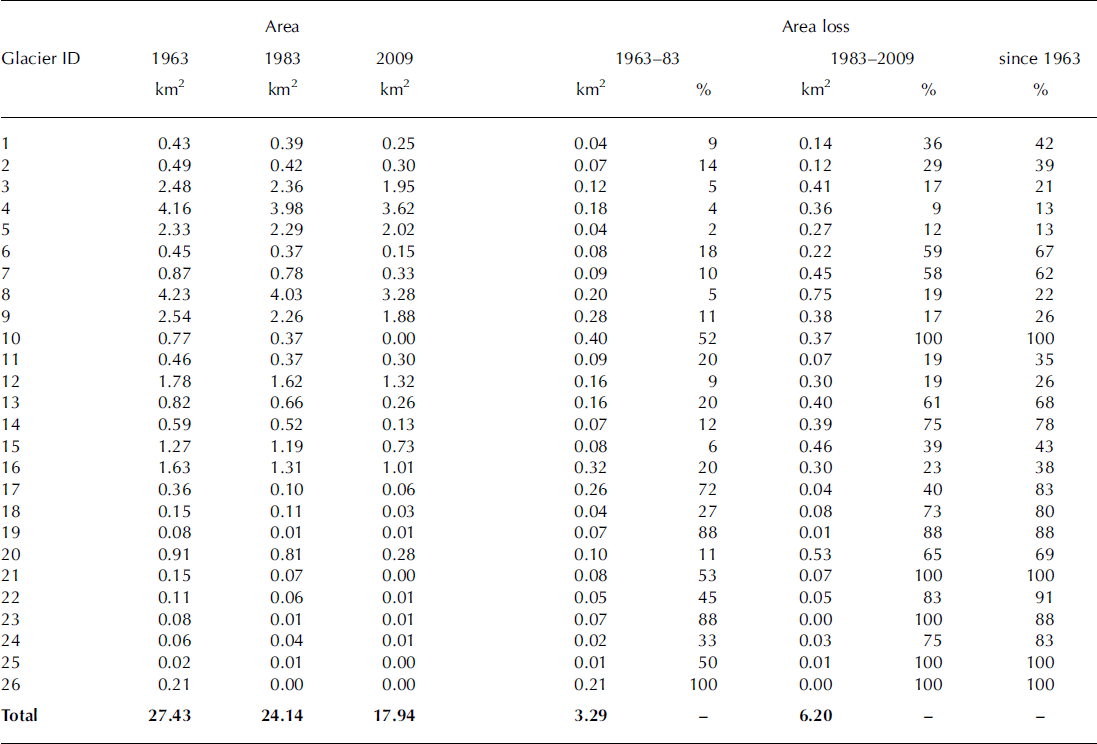
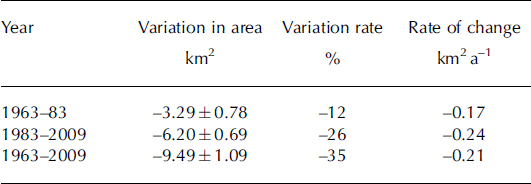
Area changes in Nevado Illimani during the last 46 years are shown in Figure 3 and Table 3. We calculated that the glacier-covered area decreased from 27.4 km2 to 17.9 km2 from 1963 to 2009, a 35% areal reduction in 46 years. From 1963 to 1983, there was a 12% areal loss, and there was a twofold acceleration (-26%) from 1983 to 2009 (Table 4).
Nevado Illimani area variations and glacier identification (numbers) with accumulation areas above 5600 m a.s.l. (dotted contour) for 2009 (light grey), 1983 (dark grey) and 1963 (black). Contour spacing is 100 m. Numbers identify glaciers used in this study (same as in Fig. 2); see Table 3 for area and extent details.

Variations in Nevado Illimani glacier-covered area
Nevado Illimani rate of change
Aspect and elevation changes
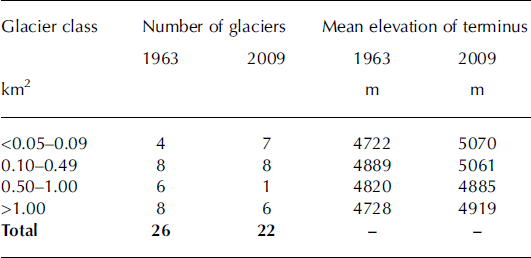
In 1963, the mean terminus altitude for small glaciers (i.e. <1 km2) was ∼4722 ma.s.l. (Table 5); by 2009, it had risen by 348 m. For glaciers larger than 1 km2, the termini rose 191 m from 4728 m. This difference may be attributed to the lower elevation of the accumulation areas; in some years the entire glacier surface of the smallest glaciers can be converted into an ablation zone.
Variations in the number of glaciers in Nevado Illimani and glacier terminus average elevations
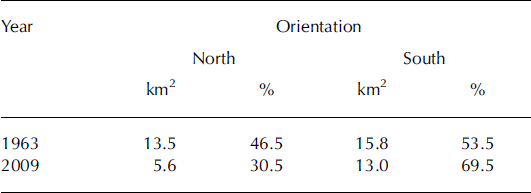
Surface changes in glaciers show differences due to their slope orientation and solar-radiation exposure/mountain-face orientation (Table 6). The east-slope/north-face glaciers retracted more than the west-slope/south-face glaciers. The first group represented 46% of the glacial area in 1963, but only 30% by 2009. This may be related to variations in solar exposure. During the morning, the cloud cover is at lower altitudes, exposing the east-slope/north-face glaciers to direct solar radiation. In the afternoon, cloud cover rises to higher tropospheric elevations, enabling it to absorb greater radiation and leaving the west-slope/south-face glaciers more sheltered (Reference JordanJordan, 1985). Thus, west-slope/south-face glaciers are larger in area than east-slope/north-face glaciers, allowing for ice mass recovery in years of positive balance.
Relation between glacier aspect and Nevado Illimani glacier-covered area
6. Discussion
Reasons for glacier variations
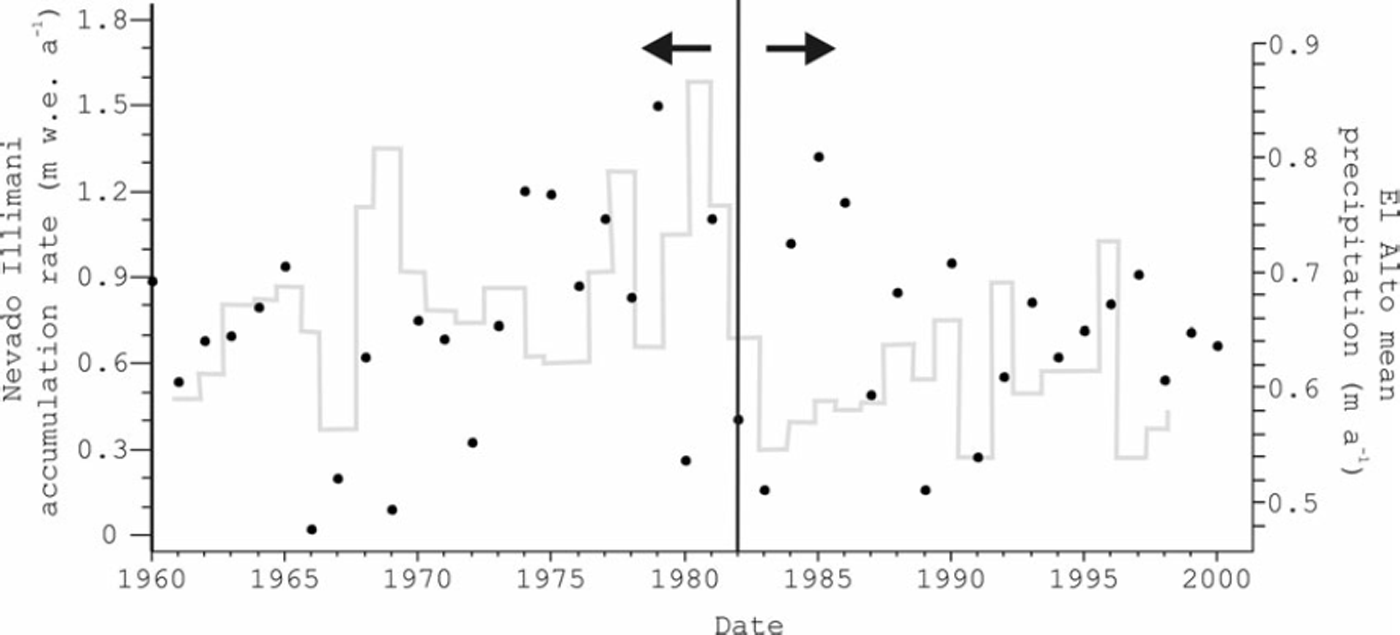
Figure 4 shows that there is some coherence between annual accumulation rates at Nevado Illimani and annual precipitation at the El Alto weather station. While there is no statistically significant trend in the El Alto precipitation for the period 1960-98, the accumulation rate at Nevado Illimani can be divided into two phases, 1960-81 and 1982-2000, with a decrease from 0.92 ± 0 . 3 1 m a- 1 to 0.56±0.19ma–1 .
Nevado Illimani accumulation rate (grey histogram) and mean annual precipitation trend at the El Alto weather station (black dots). The vertical line in the middle of the graph divides the accumulation at Illimani into two phases, 1960–81 and 1982–2000, with a decrease from 0.92 ma–1 to 0.56 ma–1.
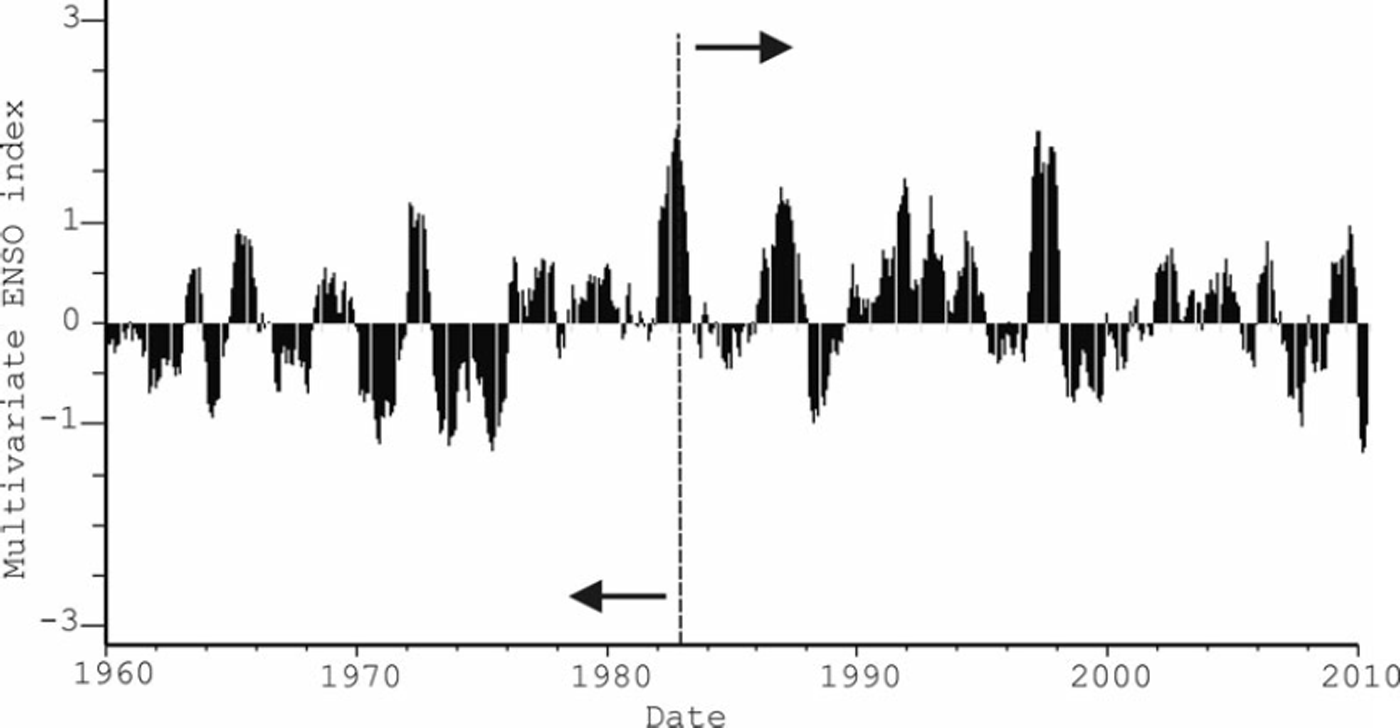
From Figure 5, it is clear that El Nino events became stronger after 1982, coinciding with changes in the accumulation rate at Nevado Illimani.
Multivariate ENSO index (MEI) from 1960 to 2010. The dashed line separates two distinct periods: La Nina events predominated until the 1980s; afterwards, El Nino events became more frequent.
Glacier variation and ice-core data
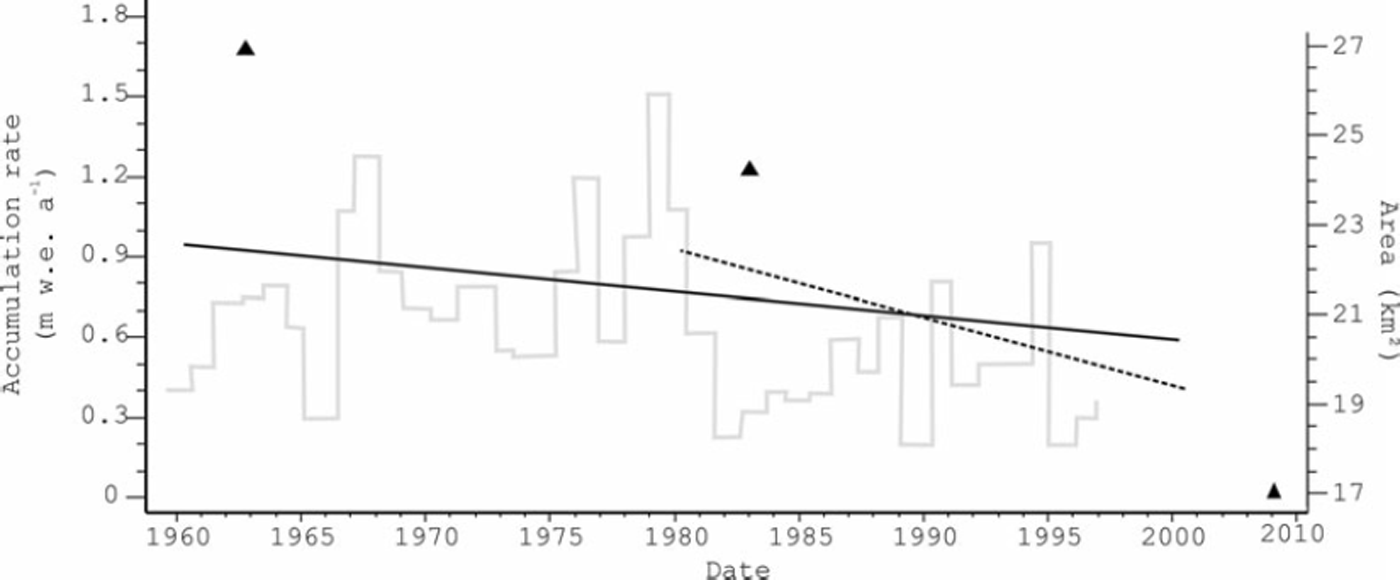
Figure 6 compares the Nevado Illimani glacier area losses from 1963 to 2009 with the net accumulation rate from an ice core at the same ice mass. It is clear that the mass loss rate during this period increased after 1983 (i.e. 3.3 ± 0 . 7 8 km2 from 1963 to 1983, then 6.2 ± 0 . 6 9 km2 from 1983 to 2009). Concomitantly, the accumulation rate decreased, mainly from 1983 onwards.
Variation in Nevado Illimani’s net accumulation rate, as determined from a local ice core (obtained at 6350 ma.s.l.), against the loss in area defined by this study. Triangles (glacier area), grey line (accumulation rate). The continuous black line marks the accumuation rate trend at the Illimani from 1960 to 1998 (0.92ma–1 w. eq.) and the dotted line marks the same trend from 1983 to 2000 (0.562ma–1w. eq.).
The observed ice mass reduction may be a result of the observed precipitation rate decrease (which also implies a smaller surface albedo), a reduction in cloud cover and an increase in air temperature (which would increase the sublimation rate at the Nevado Illimani altitude) (Comuni-dad Reference AndinaAndina, 2007).
At Nevado Illimani, the smaller glaciers (<1 km2) have experienced the greater proportional areal reductions (∼76% from 1963 to 2009; Table 3). These results are similar to those found at other Bolivian glaciers: Glaciar Zongo (168S, 688 W), by tropical standards a large glacier, had an area of 2.29 km2 in 1963 but from 1956 to 2006 lost 14.4% of its area and has been rapidly shrinking since 1975 (Reference SorucoSoruco and others, 2009); and Glaciar Chacaltaya (16820’ S, 68807’ W), a small glacier, had an area of 0.195 km2 in 1963 (Reference RamırezRamirez and others, 2001) but had disappeared by 2010 (WGMS, 2011).
We do not expect the complete disappearance of the Nevado Illimani ice mass in the near future. Of the glaciers surrounding this mountain (Fig. 3), six (glacier ID: 3, 4, 8, 9, 11 and 12) have 40% of their glacial accumulation areas above 5500m. Thus, it possible for Nevado Illimani to recover its ice mass in certain years. In 2007/08, Glaciar Zongo had a mass balance of +257 mm w.e. (Reference Zemp, Nuss-baumer, Gartner-Roer, Hoelzle, Paul and HaeberliWGMS, 2011).
7. Conclusions
In total, Nevado Illimani lost 9 . 4 9 ± 1.09km2 of its glacier area from 1963 to 2009. This reduction occurred in two phases: ∼ 1 2% from 1963 to 1983, and a further 26% in the following 26 years (up to 2009). The number of glacier basins has also reduced since 1963, from 26 to 22. East-slope/north-face glaciers have shown a greater retreat than those set on the west/south face of the mountain.
By comparing these results with accumulation rates, determined from a local ice core, we identified a marked reduction from 1983 onwards that may be the main factor in the increasing glacier retreat at the Nevado Illimani site.
Acknowledgements
This study was conducted within the framework of the Andean Regional Project on Climate Change Adaptation (PRAA) funded by the World Bank and implemented through the Andean Community of Nations (CAN). We thank the Brazilian National Council for Scientific and Technological Development (CNPq) for financial support (project No. 490125/2010-7, programme PROSUL).



