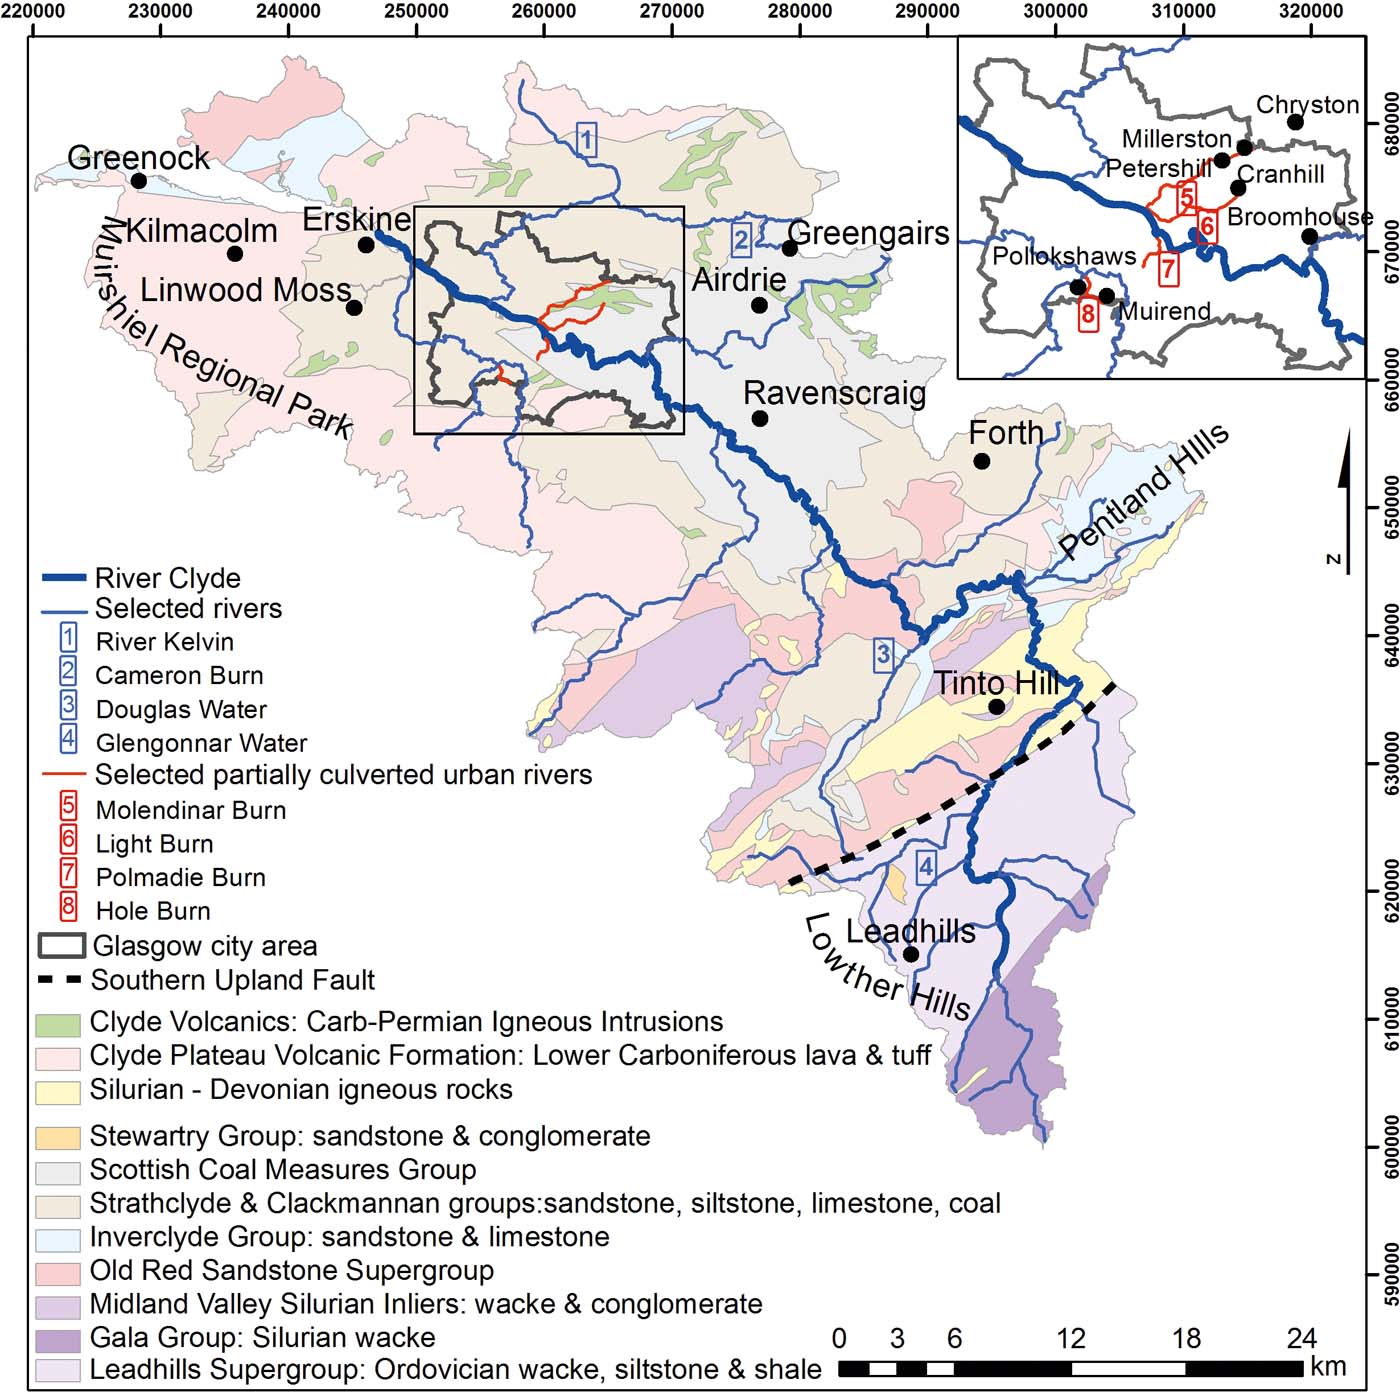
An extensive geochemical study of the River Clyde Basin in the W of Scotland, UK, has been undertaken by the British Geological Survey (BGS) in a number of phases (BGS 1993; Fordyce et al. Reference Fordyce, Ó Dochartaigh, Lister, Cooper, Kim, Harrison, Vane and Brown2004; Jones et al. Reference Jones, Lister, Strutt, Entwistle, Harrison, Kim, Ridgway and Vane2004; Bearcock et al. Reference Bearcock, Scheib and Nice2011), as part of the wider BGS Clyde and Glasgow Urban Super Project (CUSP). This is a multi-disciplinary catchment-based investigation being undertaken in collaboration with Glasgow City Council (GCC). The aim has been to characterise the geo-environment of the Clyde Basin, and generate geoscience products to aid planning and sustainable development in Scotland's major conurbation (Campbell et al. Reference Campbell, Merritt, O Dochartaigh, Mansour, Hughes, Fordyce, Entwisle, Monaghan and Loughlin2010). The geochemical survey included soil, sediment and stream water samples and has generated a large database of broad environmental relevance. The location and geological setting of the Clyde Basin are outlined in Figure 1. The Clyde catchment has a long history of industrial development in the form of metal mining, coal mining, ship building and chemical industries, and many of the acquired chemical data record evidence of this industrial legacy. This paper focuses on the distributions of two trace metals that reveal some of the strongest environmental impacts of this industrial past: chromium (Cr) and lead (Pb).
Clyde catchment location and geology map.

Cr occurs naturally in rocks, sediments and soils with varying contents. The only significant Cr ore mineral is chromite (FeCr(III)2O4), although crocoite (PbCr(VI)O4) is an oxidised secondary mineral (Guertin et al. Reference Guertin, Jacobs and Avakian2004). Cr can exist in the environment in both Cr(III) and Cr(VI) oxidation states, depending on ambient pH and redox conditions. The different forms have different toxicities: Cr(III) is usually regarded as essential for human health in small quantities, while Cr(VI) is a carcinogen capable of penetrating cell membranes (Broadway et al. Reference Broadway, Cave, Wragg, Fordyce, Bewlwy, Graham, Ngwenya and Farmer2010). Naturally occurring Cr in primary ore minerals exists predominantly in the Cr(III) form, while Cr(VI) is commonly produced from industrial processes (Assem & Zhu Reference Assem and Zhu2007).
Cr substitutes for iron (Fe) and magnesium (Mg) in igneous minerals enriched in pyroxene, magnetite and ilmenite. Cr is, therefore, enriched in ultramafic rocks, but may also be relatively high in the mafic constituents of basalts. The average crustal abundance of Cr is 122mgkg–1 (Kabata-Pendias & Pendias Reference Kabata-Pendias and Pendias2001), while ultramafic rocks average 1600mgkg–1, basaltic rocks 170mgkg–1 and granite 4–22mgkg–1 (Mielke Reference Mielke and Siegel1979; Kabata-Pendias & Pendias Reference Kabata-Pendias and Pendias2001). In the sedimentary environment, Cr occurs within and adsorbed to metal oxides and clays. Cr in shale averages 90mgkg–1, while that in sandstone averages 35mgkg–1 (Mielke Reference Mielke and Siegel1979) and average soil content is 54mgkg–1. Sources of Cr also include anthropogenic compounds and minerals from the mining and smelting industries.
The mobility of Cr in water is strongly controlled by pH and redox conditions. Cr(III) tends to dominate in reducing environments such as organic-rich sediments or deep aquifers. Cr(III) behaves as a cation in aqueous solution (CrOH2+, Cr3+) and has low solubility except in acidic conditions. At neutral and alkaline pH, Cr(III) species are adsorbed strongly to Fe and Mn oxides and clays, or can precipitate as Cr(OH)3 (Richard & Bourg Reference Richard and Bourg1991). By contrast, Cr(VI) dominates in oxic conditions and occurs in solution in anionic form (HCrO4– or CrO42–). As such, adsorption of Cr(VI) to clays (Zachara et al. Reference Zachara, Cowan, Schmidt and Ainsworth1988), zeolites (Pandey et al. Reference Pandey, Sharma and Sambi2010) and Fe, aluminium (Al) and manganese (Mn) metal oxides (Davis & Leckie Reference Davis and Leckie1980; Richard & Bourg Reference Richard and Bourg1991; Fendorf et al. Reference Fendorf, Sparks, Lamble and Kelley1994) is strongest at low pH. Mn oxide also acts as a strong oxidising agent, and oxidation of Cr(III) to Cr(VI) by Mn oxide is considered to be the only significant Cr(III) oxidation pathway in the environment (Nakayama et al. Reference Nakayama, Kuwamoto, Tsurubo and Fujinaga1981; Richard & Bourg Reference Richard and Bourg1991).
Of particular concern in Glasgow is the presence in soil of chromite ore processing residue (COPR), produced by a former Cr works over the period 1830–1968 in a ‘high-lime process' (Farmer et al. Reference Farmer, Graham, Thomas, Licona-Manzur, Licona-Manzur, Paterson, Campbell, Geelhoed, Lumsdon, Meeussen, Roe, Conner, Fallick and Bewley1999; Al-Hogbi Reference Al-Hogbi2006; Broadway et al. Reference Broadway, Cave, Wragg, Fordyce, Bewlwy, Graham, Ngwenya and Farmer2010). The COPR consists of a mixture of the Cr(III) phases chromite and brownmillerite, with a number of Cr(VI) phases, including principally ettringite, hydrocalumite and hydrogarnet (Hillier et al. Reference Hillier, Roe, Geelhoed, Fraser, Farmer and Paterson2003). The COPR was disposed of at a number of sites in SE Glasgow. While COPR was last deposited over 40 years ago, its high pH (up to 12.3) has led to the release of Cr(VI) in sufficient quantities to contaminate receiving groundwaters and streams locally (Farmer et al. Reference Farmer, Paterson, Bewley, Geelhoed, Hilier, Meeussen, Lumsdon, Thomas and Graham2006; Broadway et al. Reference Broadway, Cave, Wragg, Fordyce, Bewlwy, Graham, Ngwenya and Farmer2010). A significant proportion of the Cr in soils from the affected areas occurs as Cr(VI). The pH-buffering capacity of COPR is very large, such that a pH change is considered unlikely on a timescale of decades (Farmer et al. Reference Farmer, Paterson, Bewley, Geelhoed, Hilier, Meeussen, Lumsdon, Thomas and Graham2006), and the Cr(VI) is likely to remain highly mobile.
Pb is a toxic trace element, which can impact on human health and aquatic organisms at relatively low concentrations. Pb is a cumulative toxin in humans and chronic exposure has been linked to impaired intellectual development in children (Casas & Sordo Reference Casas and Sordo2006). Aquatic ecosystem effects are also documented and include toxicity to fish and invertebrates, impairment of algal photosynthesis, impairment of plant growth, water absorption and enzyme function (e.g., Prosi Reference Prosi1989; Aisemberg et al. Reference Aisemberg, Nahabedian, Wider and Guerrero2005).
Pb is found as a trace constituent in rocks, soil, water and air (BGS 1999). The main Pb ore mineral is galena. Galena is unstable in the superficial environment and oxidises over time, releasing Pb into solution or resulting in the formation of secondary Pb-bearing carbonate (cerussite) or sulphate (anglesite) minerals (Keim & Markl Reference Keim and Markl2015). Mobilisation of Pb in ore mineral zones may also be enhanced through mining activity, which can concentrate Pb-rich sources in rock piles and waste tips, create fresh reactive mineral surfaces and accelerate weathering reactions. Pb is also widely dispersed in sedimentary rocks (Hem Reference Hem1992).
Humans have modified the Pb cycle, most notably with the historical release of tetraethyl Pb from vehicle exhausts (used from 1922 (Landrigan Reference Landrigan2002) until 2000 (MacKinnon et al. Reference MacKinnon, MacKenzie, Cook, Pulford, Duncan and Scott2011)), and via the smelting of ores and coal burning (Farmer & Lyon Reference Farmer and Lyon1977; Farmer et al. Reference Farmer and Lyon2011) as well as use in paint. Pb pipes in old water-supply networks also pose a problem for Pb contamination of drinking water. Contaminant sources including the use of leaded petrol have diminished over the last few decades. However, some of the legacy of this anthropogenic signature remains in the environment (Bull Reference Bull2007; MacKinnon et al. Reference MacKinnon, MacKenzie, Cook, Pulford, Duncan and Scott2011).
Pb adsorbs strongly to Fe oxides and organic matter (Taillefert et al. Reference Taillefert, Lienemann, Gaillard and Perret2000), although sorption is strongly pH-dependent. Mobilisation is favoured at low pH (<6), predominantly as the free Pb2+ ion (Nelson et al. Reference Nelson, Lion, Shuler and Ghiorse2002; Liu & Huang Reference Liu and Huang2003). Relatively high concentrations of dissolved Pb are, therefore, expected in acidic streams. They are also expected in waters proximal to sources of Pb ore, such as the Leadhills former mining area in the southern part of the catchment (Fig. 1), where veins containing Pb–Zn sulphide ores are abundant (BGS 1993). These were mined intermittently over about 700 years, with the most recent period of extraction ca.1850-1915. The later years of extraction were particularly intensive and, as a result, numerous abandoned shafts and surface workings exist along the course of the Glengonnar Water (Rowan et al. Reference Rowan, Barnes, Hetherington, Lambers and Parsons1995). These expose reactive mineral surfaces, allowing enhanced dissolution (Salomons Reference Salomons and Stringel1988). Pb dispersed in sedimentary rocks is also a potential source in the catchment (BGS 1993).
This paper brings together a large dataset of stream and river water data (1892 analyses) for the Clyde catchment and investigates the spatial distributions, controls and impacts of Pb and Cr in a region with a long legacy of industrial processing and mining activity. The consequences for the protection and regulation of Clyde catchment surface water are discussed.
1. Methodology
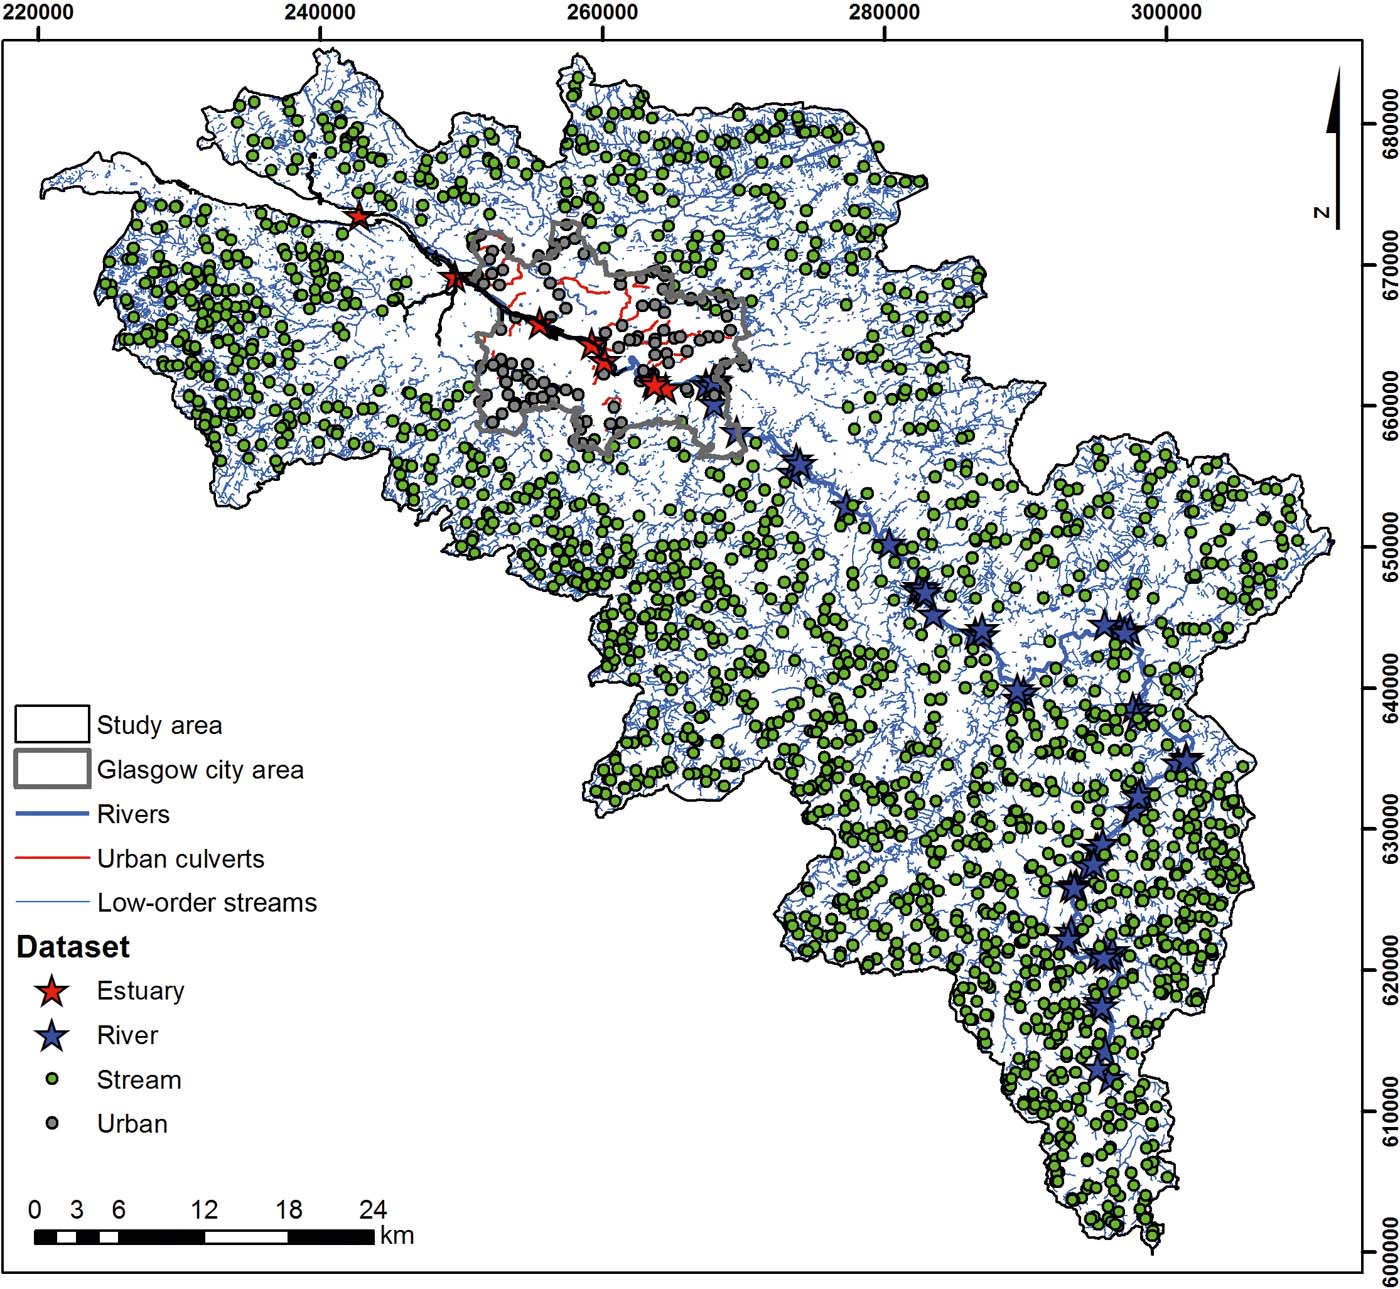
The BGS Clyde Basin surface water geochemistry dataset has been compiled from three discrete field survey campaigns carried out under the CUSP programme. The first of these was a survey of water and sediment quality in the inner estuary of the River Clyde, undertaken as part of the BGS Estuarine Contamination Project, co-sponsored by GCC and the Scottish Environment Protection Agency (SEPA), during 2002–2003 (Jones et al. Reference Jones, Lister, Strutt, Entwistle, Harrison, Kim, Ridgway and Vane2004). The second survey assessed urban sediment and water quality in all tributaries of the River Clyde within the GCC area and was carried out as part of the BGS Geochemical Baseline Survey of the Environment (G-BASE) project, co-sponsored by GCC during 2003 (Fordyce et al. Reference Fordyce, Ó Dochartaigh, Lister, Cooper, Kim, Harrison, Vane and Brown2004). In 2010, the G-BASE project added to these surveys to include (i) rural stream waters in the Clyde Basin area and (ii) river water samples from the River Clyde and its major tributaries upstream of the Glasgow conurbation (Bearcock et al. Reference Bearcock, Scheib and Nice2011). The rural stream water samples were taken at locations where stream sediment had been sampled some 30 years previously as part of the G-BASE project (for more information about the G-BASE project and methodologies see Johnson et al. (Reference Johnson2005)). Henceforth, for simplicity, the data from each stage of sampling will be referred to as Estuary, Urban, Stream and River, respectively (Fig. 2). Each sampling strategy is described in more detail in individual project reports (Fordyce et al. Reference Fordyce, Ó Dochartaigh, Lister, Cooper, Kim, Harrison, Vane and Brown2004; Jones et al. Reference Jones, Lister, Strutt, Entwistle, Harrison, Kim, Ridgway and Vane2004; Bearcock et al. Reference Bearcock, Scheib and Nice2011) and summarised in Table 1.
Sample site locations.

BGS stream and river water datasets for the Clyde Basin. Words in bold denote how the datasets are referred to within the text.

Whilst the data combined in this account are from three time periods, standardised sampling procedures for both quality assurance and direct comparison are used throughout the surveys. However, direct comparisons detailed here should be treated with some caution given the potential changes to water chemistry caused by factors such as river stage and land-use changes. The majority of samples (88%) were taken during the summer months (June–August). This is to ensure that the baseflow component dominates the stream flow and results can be more easily compared between G-BASE samples taken during other field seasons. The remaining samples were taken in May, October and December as a result of logistical constraints (Fordyce et al. Reference Fordyce, Ó Dochartaigh, Lister, Cooper, Kim, Harrison, Vane and Brown2004; Jones et al. Reference Jones, Lister, Strutt, Entwistle, Harrison, Kim, Ridgway and Vane2004; Bearcock et al. Reference Bearcock, Scheib and Nice2011). The G-BASE field procedures manual defines all protocols followed (Johnson Reference Johnson, Breward, Ander and Ault2005) and, along with an earlier version, was used to provide the basis of each survey. Systematic error in field sampling and analysis was monitored using a method based on randomised sample site numbers (Plant Reference Plant1973): samples were collected in random number order and analysed in sequential numerical order. This means any analytical instrument drift can be distinguished from spatial geochemical variation.
During the freshwater surveys, samplers worked in pairs and were interchanged daily to reduce the possibility of sampling bias introduced by the use of divergent procedures. All jewellery was removed prior to sampling to avoid possible metal contamination. Filtered (0.45μm) water samples were collected at each site for major- and trace-element analysis. In addition, unfiltered water samples were taken for total alkalinity, conductivity and pH measurements (Johnson Reference Johnson2005). Only the samples relevant to this paper will be described further.
Two filtered water samples were collected using a plastic syringe and a disposable membrane filter, each pre-rinsed with sample water before collection. A new filter was used for each site to avoid any possible cross-contamination between sites. The filtered waters were collected in high-density polyethylene Nalgene® bottles, and one of the samples was acidified with 1% (v/v) Aristar nitric acid (HNO3) on return to the field base. Samples were acidified to prevent metal precipitation and sorption onto the container walls and to minimise post-sampling microbial activity. At each site, two aliquots of unfiltered water were collected for the determination of pH and conductivity at the field base.
The pH was determined on the day of collection using a temperature-compensated glass combination electrode and Radiometer PHM 80pH meter calibrated with commercially available buffer solutions (pH 4, 7, 9). The following day, specific electrical conductance (SEC) was determined using a Hanna H19033 conductivity meter, calibrated to 25°C.
Site locations were recorded on a Garmin® global positioning system (GPS). A brief description of the site characteristics was made during the Estuary sampling (Jones et al. Reference Jones, Lister, Strutt, Entwistle, Harrison, Kim, Ridgway and Vane2004). For the other surveys at each sample site, information on the location, contamination, land use and other features required for data interpretation was entered on a computer-compatible field data card. These were pre-numbered according to the random number system (Johnson Reference Johnson2005). Duplicate samples were collected at 1% of sites as a check on reproducibility (Johnson Reference Johnson2005; Ander Reference Ander2014). For Cr, all duplicates were reproducible within 20%; for Pb, 92% of detects were within 25% (precision was slightly worse for Pb as values were closer to detection limits).
All water samples for laboratory analysis were refrigerated and delivered to the BGS laboratories as quickly as possible. On return to the laboratory, the HNO3-acidifed Stream and River waters collected in 2010 were further acidified with 0.5% HCl (v/v) to improve the solubility of some dissolved trace elements.
Chemical analysis was undertaken in three phases: during 2002, 2003 and 2010. Five of the eight Estuary water samples were collected and analysed in 2002. The remaining three, collected in 2003, were analysed with the Urban samples (Jones et al. Reference Jones, Lister, Strutt, Entwistle, Harrison, Kim, Ridgway and Vane2004). All the Stream and River samples were analysed together during 2010 and 2011 (Ander Reference Ander2014).
Analysis for Cr and Pb was undertaken by inductively coupled plasma mass spectrometry (ICP-MS), and dissolved organic carbon (DOC) was analysed using a total organic carbon (TOC) analyser; both methods were UKAS (United Kingdom Accreditation Service) accredited. Samples analysed by ICP-MS from the main 2010 survey were interspersed with certified reference materials (CRMs) and secondary reference materials (SRMs) within each analytical run. Repeat analyses of CRMs and SRMs indicated accuracy to within 10 % and a coefficient of variation within 15 % for Cr and better than 5 %, with a coefficient of variation <25 % for Pb (Ander Reference Ander2014). No speciation analysis for dissolved Cr was carried out in the study.
In the analyses of the five 2002 Estuary samples, the detection limits for a range of analytes were much higher than measured concentrations recorded within the three samples analysed on subsequent sample runs. In addition, some of the Estuary samples were saline and needed dilution before analysis, resulting in a five-fold increase in detection limit. As a result, any data below the detection limit (censored data) for these saline samples have been excluded from the presented maps and summary statistics.
For presentation purposes, the Stream and Urban data sets, which provide sample coverage across the catchment, were combined and treated as one dataset. The River and Estuary data were also combined as these data sets describe a linear feature.
To present the spatial data, interpolated surface geochemical maps of the combined Stream and Urban datasets were created using the ArcGIS10.1 (ESRI®) geographic information system. The interpolation was carried out using inverse distance weighting analysis. The map was split into a series of grid cells, where the cell size represented 250×250m2 on the ground. Each grid cell (pixel) was then assigned a value, which was calculated from all the data within 1500m of the cell. The data were weighted according to the distance of the sample site from the cell (r), and the weighting was proportional to r2. Colour-classified maps were then produced, based on boundaries set at the 5, 10, 15, 25, 50, 75, 90, 95 and 99 percentiles of the data distribution, according to standard G-BASE procedures (Johnson Reference Johnson2005). The River and Estuary datasets were presented on each interpolated map as graduated symbols. The symbols represent the 10, 25, 75 and 90 percentile boundaries. Maps also include geological line-work, based on the simplified BGS 1:625,000 scale geological map.
Box plots were created using R (R Development Core Team 2013) to show data distributions. The boxes are defined as the interquartile range, the vertical white line depicts the median, whiskers are defined as no more than 1.5 times the interquartile range (Tukey Reference Tukey1977) and open circles beyond the whiskers are defined as outliers. Box plot widths are proportional to the square root of the number of observations. Correlation coefficients and significance tests were computed using R for selected variables in order to help understand the sources of pollutants and factors controlling solute concentrations. Non-parametric Spearman correlations were computed to assess monotonic relationships between variables and without requiring knowledge of their probability distributions.
2. Results
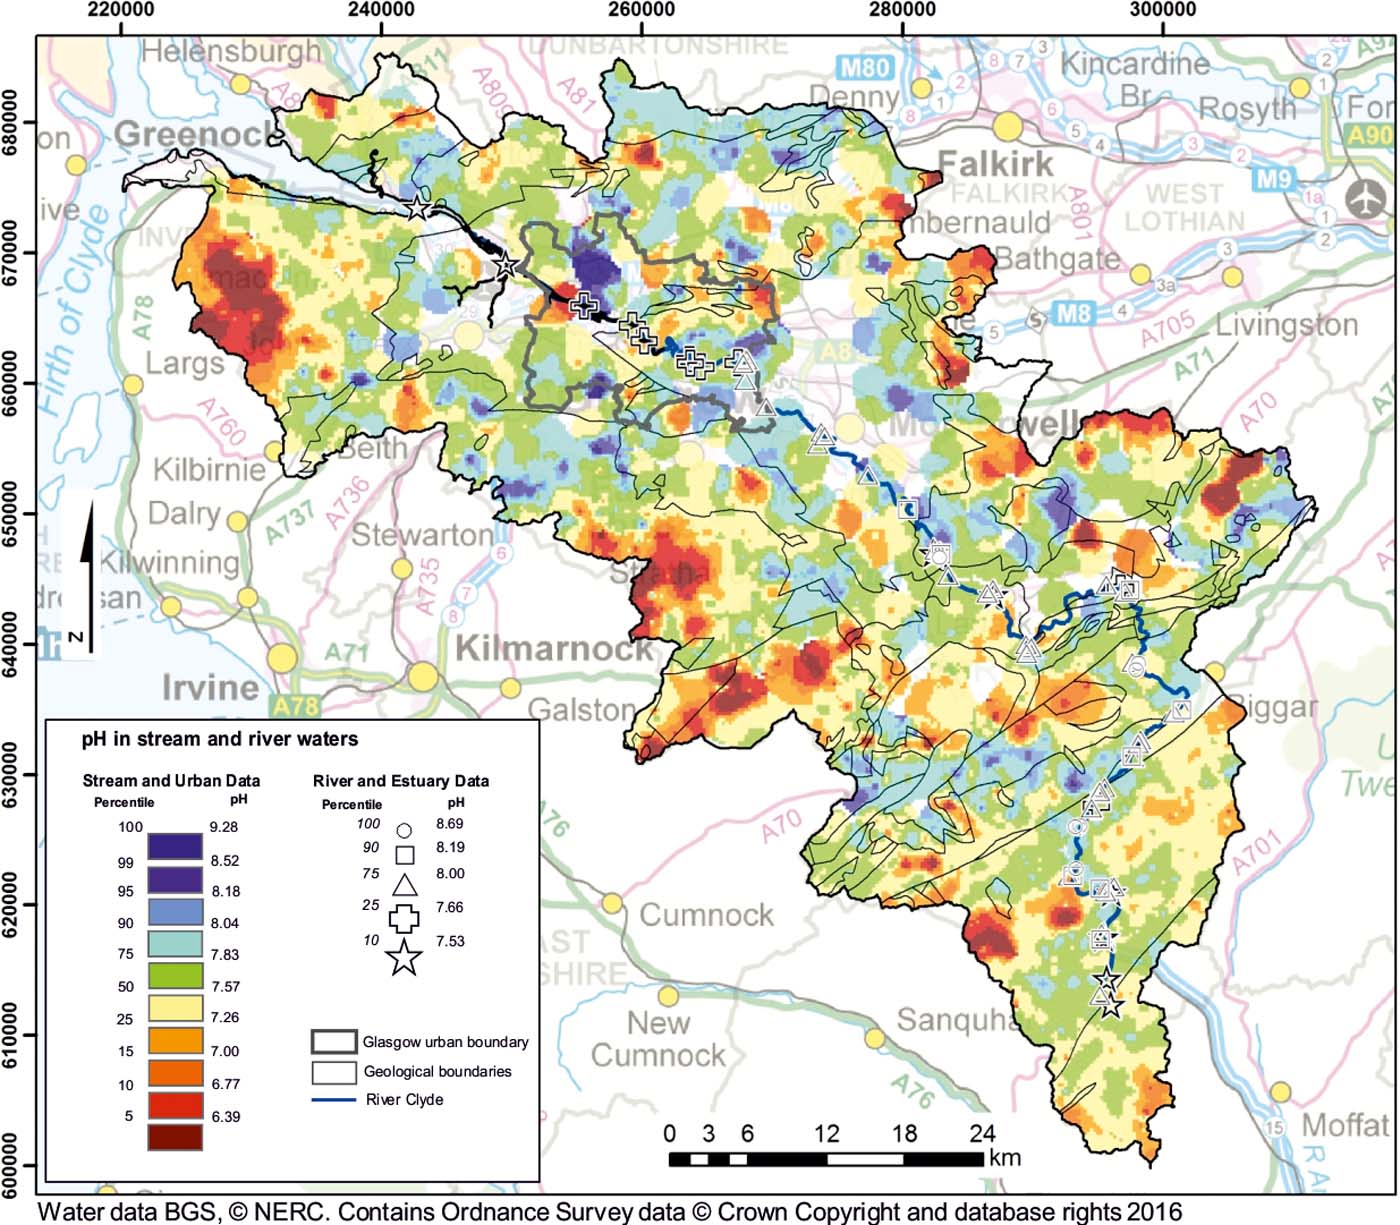
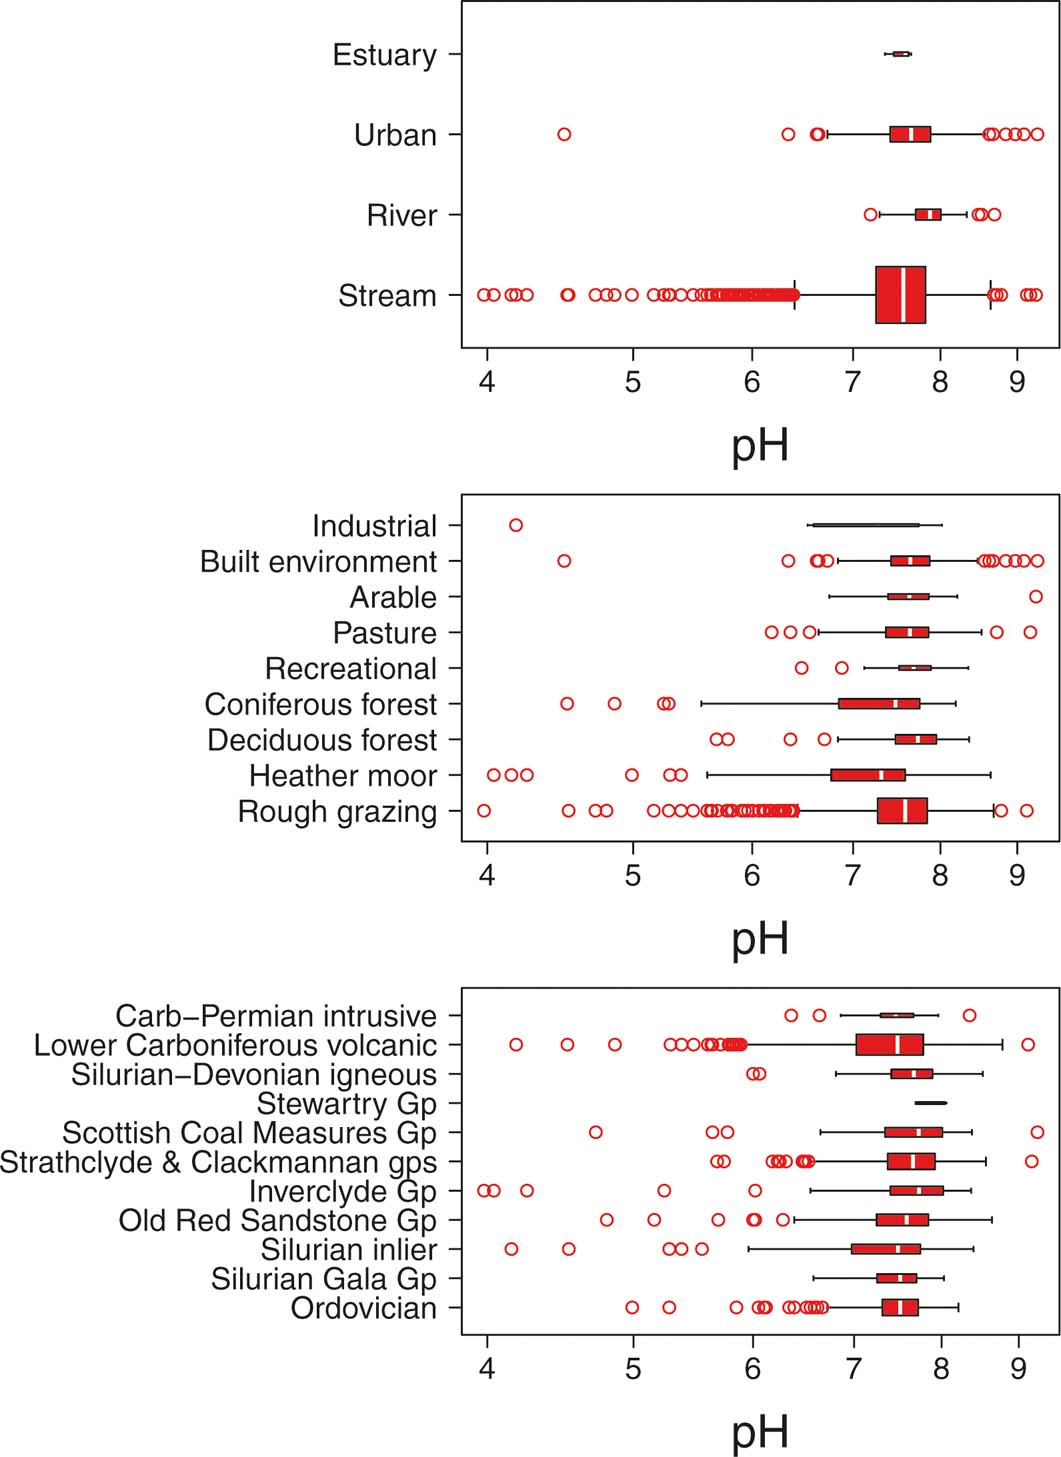
A detailed account of element distributions in surface water from the Clyde (Smedley et al. Reference Smedley, Bearcock, Fordyce, Everett, Scheib, Chenery and Ellen2017) is beyond the scope of this paper. A summary of the physico-chemical data influential to the concentrations of Cr and Pb is presented here. Maps and box plots of the distributions of stream pH and SEC are given in Figures 3–6 and summary statistics for Cr and Pb, categorised by water types, are presented in Tables 2 and 3.
Distribution of pH of surface water within the Clyde catchment.

Box plots showing distribution of pH in Clyde stream and river waters, distinguished by water type, land use and geology. Number of samples in each box plot: Estuary = 8; Urban = 122; River = 60; Stream = 1770; Industrial = 9; Built environment = 136; Arable = 43; Pasture = 156; Recreational = 27; Coniferous forest = 142; Deciduous forest = 129; Heather moor = 194; Rough grazing = 974; Carb–Permian intrusive = 15; Lower Carboniferous volcanic = 488; Silurian-Devonian igneous = 89; Stewartry Gp = 5; Scottish Coal Measures Gp = 98; Strathclyde & Clackmannan gps = 294; Inverclyde Gp = 85; Old Red Sandstone Gp = 148; Silurian inlier = 100; Silurian Gala Gp 82; Ordovician (Leadhills Supergroup) = 298.

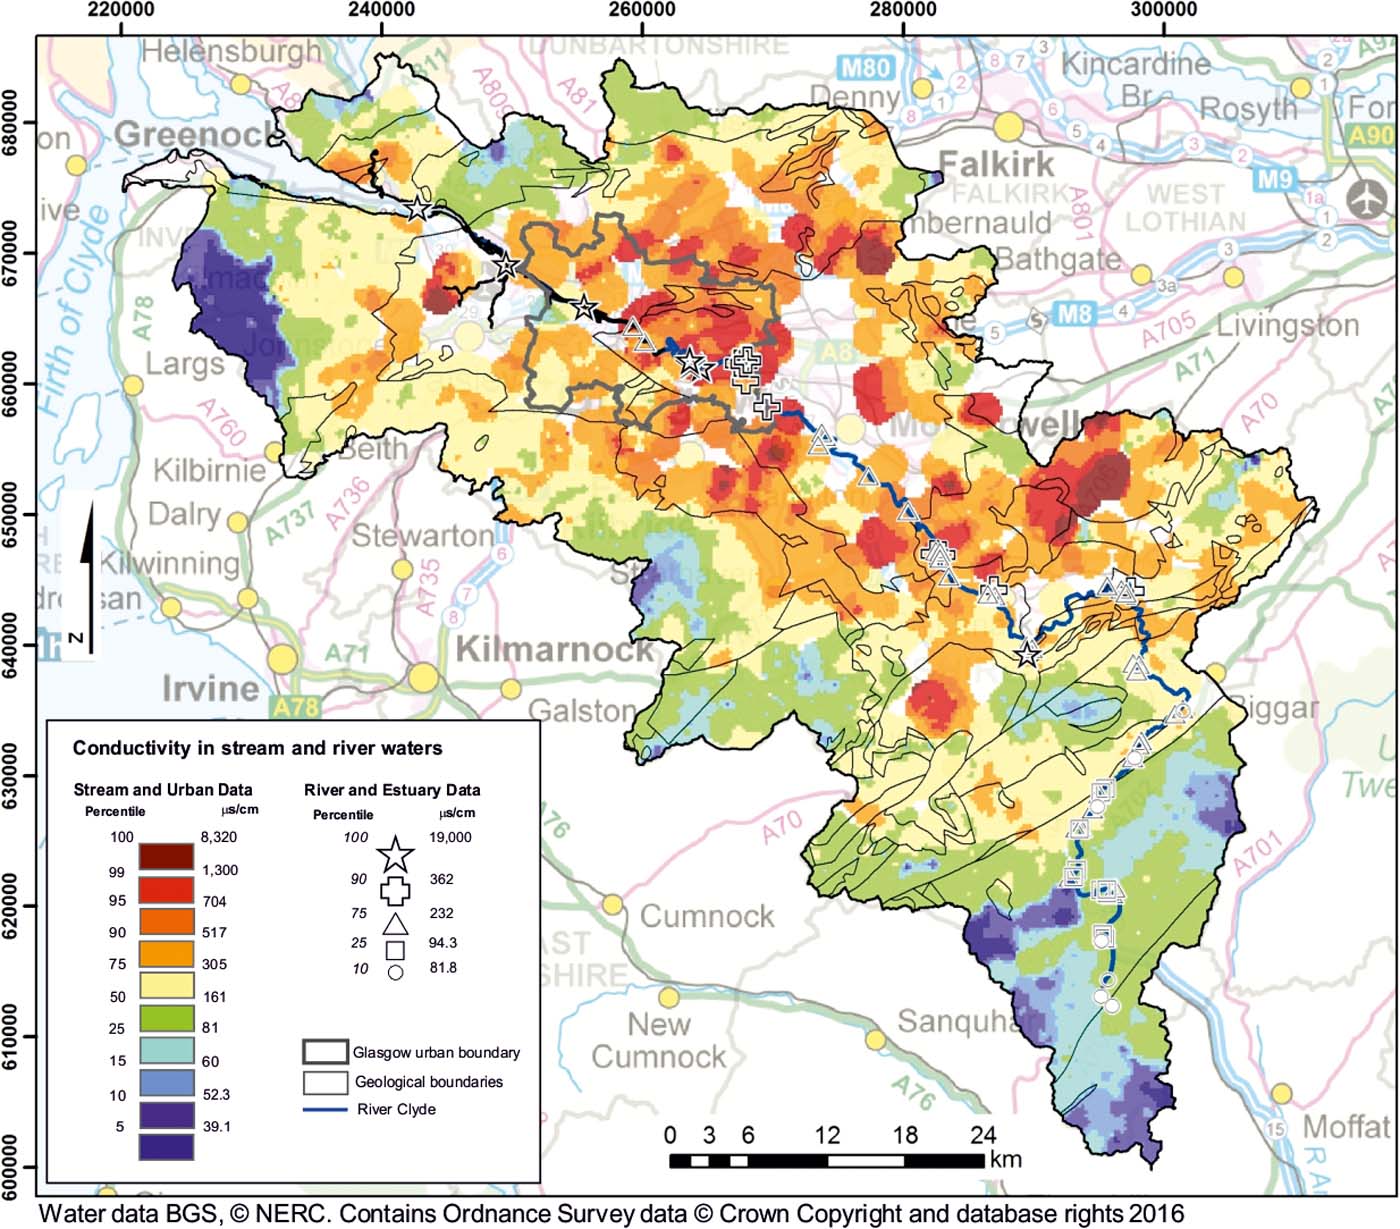
Distribution of SEC (conductivity) in stream and river water within the Clyde catchment.

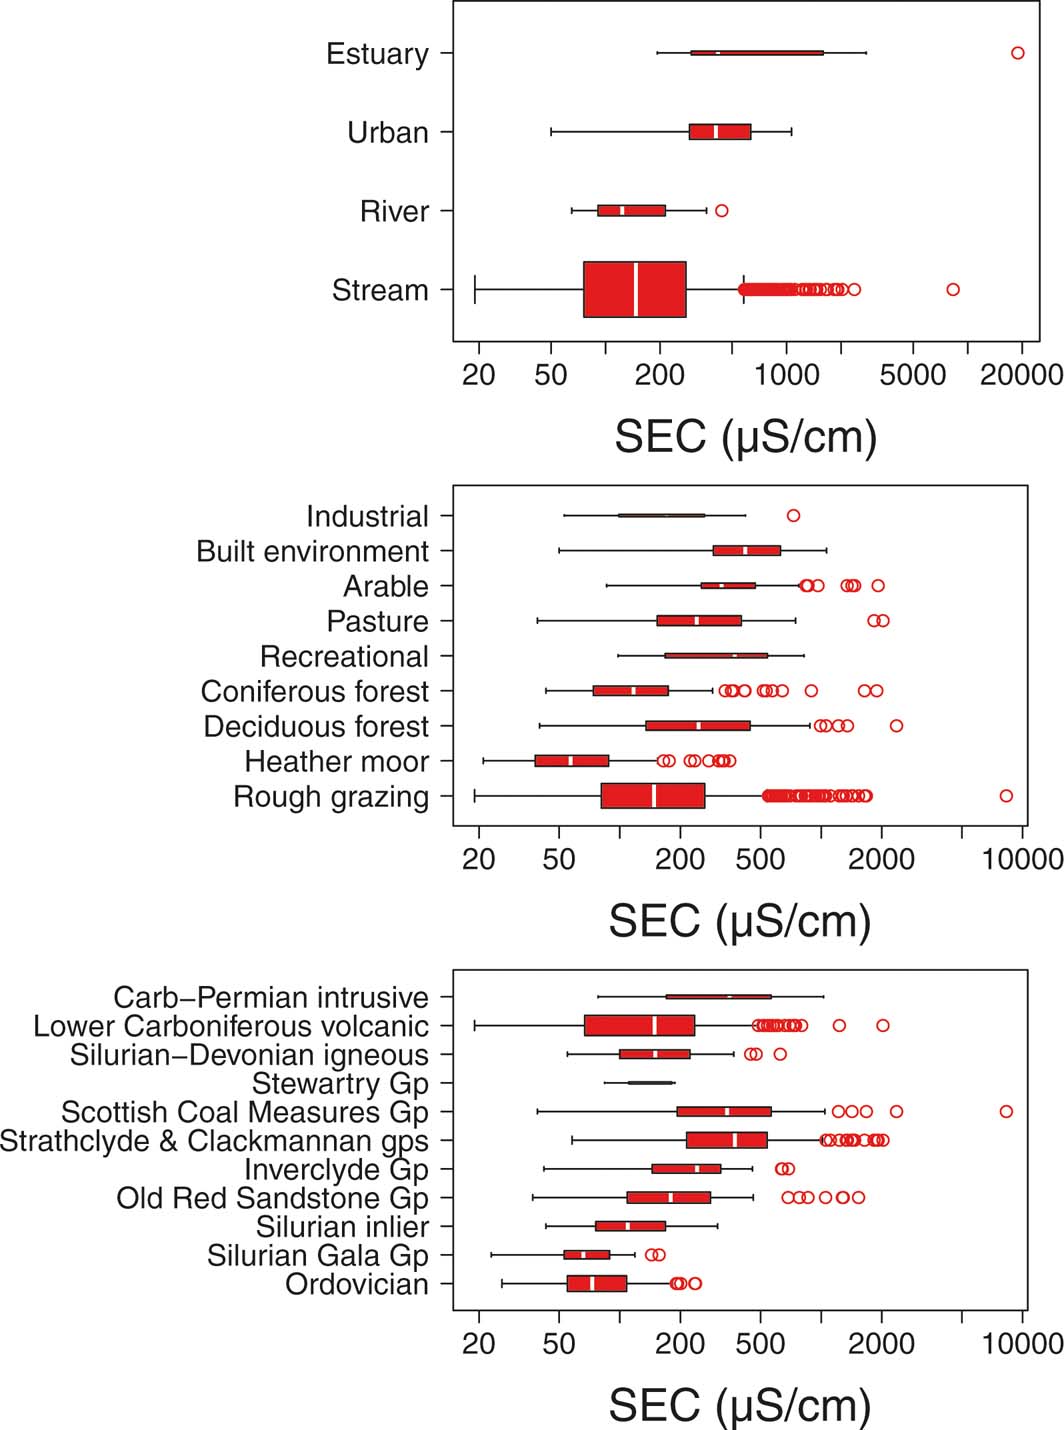
Box plots showing distribution of specific electrical conductance (SEC) values in Clyde stream and river waters, distinguished by water type, land use and geology. Number of samples in each box plot: Estuary = 8; Urban = 122; River = 60; Stream = 1770; Industrial = 9; Built environment = 136; Arable = 43; Pasture = 156; Recreational = 27; Coniferous forest = 142; Deciduous forest = 129; Heather moor = 194; Rough grazing = 974; Carb–Permian intrusive = 15; Lower Carboniferous volcanic = 488; Silurian-Devonian igneous = 89; Stewartry Gp = 5; Scottish Coal Measures Gp = 98; Strathclyde & Clackmannan gps = 294; Inverclyde Gp = 85; Old Red Sandstone Gp = 148; Silurian inlier = 100; Silurian Gala Gp 82; Ordovician (Leadhills Supergroup) = 298.

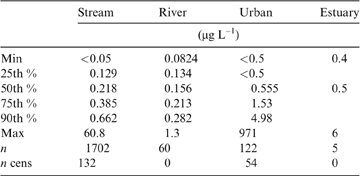
Chromium in Clyde surface waters summary statistics.

n cens = number of censored sample data points.
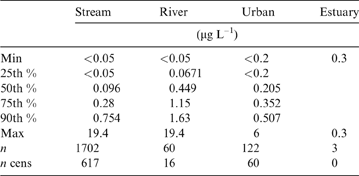
Lead in Clyde surface waters summary statistics.

n cens = number of censored sample data points.
2.1. Water pH
The range of pH values is very small, with the 15th–90th percentiles of the Streams and Urban pH data represented by 1pH unit. Stream water pH shows a locally variable distribution, but with overall lower values around the upland periphery of the catchment (Figs 1, 3). These low-pH areas tend to coincide with occurrences of heather moorland, coniferous forest or, to a lesser extent, rough grazing. The largest areas of stream water with pH <7 occur along the western watershed in Muirshiel Regional Park, S of Greenock and E of Kilmacolm (Figs 1, 3). Other upland areas with relatively low pH include the Pentland Hills, Tinto and surrounding hills, and the Lowther Hills N of Leadhills (Figs 1, 3). Stream water pH generally reflects concentrations of DOC; a Spearman correlation gives a moderate negative correlation (−0.47; P<0.05; n=1824) and is consistent with the presence of acidic waters in peaty upland areas (Figs 1, 3). Low pH values are otherwise more localised; for example, along the River Clyde, within the western urban area of Glasgow, a sewage plant, abandoned factory and hospital are located within 500m of the low-pH observations and may potentially affect the pH of the water (Fig. 3).
The range of pH values within the city of Glasgow is relatively large. The highest pH values in the catchment are largely associated with the River Kelvin, a major urban tributary of the River Clyde, while localised areas of low pH occur around Pollockshaws, Broomhouse, Petershill and Chryston. Other areas with high pH are located within the Douglas Water valley and subsidiary valleys. which tend to be grazing land rather than moorland.
Elsewhere in the catchment, pH does not relate clearly to land use or geology. Box plots demonstrate that the medians of each land-use type and geological unit are similar (Fig. 4), with the exception that heather moor and coniferous forest have lower medians and the lowest extent of whiskers, in line with the observations from Fig. 3. Highest pH values with the greatest number of outliers occur in samples with land use classed as built environment. Rank-sum testing (Wilcoxon) indicates that the distribution of pH values in samples is not significantly different between land uses, apart from for the built environment, which is significantly different from that of the other land-use classes (P<0.05).
Along the main River Clyde, pH increases from the upland catchment boundary towards the urban centre, before decreasing again towards the estuary (Fig. 3).
2.2. Specific electrical conductance (SEC)
SEC provides an overview of the total dissolved solid concentrations in Stream and River waters across the catchment. There is a strong spatial pattern in SEC, relating to geology, land use and topography (Figs 1, 5). Low water-SEC values are a particular feature over the Proterozoic Gala Group and Leadhills Supergroup metamorphic rocks, the Permian Stewartry Group sediments and Carboniferous igneous rocks to the S of the Southern Upland Fault, as well as the Clyde Plateau Volcanic Formation and Silurian Midland Valley inliers on the W and N catchment boundaries (Fig. 5). Streams on these geological units have the lowest median SEC values, probably reflecting lower weathering rates on these harder, more resistant rock types (Fig. 6). Significantly lower SEC values (P<0.05) are associated also with areas of upland heather moorland around the catchment margins (Figs 1, 5). In these comparatively remote upland areas, lower dissolved-solids concentrations are consistent with higher rainfall, combined with shorter contact times of run-off with soils and surface rocks and smaller pollutant inputs (Hodgson & Evans Reference Hodgson and Evans1997).
High SEC values are found in the lowland areas of the Clyde Basin. These correspond with the underlying Clackmannan, Strathclyde groups and Coal Measures sedimentary rock sequences and with the urban area of Glasgow. Softer sedimentary rocks that weather more readily, agricultural inputs and urban diffuse pollution probably cause these higher stream water SEC values. Highest observations were measured at the following locations: 4km S of Erskine around the Linwood Moss landfill; around Forth where there are two opencast coal mines and a landfill; the area close to the Ravenscraig disused steel works; 4km NW of Airdrie around the Greengairs opencast site and landfill; and the urban centre of Glasgow (Figs 1, 5). The highest land-use median values are within the built environment and recreational land uses, which are most common in the city of Glasgow (Fig. 6).
Within the main River Clyde channel, lowest SEC values are found near the headwaters; values increase progressively downstream, with the highest values in the Estuary samples. Some of the tributaries have higher SEC values, which reflect the nature of the land drained. For example, high SEC was measured in the Douglas Water (Figs 1, 5), which receives drainage from two major active opencast coal mines around Coalburn.
2.3. Chromium (Cr)
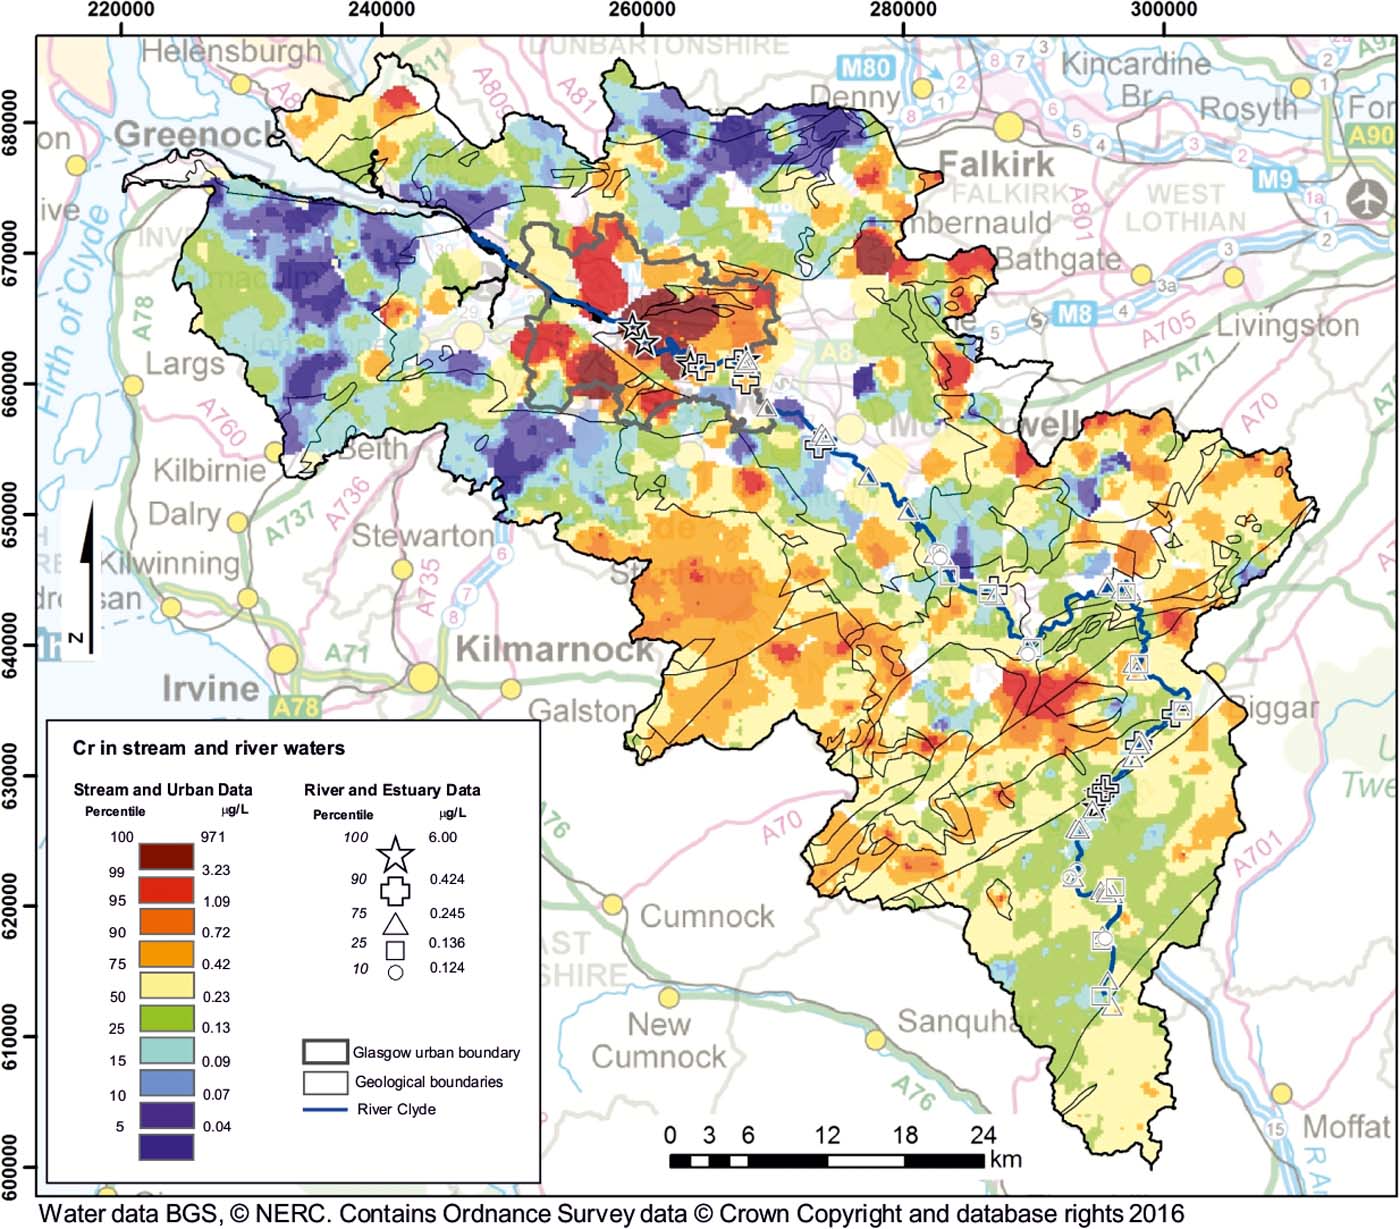
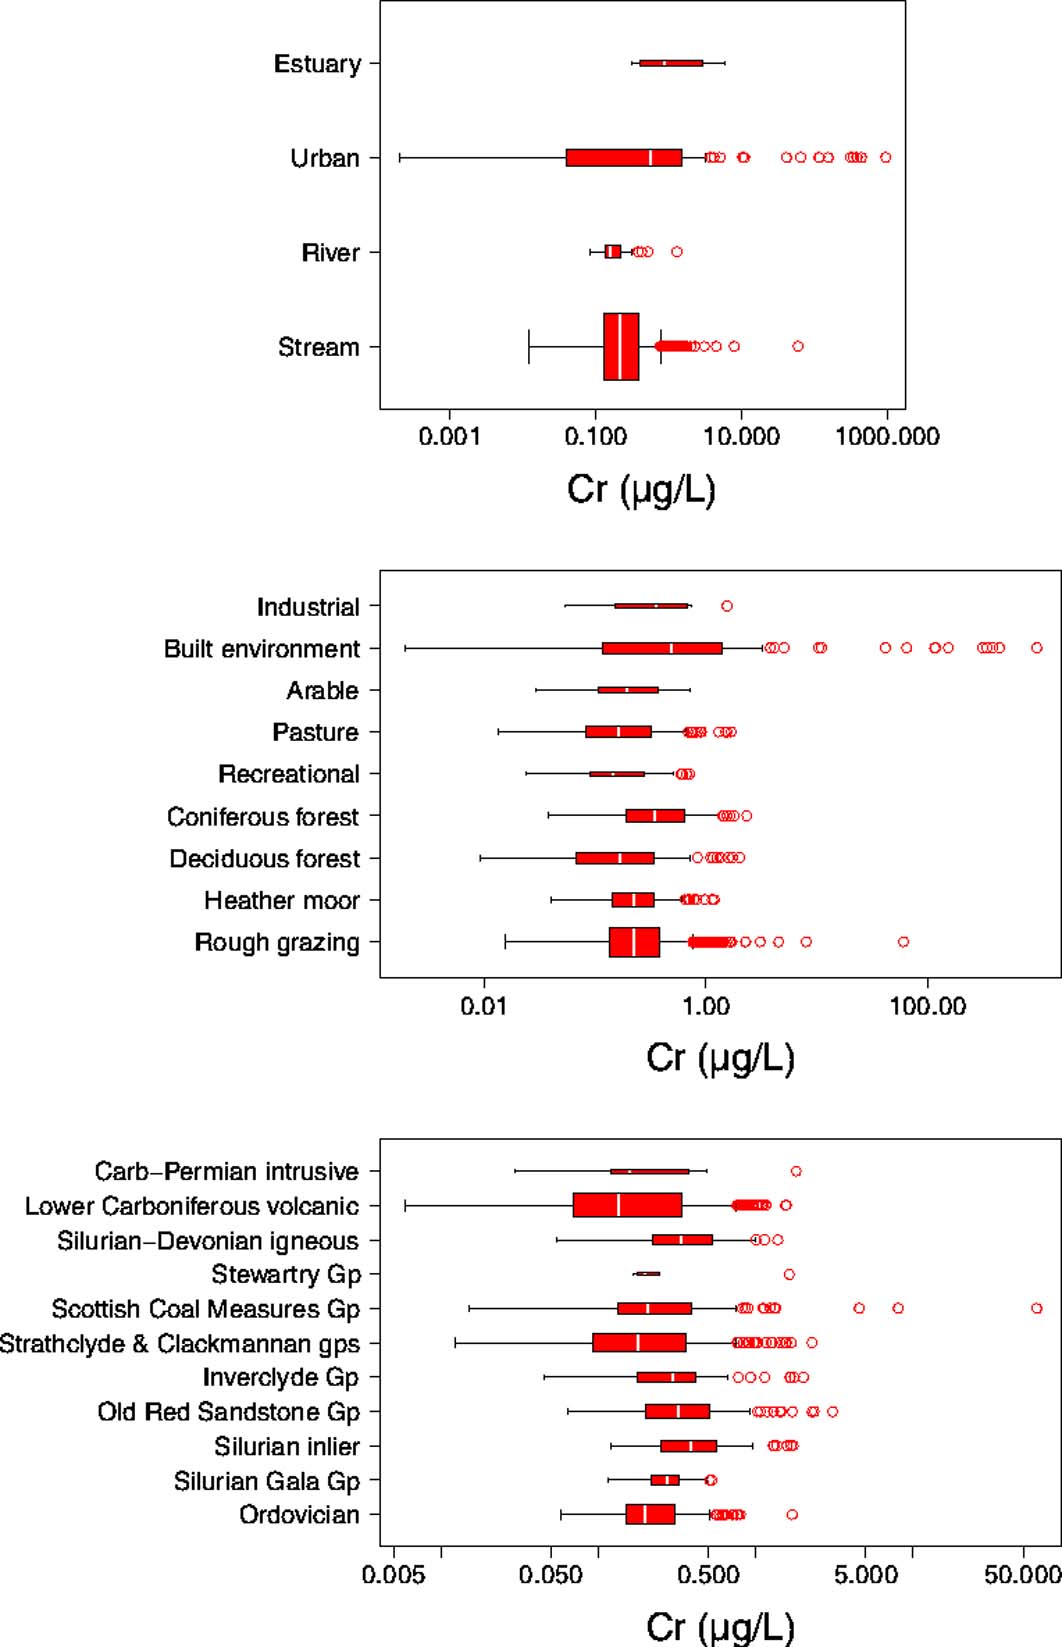
Across the catchment, the range of dissolved Cr concentrations spans five orders of magnitude, from <0.05 to 971μgL–1 (Table 2). The widest range and highest concentrations are found within the Urban water samples Fig. 7). This is also reflected when considering data distribution by land use (Fig. 8); samples taken within the built environment have the highest median value. Comparatively high values are also associated with coniferous woodland land-use type.
Distribution of Cr in stream and river waters within the Clyde catchment.

Box plots showing distribution of Cr in Clyde stream and river waters, distinguished by water type, land use and geology. Number of samples in each box plot: Estuary = 8; Urban = 122; River = 60; Stream = 1770; Industrial = 9; Built environment = 136; Arable = 43; Pasture = 156; Recreational = 27; Coniferous forest = 142; Deciduous forest = 129; Heather moor = 194; Rough grazing = 974; Carb–Permian intrusive = 15; Lower Carboniferous volcanic = 488; Silurian-Devonian igneous = 89; Stewartry Gp = 5; Scottish Coal Measures Gp = 98; Strathclyde & Clackmannan gps = 294; Inverclyde Gp = 85; Old Red Sandstone Gp = 148; Silurian inlier = 100; Silurian Gala Gp 82; Ordovician (Leadhills Supergroup) = 298.

Of the 1824 samples in the Stream and Urban data sets, ten have concentrations greater than the national drinking water limit for total Cr of 50μgL–1 (WSR 2001). One of these samples was taken from a minor tributary of the Cameron Burn near Airdrie. The treated discharge derived from the Greengairs opencast and landfill site is situated 1.5km upstream of this point, contributing some 10% of the flow to the Cameron Burn (SEPA 2007). The remaining nine samples, with concentrations ranging from 50μgL–1 to 971μgL–1, were located within the city of Glasgow along four stretches of partially culverted urban streams (the Light, Molendinar, Polmadie and Hole Burns; see Fig. 1) and are associated with COPR disposal (Fordyce et al. Reference Fordyce, Ó Dochartaigh, Lister, Cooper, Kim, Harrison, Vane and Brown2004; Broadway et al. Reference Broadway, Cave, Wragg, Fordyce, Bewlwy, Graham, Ngwenya and Farmer2010; Fordyce et al. Reference Fordyce, Lass-Evans and Dochartaigh2013).
Throughout the remainder of the catchment, the concentrations of Cr are relatively low: the 95th percentile of the Stream data set is 0.86μgL–1. In general, the higher concentrations are found S of Glasgow, while the lower concentrations are found in the N, especially over the basalts of the Clyde Plateau Formation (Fig. 7).
The measured concentrations of Cr in the River and Estuary data sets range from 0.08 to 6μgL–1 (Table 2). The high non-detect value of the Estuary data is an artefact caused by the requirement to dilute saline water for analysis. The highest concentrations are unsurprisingly found within the reach receiving water from urban areas. The large Cr input to the Clyde water reflects the spatial distribution seen in the stream sediment data (BGS 1993), which show elevated contents extending into the estuary at the lowermost part of the catchment.
2.4. Lead (Pb)
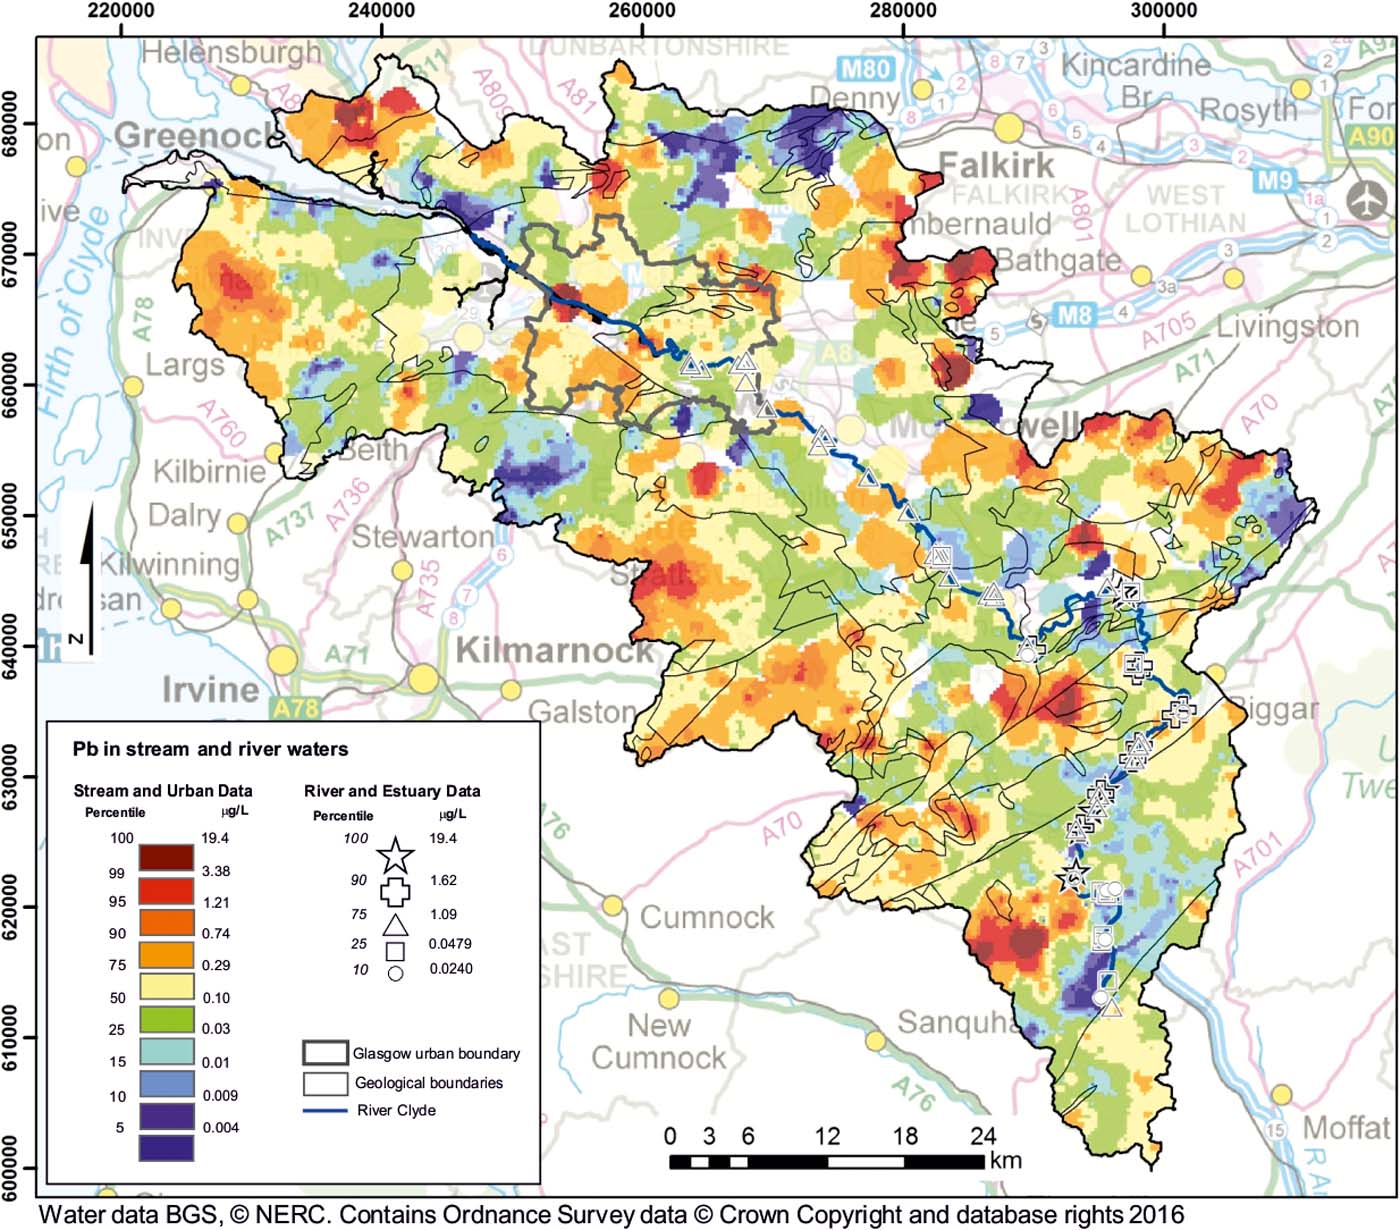
Across the Clyde Basin, Pb concentrations range from <0.05μgL–1 to 19.4μgL–1. Within the Urban dataset, the highest concentration is 6μgL–1 (Table 3). The maximum values represent outliers in the data sets; across the catchment the 95th percentile of the data (Stream and Urban combined) is 1.21μgL–1. The areas where the stream water Pb concentrations are highest (Fig. 9) tend to be around the periphery of the catchment, typically underlain by peat deposits, or within coniferous woodland. These areas broadly have stream waters with low pH values (Fig. 3). A moderate negative correlation (Spearman −0.55; P<0.05; n=1824) exists between dissolved Pb concentrations and pH.
Distribution of Pb in stream and river waters of the Clyde catchment.

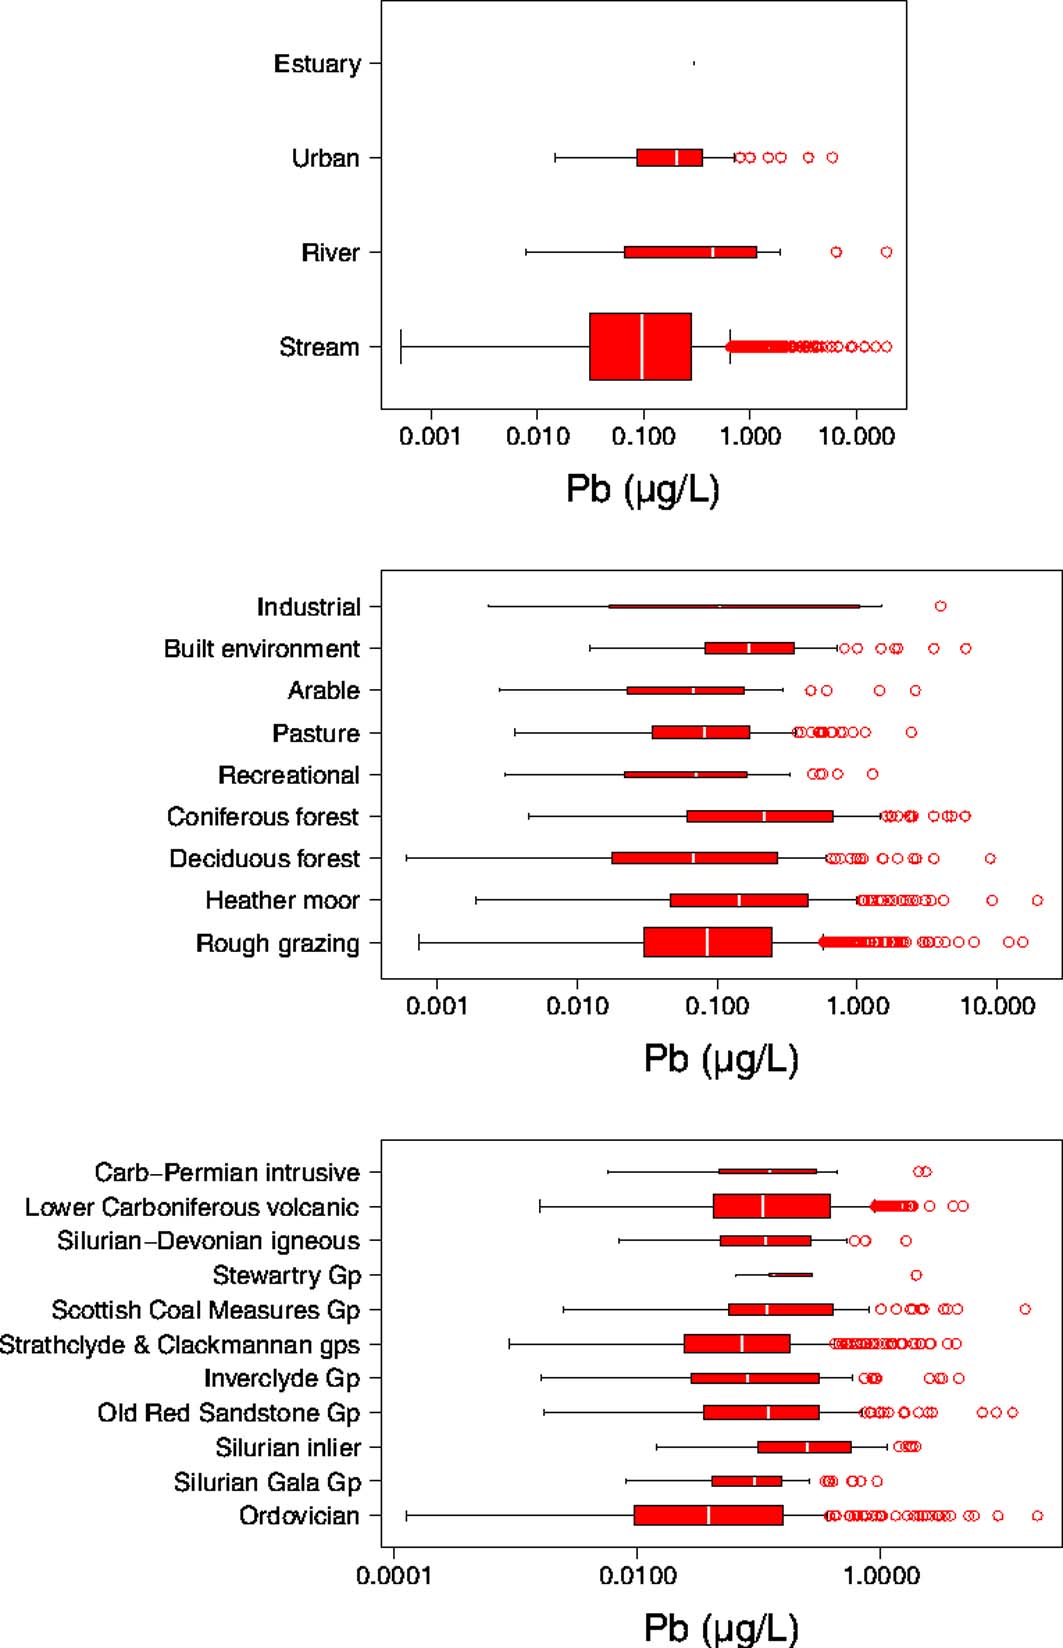
Pb has long been a concern in the urban environment (Farmer & Lyon Reference Farmer and Lyon1977). Despite the ban on petrol use at the start of 2000, MacKinnon et al. (Reference MacKinnon, MacKenzie, Cook, Pulford, Duncan and Scott2011) identified Pb-bearing petrol as a significant contributor to the high Pb content of soil, especially directly adjacent to major roads at a site to the W of Glasgow. Indeed, there are large contents of Pb in the soils in urban areas within the Clyde Basin (Fordyce et al. Reference Fordyce, Everett, Bearcock and Lister2018). It is interesting to note, however, that Pb concentrations are not significantly higher within the Urban dataset than the rural Streams (P>0.05; Wilcoxon rank sum) (Figs 9, 10). This is likely due to mining influences, as discussed previously. While the median Pb concentration is marginally higher in the Urban dataset than in the Stream data set, the range is smaller (Fig. 10). The highest observed concentrations occur in samples from the heather moor land use. Pb values in this class are significantly different from the other land uses (P<0.05; Wilcoxon rank sum) except for those classed as coniferous forest and industrial (Fig. 10).
Box plots showing distribution of Pb concentrations in Clyde stream and river waters, distinguished by water type, land use and geology. Number of samples in each box plot: Estuary = 8, Urban = 122, River = 60, Stream = 1770, Industrial = 9, Built environment = 136, Arable = 43, Pasture = 156, Recreational = 27, Coniferous forest = 142, Deciduous forest = 129, Heather moor = 194, Rough grazing = 974, Carb-Permian intrusive = 15, Lower Carboniferous volcanic = 488, Silurian-Devonian igneous = 89, Stewartry Gp = 5, Scottish Coal Measures Gp = 98, Strathclyde &Clackmannan gps = 294, Inverclyde Gp = 85, Old Red Sandstone Gp = 148, Silurian inlier = 100, Silurian Gala Gp 82, Ordovician (Leadhills Supergroup) = 298.

While there is clearly a source of Pb within the urban environment (Fordyce et al. Reference Fordyce, Everett, Bearcock and Lister2018), it is not readily mobilised into stream waters, as under neutral and alkaline conditions the Pb2+ cation is poorly soluble (Drever Reference Drever1997). An exception to this is within the western urban area of Glasgow, where a low-pH stream also has a relatively high Pb concentration (3.5μgL–1), which may relate to the greater solubility of Pb in acidic conditions. This stream drains an area that includes a sewage treatment plant, an abandoned factory and a hospital.
The highest concentrations of Pb were measured in stream waters draining the area around Leadhills (Figs 1, 9), an aptly named village, built up around the Pb mining industry. As a result of historical mining activities (and the resulting increased oxidation of Fe sulphide), the streams in this area have some of the lowest pH values, and, consequently, Pb is mobilised from galena in the area. While this process is entirely natural, the mining activities have exacerbated the Pb mobilisation problem; additional reactive surface areas have been exposed, which give rise to the increased production of acid, and, consequently, the dissolution of Pb.
The concentrations of Pb in the River and Estuary data sets span the full range, from <0.05 to 19.4μgL–1 (Table 2). The highest concentrations within these data sets are within the Glengonnar Water, which drains the Leadhills area. In the upper reaches of the River Clyde, Pb concentrations are <0.05μgL–1. However, after the confluence with the Glengonnar Water, the Pb concentration in the River Clyde increases to 6.47μgL–1 and remains relatively high (>0.4μgL–1) until 100km downstream.
3. Discussion
3.1. Cr and Pb exceedances
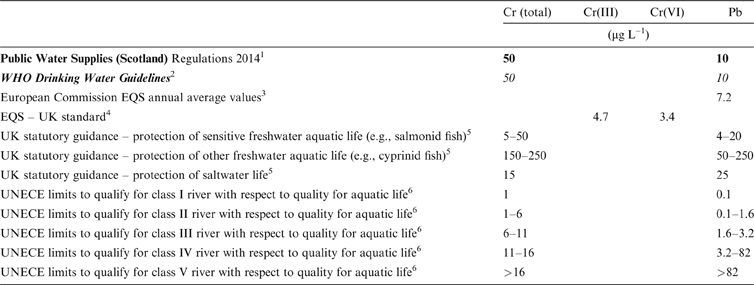
As Cr and Pb can each be harmful to human health and ecosystem function, they are incorporated in numerous guidelines and regulations (Table 4), including those protecting drinking water and aquatic life (UNECE 1993; WSR 2014; SEPA 2017). For Cr, difficulties of preserving samples, analysing for speciation and determining toxicity of individual species, mean guidelines and limits for drinking water are defined as total Cr. Nonetheless, the UK environmental quality standards (EQS) for surface water, driven by the Water Framework Directive (WFD), give maximum annual average concentrations for both Cr(III) and Cr(VI) in rivers and freshwater lakes (Table 4; SEPA 2017).
Relevant water-quality limits and guideline values. Italics indicate guidelines only, not statutory values. Bold indicates drinking water values. Normal text indicates surface water values. Abbreviations: EQS = environmental quality standards; WHO = World Health Organization; UNECE = United Nations Economic Commission for Europe.

The systematic survey of Stream and Urban waters (low order) across the Clyde catchment showed that ten out of 1824 samples exceeded the national limit for total Cr in drinking water (50μgL–1). The samples analysed are not from sites used as drinking water sources, but the values are discussed in this context as a useful point of reference. Median concentrations of Cr observed in streams were <1μgL–1 for all datasets, although the highest value, occurring in the Urban streams, was 971μgL–1 (Table 2), more than an order of magnitude greater than the drinking water limit and two orders of magnitude greater than the national EQS limits for Cr species (Table 4). No EQS exists for total Cr.
Under lower-intensity human activities, beyond the Glasgow urban area, the concentrations of dissolved Cr were low. Within the Stream samples dataset, 97% had Cr concentrations below 1μgL–1, therefore fulfilling the UNECE (United Nations Economic Commission for Europe) criterion for class I rivers with respect to aquatic life (Table 4; UNECE 1993). Class I is the most stringent of five statistical classes defined by UNECE for the purpose of the maintenance of aquatic life.
For Pb, three out of 1824 samples (0.2%) in the Stream and Urban data sets had concentrations greater than the national drinking water limit (10μgL–1), and five out of 1824 (0.3%) were greater than the EQS for Pb of 7.2μgL–1 (Table 4). Median values were <0.5μgL–1 in water from all categories, but with the observed maximum value of 19.4μgL–1 (Table 2) in the Urban streams – almost double the limit for drinking water.
Within Stream samples taken in the rural areas, only 51% had Pb concentrations below 0.1μgL–1, i.e., below the UNECE criterion for class I rivers (UNECE 1993). Most Stream samples (96%) would fulfil the lower UNECE criterion for class III rivers (Table 4).
Figure 9 shows the importance of the Leadhills mineralised area with regards to Pb in the Rivers dataset. Immediately downstream of the confluence with the Glengonnar Water, which drains the Leadhills area, the Pb concentration causes the River Clyde to fail the remit for Class I river status (UNECE 1993; Table 4). Exceedances, where they occur, are most substantial and more widespread for Cr than they are for Pb. However, exceedances above drinking water standards and EQS values are uncommon.
3.2. Relationships with solid phases
Soils and stream sediments each represent potential sources as well as sinks of trace elements, including Cr and Pb. As the water samples were not taken at the same time as the stream sediments, a direct comparison between water and sediment contents is difficult. While every effort was made to take samples at the same site, almost 30 years had elapsed between sampling surveys and exact site matches were unlikely. In the late 1980s, hand-held GPSs were also not used, so larger errors on sample site locations were possible. Nonetheless, samples from each survey were taken within relatively close proximity and some general conclusions on spatial relationships between them can be made. To allow some comparisons between water and stream sediment concentrations, the stream sediment values at each water sample location were extracted from interpolated raster maps of stream sediment concentrations.
3.2.1. Cr
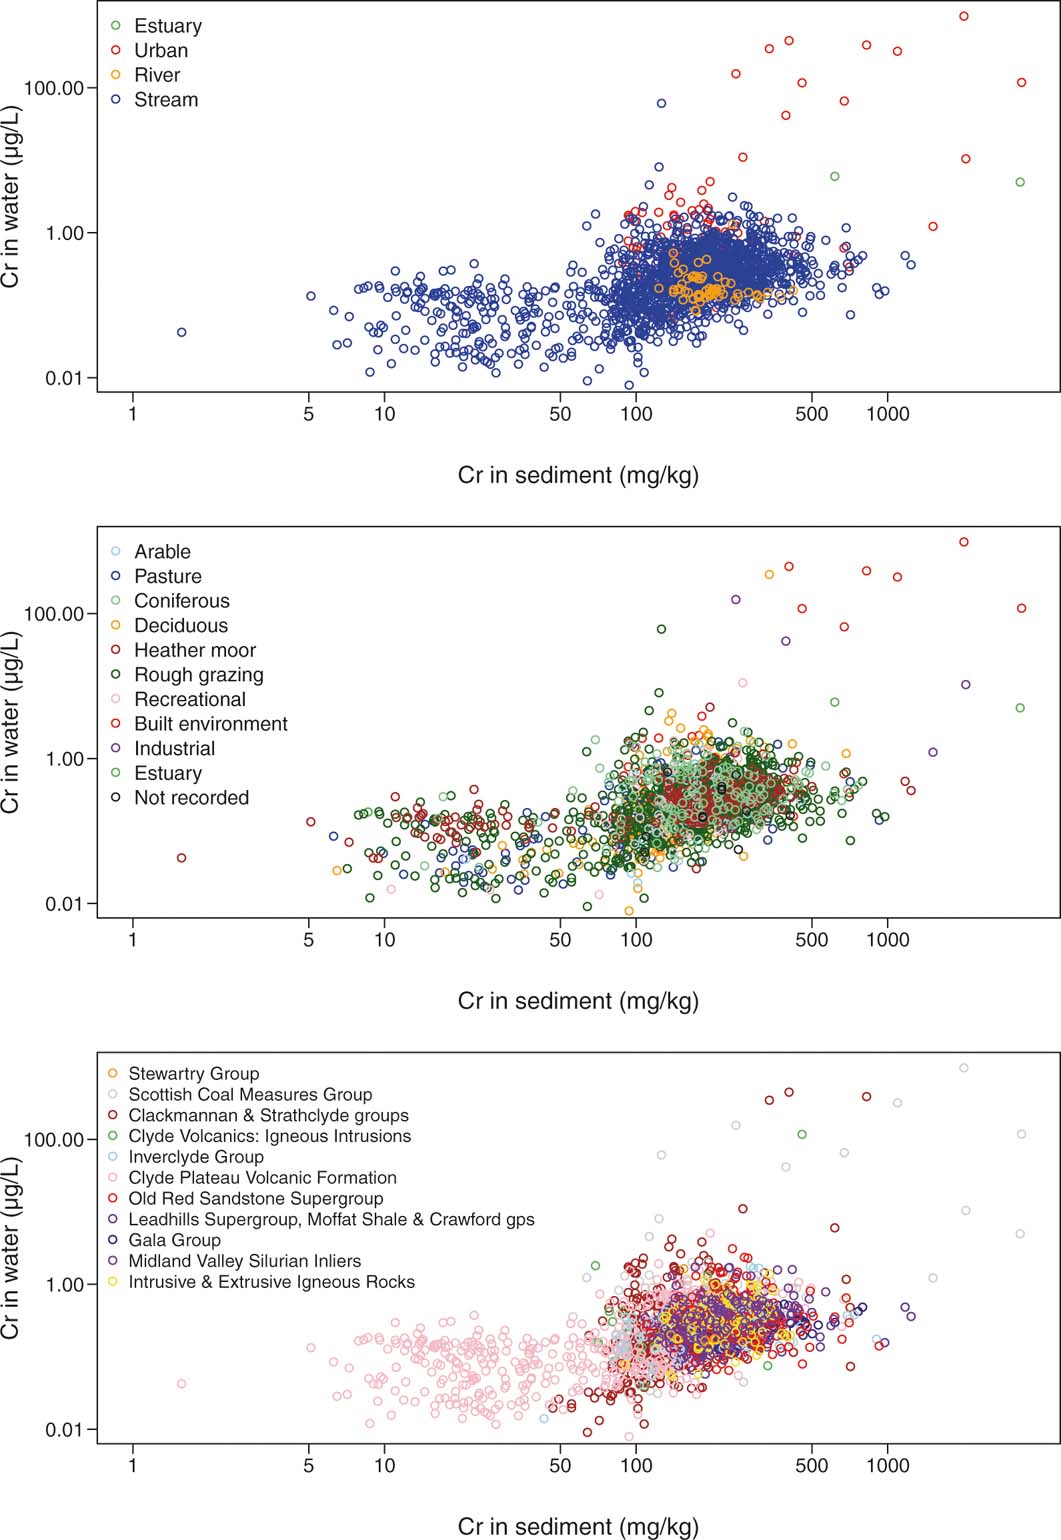
Cr in the Clyde water does not show any clear spatial relationship with soil Cr (Fordyce et al. Reference Fordyce, Everett, Bearcock and Lister2018), but a broad positive correlation (Spearman 0.46; P<0.05; n=1892) is observed with interpolated Cr in stream sediment (Fig. 11; BGS 1993). The greatest contents of both dissolved Cr and Cr within stream sediments are present in the Urban samples, occurring within the built environment and industrial areas. These correspond also with the Clackmannan Group and Scottish Coal Measures. Some of the lowest dissolved concentrations are found in the Clyde Plateau Volcanic Group, which has notably lower stream sediment Cr contents. Dissolved Cr concentrations are clearly, at least in part, a function of the Cr content of the source term.
Relationship between concentrations of Cr in stream water and interpolated Cr in stream sediment collected from the same locations within the Clyde catchment datasets.

The stream sediment samples were collected in the 1980s, and predate the opening of the Greengairs landfill in 1990 (Herald Scotland 2005). This presents an anomaly in the water–sediment relationship in sites downstream of the landfill. At these sites there is significant Cr impact from landfill effluent in water samples, which is obviously not reflected in the stream sediment samples.
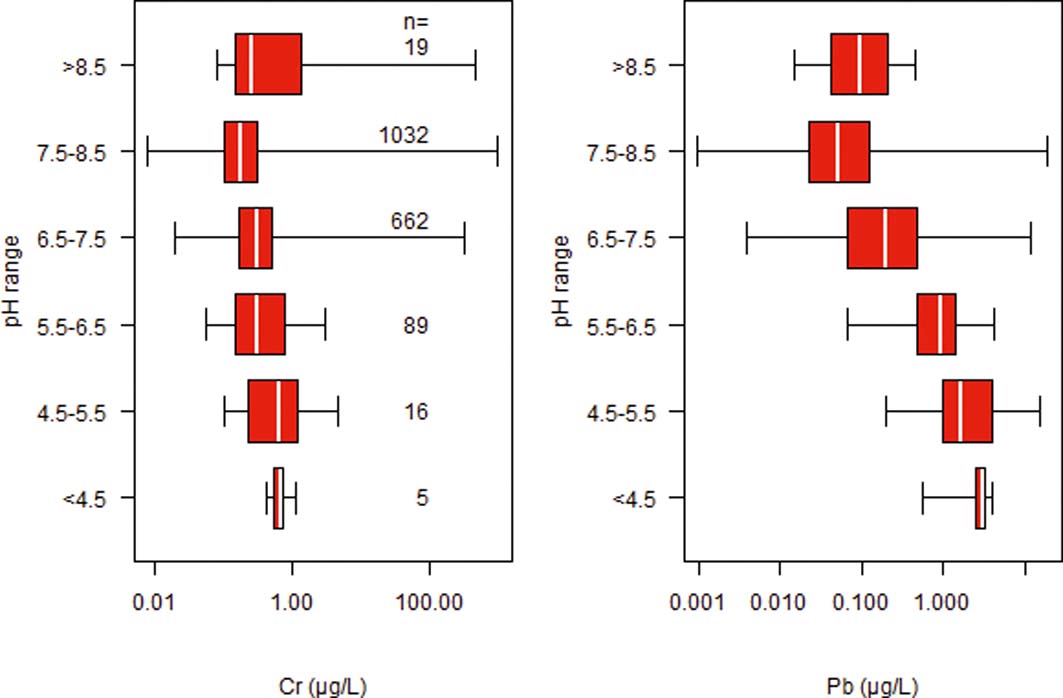
Concentrations of Cr in the Clyde waters show some dependence on the water pH (Fig. 12), with a suggestion of slightly higher median concentrations in acidic conditions. However, the magnitude of the variation is small, median concentrations varying by <1μgL–1 over the pH range of the samples. By far the largest range and highest absolute concentrations are found in the pH range 7.5–8.5, predominantly in samples from the urban area. A relatively high median concentration is also observed for the pH >8.5 samples. The largest whiskers in the box-and-whisker plots (Fig. 12) all occur in the neutral to alkaline pH range and confirm the association of CrO4 mobility with high-pH conditions.
Relationship between pH and concentrations of Cr and Pb in Stream and Urban (low-order) water from the Clyde catchment. Numbers of samples per box are also indicated.

The influence of anthropogenic Cr on stream water compositions in the urban centre of Glasgow is clear. The occurrences of COPR are associated with high-pH Cr(VI)-rich leachate (likely as CrO42–). The COPR not only provides a source of Cr, but the waste has such a high-pH buffering capacity that it provides a high-pH environment, ensuring that Cr(VI) remains in solution even downstream of the point source. As a result, only 64% of the Urban streams sampled had Cr concentrations <1μgL–1.
3.2.2. Pb
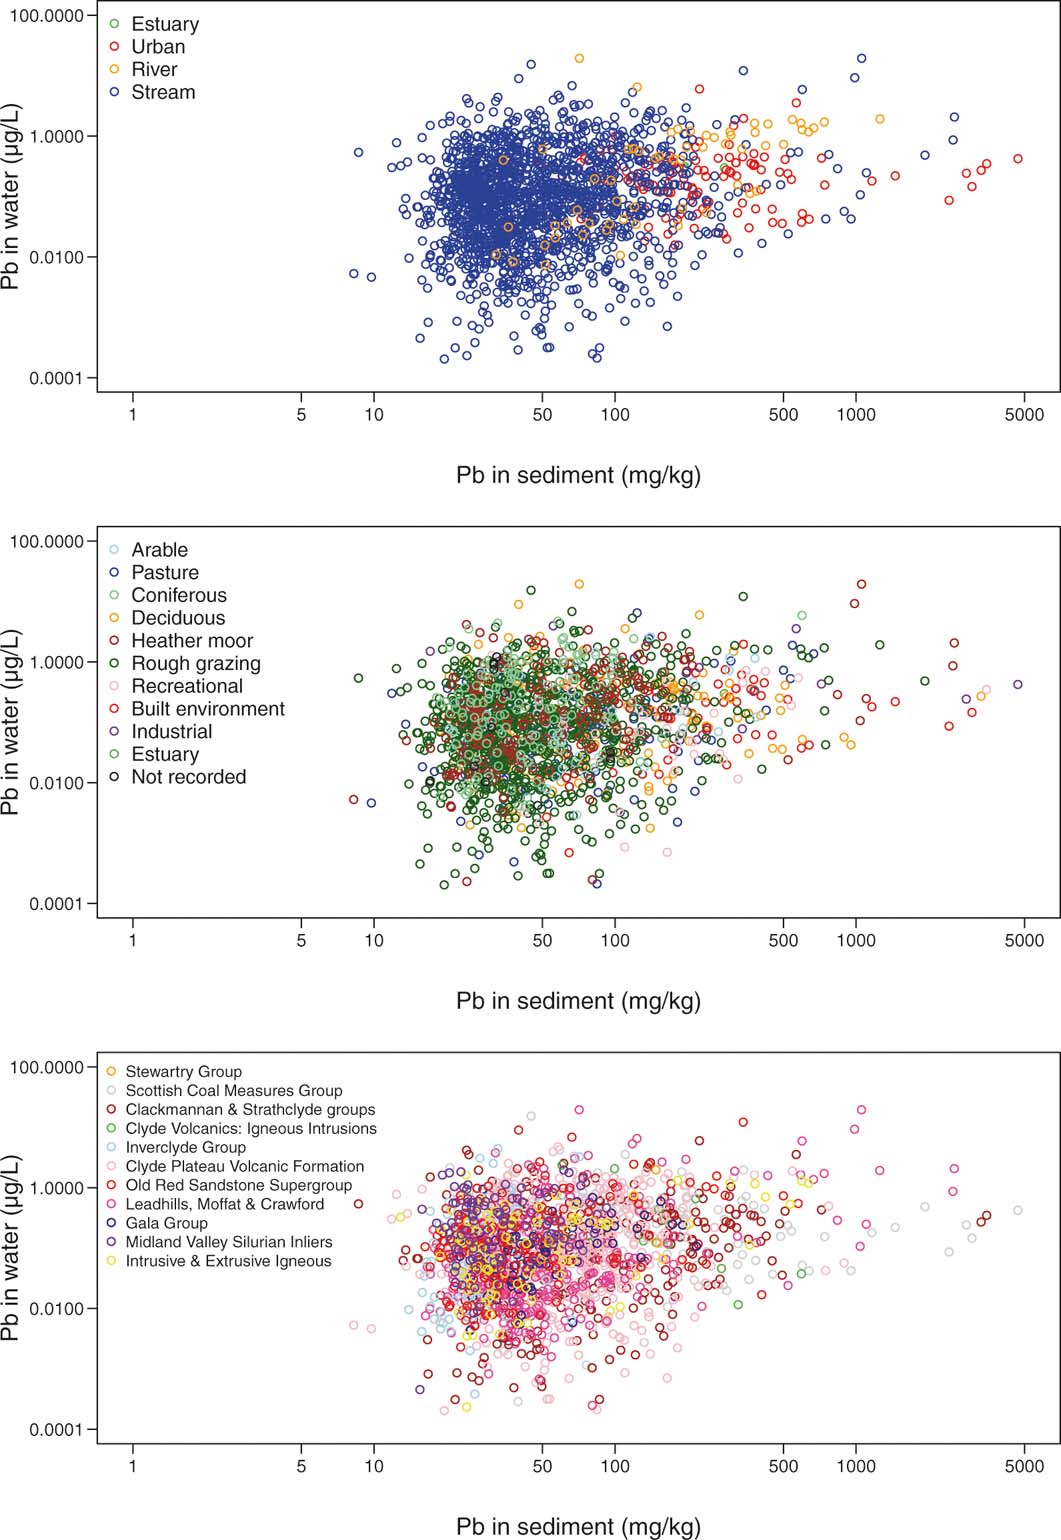
A spatial concurrence exists between the distribution of Pb in the soils and the stream sediments (BGS 1993; Fordyce et al. Reference Fordyce, Everett, Bearcock and Lister2018), with the highest concentrations being found around Leadhills, within the urban areas, and around Muirshiel Regional Park in the NW of the region. However, a plot of dissolved Pb concentration against interpolated stream sediment Pb content (Fig. 13) shows a poor correlation (Spearman 0.17; P<0.05; n=1892), suggesting that dissolved Pb is not purely a function of the Pb content in the solid phase. Relatively high Pb contents are found in the Urban stream sediment dataset, but, otherwise, relationships as a function of land use, water type and geology are not obvious. Pb-enriched ore mineralisation is relatively localised within the catchment, so its impact on the distributions of dissolved Pb concentrations overall is limited. The lack of correlation between Pb in water and sediment occurs because of the pH dependence of Pb mobilisation. Although there is a source of Pb in the urban environment (Fordyce et al. Reference Fordyce, Everett, Bearcock and Lister2018), the relatively low concentrations in Urban streams (Fig. 13) occur because the high pH of the stream water means it is likely that Pb is adsorbed onto surfaces of metal oxides or clays.
Relationship between concentrations of Pb in stream water and interpolated Pb in stream sediment collected from the same locations within the Clyde catchment datasets.

While the range of Pb concentrations in the Urban dataset is smaller than the range in the Streams (Fig. 13), only 26% of the Urban dataset had Pb concentrations below 0.1μgL–1 – the UNECE criterion for class I rivers (UNECE 1993). This indicates that Pb is widespread in the urban freshwater environment, possibly owing to anthropogenic activities, and water properties, which can increase Pb solubility. While the lowest Pb concentrations might be expected in the Streams dataset, it is worthy of note that the highest concentrations are also present in rural areas of the Clyde basin. Indeed, the natural occurrence of Pb mineralisation in the Leadhills area gives rise to very high concentrations of Pb in Stream water.
A box plot of pH against dissolved Pb concentrations in Stream and Urban waters (Fig. 12) shows a decrease in median Pb concentration at increasing pH due to the greater mobility of Pb in acidic water. This follows from the cationic behaviour of Pb in solution: it is soluble under oxidising and acidic conditions (Drever Reference Drever1997).
4. Conclusions
This study provides, for the first time, detailed maps of the spatial distributions of elements of potential health and environmental concern in stream water of the Clyde catchment. It also provides an assessment of the extent of exceedance of Cr and Pb above national and international statutory limits and guidelines. On a whole-catchment scale, percentage exceedances above drinking water limits are minor (0.5 % and 0.2 % for Cr and Pb, respectively), as is exceedance above the EQS for Pb (0.3 %). The distributions of exceedances are a function of combined factors, the most significant being water pH and the distributions of Cr and Pb solid-phase sources, respectively.
Although the exceedances are low across the whole catchment, some are locally significant. For example, there is no responsible person or body for the contaminated discharges from non-coal sources (The Coal Authority 2011). This means that the attainment of ‘good status' under the WFD is likely to be unachievable by 2027. In the Glengonnar Water catchment, SEPA have undertaken and commissioned work relating to assessing the risks to human health and subsequent improvement of the surface water in response to the WFD (SEPA 2011; The Coal Authority 2011; Chandler et al. Reference Chandler, Cromie, Breen and Ramsay2012).
Elevated concentrations of Cr are localised to specific areas within Glasgow, where COPR is present and provides a high-pH aqueous environment in which Cr is soluble. The low concentrations in the Streams data set put these highly contaminated streams into context. The highest Pb concentrations are found within the rural environment, as a result of local mineralisation and mining. High Pb concentrations are not evident in the urban streams as the ambient high-pH conditions favour adsorption of cationic Pb species to mineral surfaces in the stream bed.
The ultimate sources of the Cr or Pb in the waters in the Clyde catchment are naturally occurring ore minerals. However, human interventions caused by mining and processing operations over many years have served to redistribute these trace metals and enhance their mobility and transport in the environment, as seen today in some stream waters, sediments and soils across the Clyde catchment.
The environmental legacy of the mining around Leadhills is similar to comparable-sized metal mining operations at Avoca (Ireland), Newtownards (Northern Ireland) and Parys Mountain (Wales) (Moles et al. Reference Moles, Kelly and Smyth2016). Such abandoned mine sites can have tailings dams, spoil heaps and soil contaminated by smelting, leading to local and widespread contamination of water courses (Bearcock & Perkins Reference Bearcock and Perkins2007; Moles et al. Reference Moles, Kelly and Smyth2016). As long as sources of reactive minerals remain in the environment there is the potential to affect the quality of surface waters. Wastes derived from Roman metal mining activities still exist in the environment around the world (e.g., Jordan (Pyatt et al. Reference Pyatt, Gilmore, Grattan, Hunt and McLaren2000), Spain (USGS 1999) and Wales (Davies Reference Davies1987)), demonstrating the potential longevity of human interventions.
5. Acknowledgements
The authors would like to thank the British Geological Survey (BGS) Geochemical Baseline Survey of the Environment (G-BASE) and Estuarine Contamination project staff, student volunteers and analytical laboratory teams for their invaluable contributions to the Clyde Basin surface water surveys. In particular, Bob Lister, Dr David Jones, Dr Solveigh Lass-Evans, Sarah Nice, Cathy and Andreas Scheib, Mick Strutt, Andrea Mills, Dr Simon Chenery, Dr Michael Watts, Dr Chris Milne, Sean Reeder, Dr Jenny Cook, Juliet Harvey and Sean Quigley. The Local Authorities (Glasgow City Council, Renfrewshire Council, East Renfrewshire Council, Inverclyde Council, North Lanarkshire Council, South Lanarkshire Council, East Dunbartonshire Council and West Dunbartonshire Council), farmers and land owners in the Clyde Basin area are greatly thanked for their cooperation during the surveys. The authors are grateful to Barbara Palumbo-Roe (BGS) for her comments on the text. This paper is published with the permission of the Executive Director of the British Geological Survey. BGS/NERC reference: PRP18/043.