I INTRODUCTION
Low Earth Orbit (LEO) earth observation satellites are gathering an increasing amount of data. Since a LEO satellite is in the line of sight of a single ground station for approximately 10 min the available time to download the collected data is becoming “an increasingly serious bottleneck” [Reference Greda1].
A new concept for downloading data to a ground station involves Geostationary Earth Orbit (GEO) satellites as a relay station. Considering an LEO earth observation satellite, typically moving on a polar orbit [Reference Greda1], the Inter-Satellite Link (ISL) with a GEO relay station would be available for at least 50% of the LEO satellite's orbital time. Compared to the access time of a single ground station, this offers an increase by a factor of 15 [Reference Greda1]. “Simultaneous data link communication from multiple LEO satellites to one GEO satellite becomes feasible, if a suited multibeam antenna is used on the GEO satellite for receiving the ISL signals” [Reference Greda1]. Using a reflector antenna with a feed array near the focal plane of the reflector, incident signals from different directions are focused on different spots of the feed array. This can be used to distinguish between signals from different LEO satellites. Over time, the location on the feed array varies for each signal, as the LEO satellites are moving and therefore change position relative to the GEO satellite. This demands a reconfigurable interface between the multibeam antenna and the subsequent signal processing unit to keep track of different signals of interest. A Radio Frequency Microelectromechanical System (RF MEMS) based switch matrix is well suited to implement such a reconfigurable interface due to its low losses and inherent “nearly zero power consumption” [Reference Siegel, Ziegler, Schoenlinner, Prechtel and Schumacher2].
A more detailed description of the multibeam antenna concept can be found in [Reference Greda1, Reference Greda, Knuepfer, Knogl, Heckler, Bischl and Dreher3].
II SWITCH MATRIX CONCEPT
A) Nomenclature
In the following discussion of the switch matrix, letters are assigned to the 16 single feed antenna elements at the input of the switch matrix. Since the 4 × 4 array will be divided into different logic groups, subscripts are used to identify the corresponding group of the feed antenna element.
Numbers from 1 to 4 and from 1′ to 4′ are used to distinguish between the eight signals from the two different subarrays, being switched to different signal processing units at the output of the switch matrix. Each subarray receiving four signals is related to the incident signal of one LEO satellite.
B) Specification
To demonstrate the capabilities of the antenna system described in Section I, a 4 × 4 feed antenna array prototype will be built. The minimum demonstration scenario of two LEO satellites will be considered. The two incident signals are separated by using 2 × 2 subarrays within the 4 × 4 array.
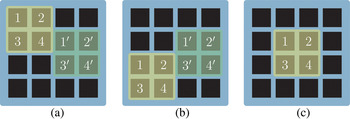
The synchronous use of a single antenna element in two or more subarrays results in the need for power dividers. Since this increases the number of inputs of the switch matrix, for a first demonstration only non-overlapping subarrays will be considered. Fig. 1 exhibits three examples out of a total of 17 different possible subarray combinations, including a single case, in which only one non-overlapping subarray is usable.
Three examples out of 17 different combinations for two 2 × 2 subarrays of a 4 × 4 array [4]. (a) Combination 1. (b) Combination 2. (c) Combination 3.

Unused antenna elements have to be terminated by a 50 Ω load to suppress resonances and minimize interference with other antenna elements.
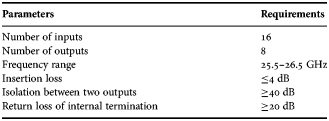
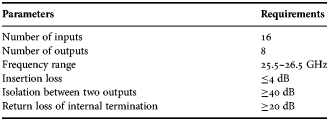
Table 1 gives a summary of the specifications – reduced requirements of the demonstrator application are taken into account.
Specifications for switch matrix.
C) Simplified design approach
Based on the considerations of Section B), the design for the switch matrix can be simplified to reduce the complexity of the design. Since 2 × 2 subarrays are used to receive each incident signal, only square-shaped combinations need to be realized (Fig. 1). Assuming full control over phase and amplitude excitation for each antenna element, 24 different variable combinations of four signals in a 2 × 2 subarray can be covered by one fixed mapping (e.g. Fig. 1(c)), readjusting phase and amplitude distribution. A fully switchable matrix results in a lot of redundant combinations [Reference Inayat5]. In a smart concept, this can be used to simplify the design.
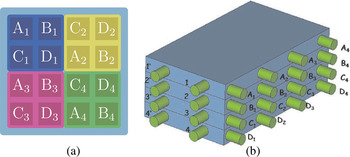
Removing unnecessary and redundant combinations, the target 4 × 4 array can be built on a base of four 2 × 2 subarrays indicated in Fig. 2(a) by different colors and subscripts. Consequently, the design is reduced to four switch matrices each with four inputs and two outputs, as depicted in Fig. 2(b).
Feed antenna patch scheme for modular approach ([4], based on [5]). Different 2 × 2 subarrays are indicated by different colors and subscripts. (a) Target design. (b) Modular approach.

Following the labeling of Figs 1 and 2, each matrix maps the signals n and n′ (n ∈ {1, 2, 3, 4}) to a specific feed antenna element X (X ∈ {A, B, C, D}) in one of the four subarrays:
 $$n\comma \; n^\prime \rightarrow \lcub X_1\comma \; X_2\comma \; X_3\comma \; X_4\rcub.$$
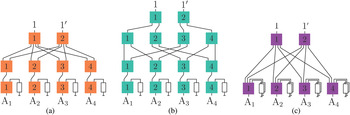
Fig. 3(a) depicts the matrix layout of one module, as suggested in [Reference Figur, Schoenlinner, Prechtel, Vietzorreck and Ziegler4] extended by 50 Ω terminations for each input.
Matrix layout of simplified design approach. One out of four modules, shown for n = 1 and X = A referring to equation (1). (a) Approach suggested in [4] with additional 50 Ω terminations. (b) Approach realized with commercially available RF MEMS on Rogers RT/Duroid 5880. (c) Approach realized with EADS in-house RF MEMS on Rogers Ultralam 3850 LCP.

Owing to the specifications of isolation between two outputs, the Single Pole Four Throw (SP4T) switches have been replaced with two cascaded Single Pole Double Throw (SPDT) switches in the Radant MEMS-based approach as shown in Fig. 3(b).
Taking into account four modules, a total of 56 SPDT switches are necessary.
The applied simplifications allow us to reduce the complexity dramatically, compared to the maximum functionality design approach in [Reference Figur, Schoenlinner, Prechtel, Vietzorreck and Ziegler4], incorporating 24 Single Pole Eight Throw (SP8T) and 80 SPDT switches. The design based on Fig. 3(b) is feasible, and provides full functionality in terms of specification.
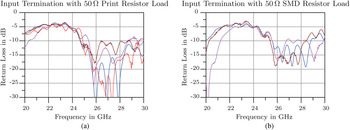
In addition to this design, another switch matrix module is built, based on EADS in house technology RF MEMS [Reference Siegel, Ziegler, Schoenlinner, Prechtel and Schumacher2]. In contrast to the Radant MEMS, isolation specification can be met using SP4T switches, which further decreases design and layout complexity, as depicted in Fig. 3(c). The lower four switches are chosen to be SP4Ts, even though Single Pole Three Throw (SP3T) switches would be sufficient. This reduces the design effort for the RF MEMS, that goes along with designing SP3T as well as SP4T switches. This decision allows us to integrate and compare two different 50 Ω input terminations in the module: discrete Surface Mounted Device (SMD) and carbon print resistors. Since the parasitics of SMD housings are known to cause problems at higher frequencies, we hope to avoid these by using printed resistors without housing. On the other hand, sheet resistance of printed resistors is hard to control, hence SMD resistors are kept as a backup.
III ROGERS RT/DUROID 5880 MATRIX USING RADANT MEMS SWITCHES
A) Design
1) DESIGN CONSIDERATIONS
The chosen RF MEMS switches (RMSW220HP from Radant MEMS) require a defined potential on the Radio Frequency (RF)-lines. Therefore, the signal lines are connected to ground by a λ/4-stub, presenting an open circuit to the signal and a short circuit to ground at Direct Current (DC). Good results of this approach are presented in [Reference Meniconi, Schoenlinner, Prechtel, Hartmann, Sorrentino and Ziegler6].
Since 50 Ω resistors for applications above 20 GHz are hard to find, matching networks have been applied to realize a suitable load around the design frequency of 26 GHz. In combination with the λ/4-stubs, this matching determines the bandwidth of the switch matrix.
2) LAYOUT
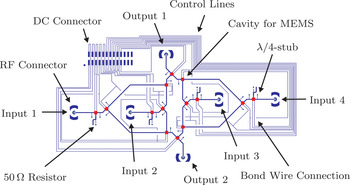
Based on Fig. 3(b), a Printed Circuit Board (PCB) layout for Rogers RT/Duroid 5880 was designed. The layout of a single 4 × 2 module is depicted in Fig. 4. To achieve the full specified functionality of the 16 × 8 switch matrix, four such modules are combined to one unit.
Layout of a single 4 × 2 Rogers RT/Duroid 5880 module.

In [Reference Figur, Schoenlinner, Prechtel, Vietzorreck and Ziegler4], a multilayer stack-up is proposed to minimize the insertion loss of the switch matrix. In this first layout, a planar design is chosen to reduce complexity. The inputs and outputs on the PCB are connected by cables with the feeds through the housing, because the planar design does not allow for RF signal line crossings. It was accepted in consequence that the more simple, planar layout is likely to incorporate higher losses, due to additional cable lengths.
Several control lines are needed to set up the switch matrix state. Since some switches are always used in the same state, the according control lines are connected on-board to minimize the number of signals. Bond wire connections are used to realize inevitable crossings of the control lines.
To decrease the bond wire inductance between the on-board RF lines and the integrated RF MEMS switches, the bond wires are kept as short as possible. The switches are mounted in cavities, so that the bond pads of the PCB and the RF MEMS chips are at the same level. Three parallel bond wires are used to further minimize the inductance.
3) INTEGRATION
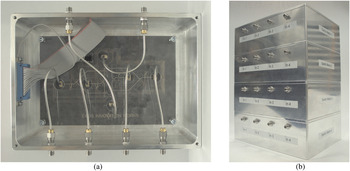
As stated in Section III.A1), four single 4 × 2 modules are combined to form one 16 × 8 switch matrix. The assembly of the switch matrix is depicted in Fig. 5.
Photograph of the 16 × 4 Rogers RT/Duroid 5880 switch matrix based on four single modules: view of a 4 × 2 module (a) and entire 16 × 8 switch matrix (b). (a) Top view of an assembled module. (b) Assembled switch matrix.

Each module is housed individually as shown in Figs 5(a) and 5(b) to increase isolation between adjacent signals. The interface features six K connectors for RF signals and a 25 pin D-subminiature connector for the control signals.
B) Measurements
1) MEASUREMENT METHOD
The insertion loss is characterized between input and output of the housing. Isolation is evaluated as the insertion loss from one input to one output, while the signal is routed to the other output. This way, the inter signal interference is characterized.
Return loss can be considered under different conditions. In one case, return loss can be obtained while measuring insertion loss from each input to each output. In the second case, the input is terminated with a 50 Ω load. In this case, the measured result shows the performance of the termination.
Representative measurements are shown in the following graphs. The performance of the modules is fully described by the chosen measurements due to the symmetry of the design approach in Fig. 4.
2) INSERTION LOSS AND ISOLATION
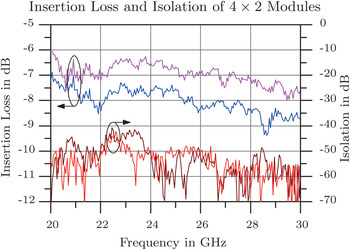
In Fig. 6, measurements of isolation and insertion loss are shown. Isolation is around 50 dB in the whole frequency range of interest.
Measured insertion loss and isolation of two different paths of the 4 × 2 switch matrix module.

The insertion losses are 7 and 8.25 dB at 26 GHz, depending on the used input. The inputs 1 and 4 exhibit longer lines and therefore, losses are higher than for inputs 2 and 3.
A measured insertion loss of 0.5 dB/cm is consistent with the difference in line length of 2.5 cm. The loss of 0.5 dB/cm is higher than expected and is the main reason for not meeting the initial specifications of Table 1.
3) RETURN LOSS
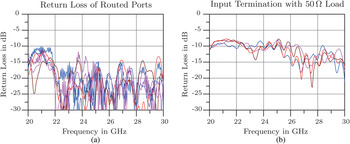
The return losses for matrix outputs as well as inputs that route signals to an output of the matrix are depicted in Fig. 7(a). Values lower than −18 dB show good matching. Fig. 7(b) gives the measurement results for the 50 Ω input terminations. Around 26 GHz, the return loss is between 8 dB and 16 dB. It is assumed that with a more uniform integration of the resistors, the performance will be more consistent.
Return loss measurements of the 4 × 2 switch matrix module. (a) During transmission measurement. (b) Terminated inputs.

IV LCP MODULE USING EADS IN HOUSE RF MEMS TECHNOLOGY
A) Design
1) LAYOUT
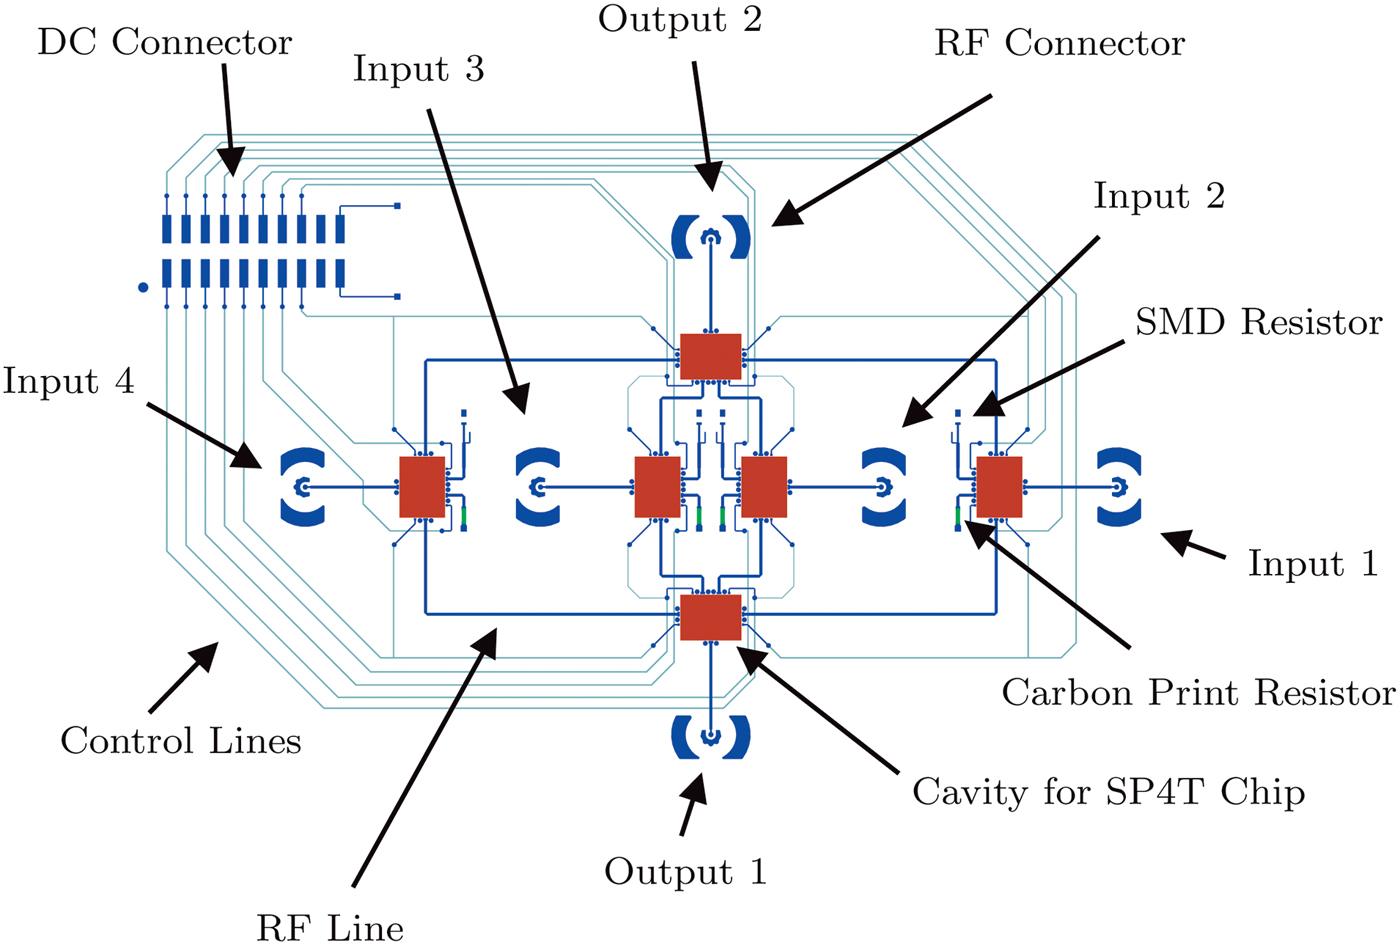
The layout shown in Fig. 8 is based on Fig. 3(c) and therefore similar to the presented design of the Rogers RT/Duroid 5880 module. Removing the restrictions and design choices introduced by the use of Radant MEMS, this design is less complex and smaller.
Layout of a single 4 × 2 LCP module.
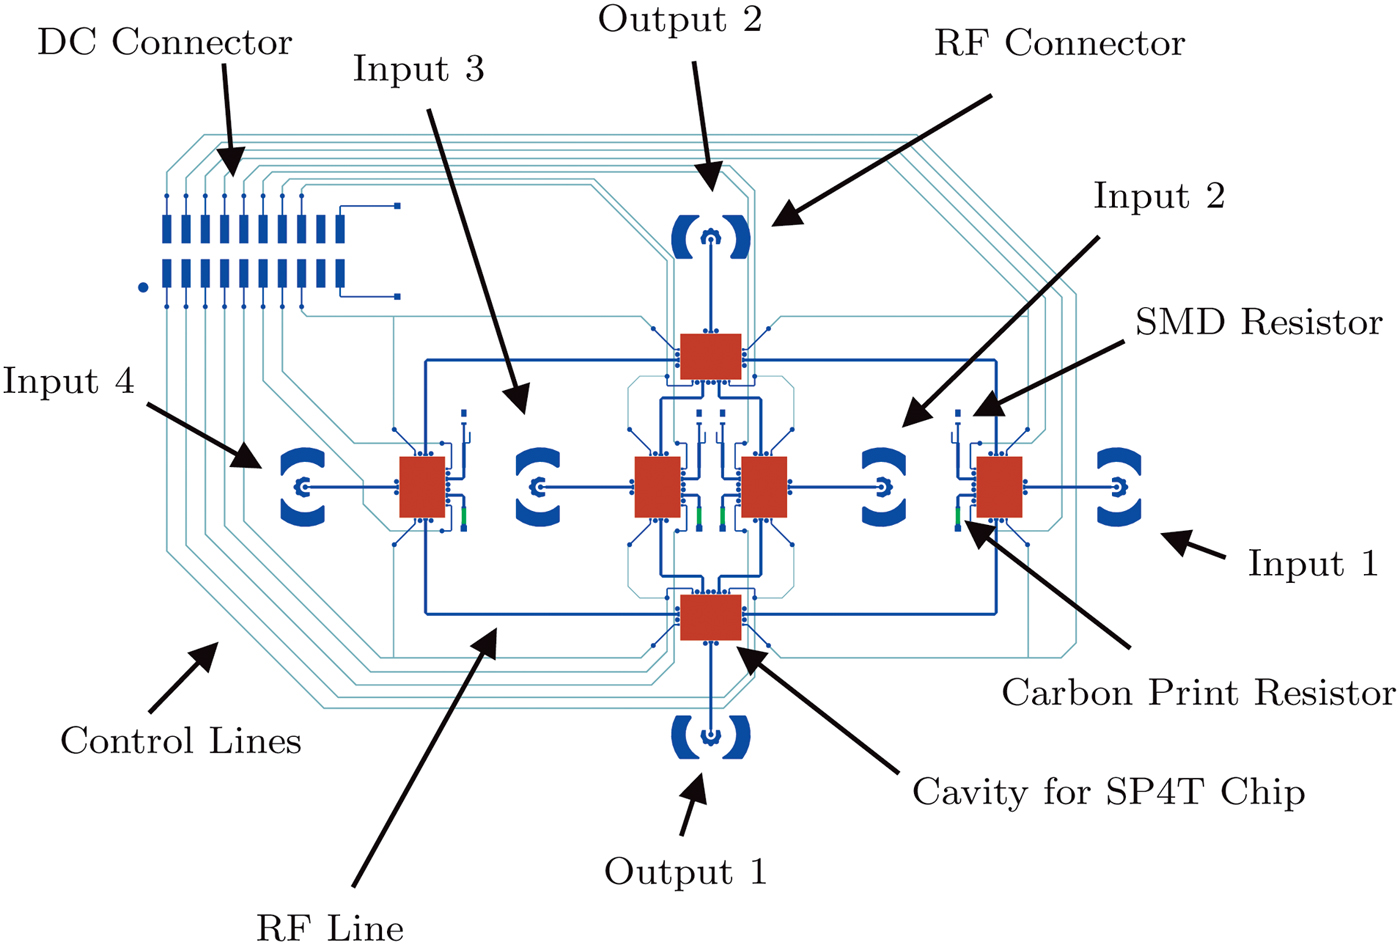
To make use of the multilayer capabilities [Reference Kingsley7] of LCP and reduce top layer complexity, the control lines were routed on an inner layer. The Rogers RT/Duroid 5880 board has shown that this is a more favorable approach, because the amount of bond wires in the other modules – necessary to bridge RF lines with the control signals – is too big. The total stack-up results in four metalization layers and three layers of LCP, comparable to Fig. 12.
2) INTEGRATION
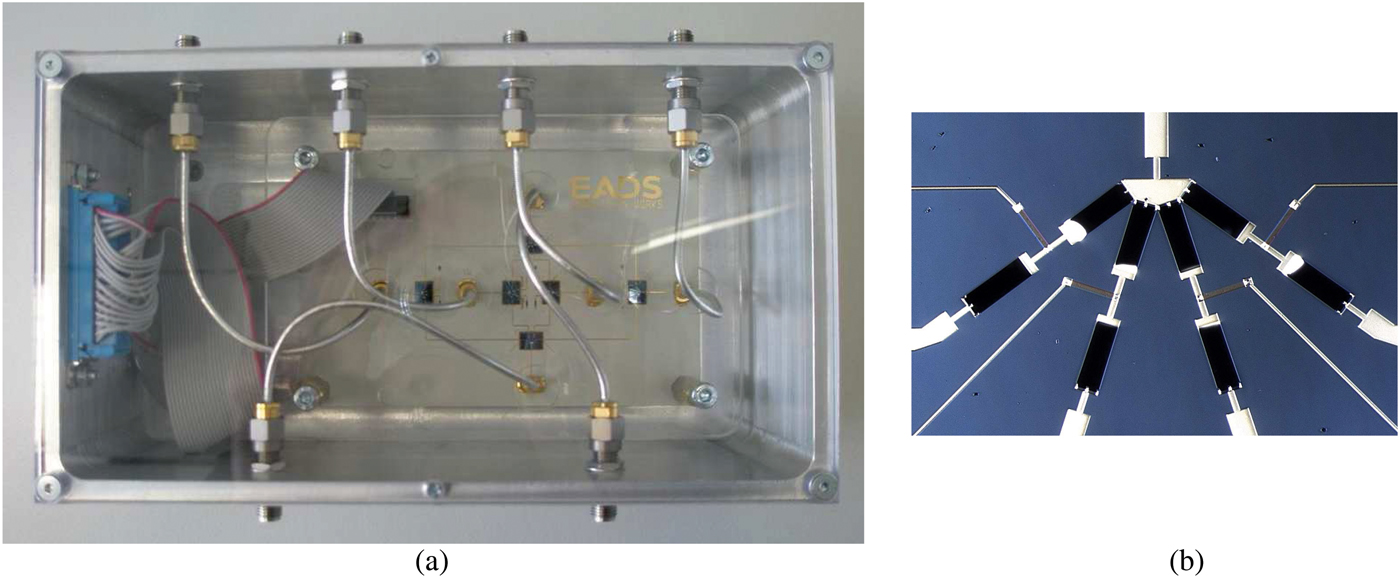
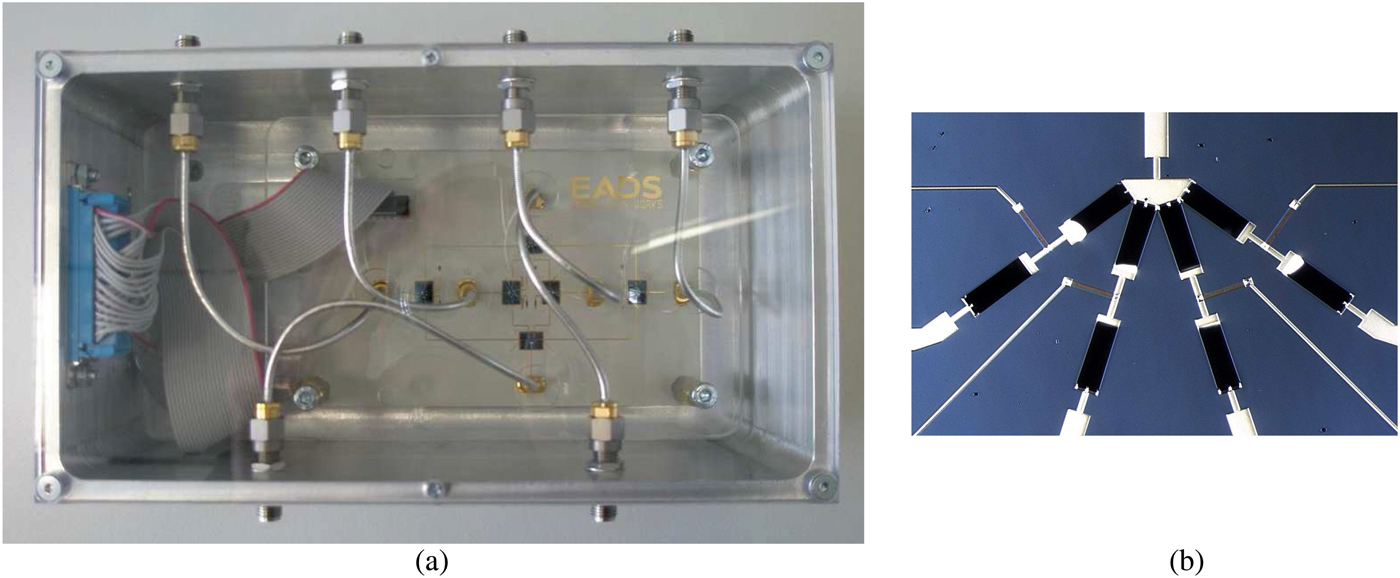
The assembly of the LCP-based switch matrix is shown in Fig. 9(a). The integration has been carried out in the same way as the RT/Duroid 5880-based module described before. Fig. 9(b) exhibits a photograph of the integrated, unpackaged SP4T on chip level.
Photograph of (a) the 4 × 2 LCP module and (b) an SP4T. The black parts in (b) indicate the curled cantilever.
B) Measurements
1) MEASUREMENT METHOD
The measurement method used for the LCP-based matrix is the same as described earlier for the Rogers RT/Duroid 5880 PCB.
2) TRANSMISSION
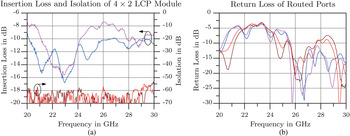
Signal transmission is fully characterized in terms of s-parameters in Fig. 10. The module exhibits a high isolation of more than 55 dB up to 29 GHz, fully meeting the specifications, while the insertion loss is higher than specified. Two representative paths have been measured and show insertion losses of 10.2 dB and 7.5 dB for the longer and shorter paths on the LCP substrate, respectively. A detailed analysis of the losses is given in Table 2 in Section IV.C) to understand the difference between expected losses and measurement results.
Transmission measurements of two different paths of the 4 × 2 LCP switch matrix module. (a) Insertion loss and isolation. (b) Return loss.

Verification of losses in LCP module.

*Values are corrected for reflection losses by equation (2).
Around 26 GHz the return loss is approximately 15 dB. Considering various interconnections in the RF paths caused by cable connections and chip bond wires, 15 dB of matching is a reasonable value.
3) INPUT TERMINATIONS
An important aspect of the switch matrices's functionality is to be able to terminate unused antenna elements with a 50 Ω load. Fig. 11. depicts the measurement results of the two different realized approaches.
Return loss measurements of the 4 × 2 LCP module's input terminations. One SMD resistor termination was not working correctly and is therefore not shown here. (a) Carbon print resistors. (b) SMD resistors.

The carbon print resistors show a return loss of 15 dB at 26 GHz as in Fig. 11(a). The differences in the measurements could be explained by different sheet thicknesses and inhomogeneous misalignments of the mask during fabrication. It is also possible that the print resistors are partially detached from the LCP, causing different parasitics. The PCB material is a bit flexible, so that the board could have been twisted a bit during handling, causing a partial delamination of the thin carbon sheet.
Fig. 11(b) shows better matching than is measured in the Rogers RT/Duroid 5880 module. 15 dB of return loss is good, but needs to be improved to meet the initial specification of ≥20 dB. One of the SMD resistors was not working correctly, hence the graph depicts only the measurements of the three working input terminations.
C) Loss Analysis
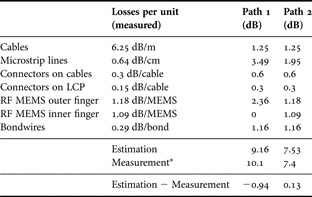
Insertion losses in the modules have been significantly higher than initially specified, consequently measurements were carried out to identify potential improvements. Table 2 gives an overview of different contributions. To compensate for additional reflection losses
 $$\hbox{Insertion loss}=10 \log_{10}\left({\vert S_{21} \vert^2 \over 1- \vert S_{11} \vert^2}\right)$$
has been calculated. This ensures that we consider only losses within the single contributors, but neglects e.g. higher losses on lines due to multiple reflections.
Comparing the estimated and the actually measured losses, the estimation is quite accurate. Differences in integration and assembly are inevitable, but cannot be well quantified, causing some uncertainty in estimation.
The losses on the microstrip lines and in the cables, including connectors, are higher than expected and cause a major part of the losses. In addition the RF MEMS switches can be improved in a redesign to exhibit lower losses. Miniaturizing the layout would shorten the lines and decrease the losses. Further ideas are given in Section IV.D).
D) Further improvement of performance
1) IMPROVED STACK-UP FOR RF MULTILAYER REALIZATION
Part of the losses are caused by the cables and connectors needed to integrate the PCBs into a housing. These losses can be minimized with a more advanced layout of the modules. Fig. 12 exhibits an enhanced stack-up, which features major improvements. This approach was already presented in [Reference Figur, Schoenlinner, Prechtel, Vietzorreck and Ziegler4] as a target concept for an LCP-based switching matrix and has been the base for the current LCP switch matrix module, presented in this work.
The cable-based integration of the switch matrix results in high losses according to Table 2. These losses can be avoided by using glass beads to directly contact the microstrip lines with the feedthrough on the right hand side of the stack-up concept.
As a result of this change, RF signal cross overs become necessary. Using cables, the RF signals could be contacted everywhere on the PCB, while glass bead feedthroughs can only be applied at the edges of the PCB.
Stack-up of target LCP multilayer board. See also [4].

2) OVERHANGING TOP LAYER
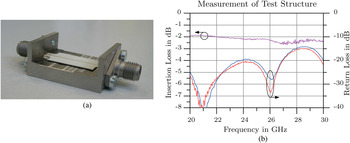
The glass beads suggested in the previous subsection demand an overhanging LCP top layer as indicated in Fig. 12 to keep the path length for the ground signal as short as possible. To verify the feasibility of this approach, a test structure was built and measured. Fig. 13 shows a photograph of this structure and measurement results.
Test structure for overhanging LCP top layer. (a) Photograph of the test structure. (b) Measurement.

At 26 GHz the insertion loss is around 2.3 dB, considering line losses of 1.4 dB, the integration exhibits loss of 0.9 dB for two connectors. This translates into a reduction of insertion loss by 1.25 dB per path compared to the current integration.
3) SIGNAL CROSSING
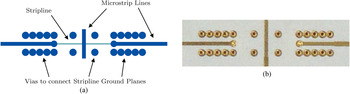
To be able to route RF signals to the edges of the PCB, RF signal crossings need to be realized. Fig. 14 shows the layout and photograph of such a design. Insertion loss is with approximately 1 dB rather high and return loss of 10 dB needs to be improved in a redesign, but the feasibility of this approach could be demonstrated.
Layout and photograph of signal crossing. (a) Layout of the test structure. (b) Photograph of the test structure.

4) ON WAFER 50 Ω TERMINATIONS
An alternative approach for the 50 Ω input termination is given in Fig. 15. Loads can be realized on wafer, so that no additional components have to be integrated on the PCB. Figs 15(a)–15(c) depict a microstrip realization, in which the RF line is terminated with a meandered high impedance line. A lossy implantation zone below the high impedance line is attenuating the signal during propagation. Three different meander structures have shown promising results of different bandwidths in the simulation and have been fabricated to verify this behavior.
Different versions of on wafer 50 Ω terminations. (a)–(c) with meandered microstrip lines, (d) without microstrip line, featuring an oxide opening to contact the implantation. Silicon wafer thickness: 200 µm. (a) Version 1. (b) Version 2. (c) Version 3. (d) Version 4.

Fig. 15(d) shows a version without meandered lines. The end of the microstrip line is directly connected to the lossy implantation zone by a contact hole. The first part of the implantation works as a resistor, while the following part can be seen as a lossy λ/4-transformer. This design is harder to design and control than the first three versions, because the physical implantation zone on the wafer is difficult to model. Owing to the fabrication process, the implantation becomes more diffuse at the edges and cannot be realized as a homogeneous, sharply bordered area.
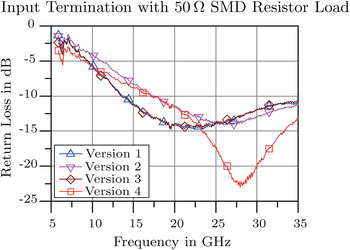
Fig. 16 exhibits the measurement results on 200 µm silicon wafers. Version 1 and version 3 have shown different bandwidths in the simulation, but are identical in measurement. The reasons for this are not entirely clear. Version 2 gives similar results of approximately 14 dB of return loss at 26 GHz. All three versions give already after the first design run similar results to the discrete input terminations realized in the different switch matrix modules.
On wafer return loss measurements of 50 Ω terminations.

Version 4 gives the most promising results, featuring a return loss of −19.7 dB at 26 GHz, which is equivalent to a load of approximately 61.5 Ω. This value is very close to the initial specification. The highest return loss of −23 dB is given at 28 GHz–equivalent to 57.6 Ω. The length of the implantation zone can be adjusted in a redesign to move this maximum to the target frequency of 26 GHz. As stated before, the physical dimensions of the implantation zone are hard to control, hence a frequency shift of 2 GHz can be explained by the uncertainty of physical dimensions of the implantation.
V CONCLUSIONS
A simplified modular design approach for a 16 × 8 switch matrix based on RF MEMS switches has been presented in this paper. While maintaining the full specified functionality, a reduction of complexity toward a feasible degree could be achieved. Two demonstrators have been built using two different RF MEMS technologies. While the first demonstrator uses commercially available RF MEMS switches on a Rogers RT/Duroid 5880 single layer PCB, the second demonstrator integrates unpackaged EADS in house RF MEMS switches in a Rogers Ultralam 3850 LCP multilayer PCB. Both modules have been housed and fully characterized.
The Rogers RT/Duroid 5880 module has been built four times to demonstrate the full specified functionality. In the complete frequency range of 25.5–26.5 GHz, good results have been obtained. Insertion loss between 7 dB and 8.5 dB, isolation of around 50 dB and a minimum return loss of 18 dB have been shown.
For the LCP-based switching matrix only one module was built, since the full switching matrix consists of four equal modules. Therefore, the performance of the switch matrix can be obtained by characterizing one single module. Measurements have shown insertion losses between 7.5 dB and 10.2 dB with return losses of 15 dB. Isolation is higher than 60 dB almost over the complete measured frequency range.
Concerning the application scenario, different path characteristics of the switch matrices affect the phase and amplitude distribution of the feed antenna. Since the control unit is permanently aware of the switch matrix's current state, varying path characteristics can be compensated by signal processing, so that no on board compensation is necessary.
An alternative technology for input termination has been presented. Using on wafer 50 Ω loads, discrete SMDs or printed resistors can be avoided and integration complexity and effort are reduced. The lack of bond wires and solder connections additionally increases reliability.
Finally, an analysis of the losses in the LCP module is given to identify the main contributions and discuss possible improvements. A comparison between insertion loss measurements and the given estimations shows good agreement. The main contributors to insertion loss are the cables and connectors needed for integration and high losses on the microstrip line. While the line losses are difficult to reduce without changing the substrate, the cable losses can be avoided by changing the integration approach, as previously discussed. To prove the feasibility of the suggested integration technique, test structures have been fabricated and characterized.
Since unpackaged RF MEMS are sensitive to environmental influences, a package is developed [Reference Haubold, Figur, Schoenlinner, Kurth and Gessner8] to offer better protection. The next step is to package the RF MEMS and integrate those in a PCB as shown before.
ACKNOWLEDGEMENTS
This work was supported by the Raumfahrtmanagement (engl. Space Administration), which is part of the Deutsche Zentrum fuer Luft- und Raumfahrt e.V. (DLR), through the GeReLEO project under contract no. 50 YB 0911, with funds of the German Federal Ministry of Economics and Technology (BMWi). Special thanks are dedicated to Stefan Leidich for designing the signal crossing presented in this paper.
 Sascha A. Figur received his Dipl.-Ing. (FH) degree in electrical engineering (2007) and M.Sc. degree in information technology (2009) from Fachhochschule Muenster Abteilung Steinfurt, Germany. Currently he is working on his Dr.-Ing. at EADS Innovation Works, Otto-brunn, Germany, where his research interests are “Adaptive and frequency-agile subsystems for e-scan antennas”.
 Erika Meniconi received her Laurea di primo livello degree in information engineering (2007) and Laurea specialistica degree (with distinction) in electrical engineering (2010) from the University of Studies of Perugia, Italy. Currently, she is working toward her Ph.D. at EADS Innovation Works, Ottobrunn, Germany, in collaboration with the University of Studies of Perugia. Her main research interests are RF-MEMS-based subsystems and highly integrated RF-frontends for electronically steerable antennas.
 Ulrich Prechtel received his Diploma in physics from Technische Universitaet Muenchen, Munich, Germany in 1985. Subsequently, he joined the MBB Central Research Lab in Ottobrunn, where he developed manufacturing technologies for high energy radiation detectors and IR-focal plane arrays. From 1995 he successfully worked on research and industrialization of several different types of silicon-based MEMS-type micro-sensors for automotive and aerospace applications. Since 2002, he is responsible for the microwave technology team of EADS Innovation Works, in Ottobrunn, Germany, in which he is focusing on the investigation and exploitation of new RF-devices and subsystems for emerging aerospace and security applications.
 Volker Ziegler received his Dipl.-Ing. degree in electrical engineering and Dr.-Ing. degree (with honors) both from the University of Ulm, Germany, in 1997 and 2001, respectively. From 2002 until 2003, he was a member of the “Knowledge Exchange Group for Research and Technology” at DaimlerChrysler AG in Stuttgart, Germany. Since January 2003, he has been working with EADS Innovation Works, in Ottobrunn, Germany. He is an EADS Expert for“Microwave Technologies and Systems” and is responsible for acquisition and managing of national and international research projects in the field of key microwave technologies for advanced radar and communication systems.
 Roberto Sorrentino is a Professor at University of Perugia, Perugia, Italy. His research activities have been concerned with various technical subjects, but mainly with numerical methods and CAD techniques for passive microwave structures and the analysis and design of microwave and millimeter-wave circuits. In recent years, he has been involved in the modeling and design of Radio Frequency Microelectromechanical Systems (RF-MEMS) and their applications on tunable and reconfigurable circuits and antennas. He is the author or co-author of four books, more than 150 technical papers in international journals, 200 refereed conference papers. In 1990, he became Fellow of the IEEE, in 2000 he was one of the recipients of the IEEE Third Millennium Medal. In 2004, he received the Distinguished Educator Award from IEEE MTT-S. In 2010, he received the Distinguished Service Award from the European Microwave Association. In 2007, he founded RF Microtech, a spinoff of the University of Perugia dealing with RF MEMS, microwave systems, and antennas.
 Larissa Vietzorreck was born in Duesseldorf, Germany. She received her master's degree in electrical engineering (Dipl.-Ing.) from Ruhr-Universitaet Bochum, Germany, in 1992. From 1992 to 1997 she was a Research Assistant in the Department of Electrical Engineering of the FernUniversitaet in Hagen where she got her doctoral degree (Dr.-Ing.). In 1998, she joined the Lehrstuhl fuer Hochfrequenztechnik at Technische Universitaet Muenchen, Germany, as an Assistant Professor. In 1999, she was the conference secretary of the European Microwave Conference in Munich and in 2012 scientific chair of the national URSI Kleinheubacher Tagung. She acts as reviewer for several journals and conferences and has published more than 100 contributions in journals and conference proceedings. Her current research interests are design and simulation of microstructured components and development of numerical software tools.
 Bernhard Schoenlinner was born in Trostberg, Germany, in 1973. He received his Dipl.-Ing. degree in electrical engineering in 2000 from Technische Universitaet Muenchen, Munich, Germany and he received his Ph.D. degree in electrical engineering in 2004 from the University of Michigan at Ann Arbor, USA. Since 2004, he has been with EADS Innovation Works in Ottobrunn, Germany, as a research engineer in the Microwave Technologies Team. His work focuses on advanced microwave and millimeter wave circuits and subsystems for aeronautic and space applications and he is responsible for managing national and international research projects.