Introduction
This study characterizes the variability of quartz optically stimulated luminescence (OSL) sensitivity in the sub-crystal and single-grain scales and appraises the magnitude of OSL sensitization due to illumination–irradiation cycles. Specifically, the study aims to: (1) assess the variation of OSL sensitivity in quartz crystals from a granodiorite cobble through spatially resolved luminescence measurements using an electron-multiplying charge-coupled device (EMCCD); (2) evaluate the OSL sensitization of quartz crystals at the granodiorite cobble surface; and (3) determine trajectories of OSL sensitization of quartz rock crystals and single grains due to illumination–irradiation cycles. These aims are addressed to improve the understanding of how the OSL of quartz is sensitized in nature. This is needed to improve applications of quartz OSL in sediment provenance and tracing (Gray et al., Reference Gray, Jain, Sawakuchi, Mahan and Tucker2019).
Quartz sediment grains are generated through weathering of silicate crustal rocks and dispersed across the surface of the Earth through erosion and transport by water, wind, ice, and gravity flows. Quartz grains are major components of modern and ancient sands, occurring in sedimentary rocks formed billions of years ago and representing the oldest records of the Earth crust (e.g., Compston and Pidgeon, Reference Compston and Pidgeon1986). Thus, quartz sediment grains are testimonies of changes in the surface of the Earth over deep geological time. The common occurrence of quartz as sand grains has motivated its use to discover the origin of sediments and sedimentary rocks since the pioneer studies by Henry Clifton Sorby (Reference Sorby1880, p. 49) in the nineteenth century using features of quartz single grains observed under the optical microscope: “Though we may thus expect to meet with many grains of quartz-sand presenting no distinctive peculiarities, yet some grains may still teach us their whole history, and throw much light on the true nature of the associated material”.
During the twentieth century, studies dealing with the effect of ionizing radiation on rocks revealed varied patterns of light emission by minerals exposed to natural or laboratory ionizing radiation and later exposed to visible light or heat (Daniels et al., Reference Daniels, Boyd and Saunders1953; McKeever, Reference McKeever2011). This includes the OSL of quartz sand grains, whose sensitivity (light emitted per unit mass and unit radiation dose) can vary over four to five orders of magnitude depending on their geological history (e.g., Mineli et al., Reference Mineli, Sawakuchi, Guralnik, Lambert, Jain, Pupim, del Río, Guedes and Nogueira2021). This has motivated the use of quartz OSL properties, such as the sensitivity of the fast OSL component (e.g., Chen et al., Reference Chen, Li and Murray2000; Jain et al., Reference Jain, Murray and Bøtter-Jensen2003) in sediment provenance analysis (Tsukamoto et al., Reference Tsukamoto, Nagashima, Murray and Tada2011). The sensitivity of the fast OSL component of quartz is enhanced by surface processes acting on sediment sources, allowing its use for sediment provenance analysis (Sawakuchi et al., Reference Sawakuchi, Jain, Mineli, Nogueira, Bertassoli, Häggi and Sawakuchi2018).
Tracing sources of quartz sediment grains using OSL sensitivity has allowed applications in paleoclimate reconstructions (Mendes et al., Reference Mendes, Sawakuchi, Chiessi, Giannini, Rehfeld and Mulitza2019; Campos et al., Reference Campos, Chiessi, Novello, Crivellari, Campos, Albuquerque and Venancio2022, Reference Campos, Chiessi, Nascimento, Kraft, Radionovskaya, Skinner and Dias2025) and sedimentary basin evolution (del Río et al., Reference del Río, Sawakuchi, Góes, Hollanda, Furukawa, Porat, Jain, Mineli and Negri2021; Ortiz et al., Reference Ortiz, Parra, Rodrigues, Mineli and Sawakuchi2024) in South American settings. Previous studies observed that quartz crystals from igneous and metamorphic rocks have low OSL sensitivity compared to quartz grains from modern sediments transported by fluvial, coastal, or eolian systems in tectonically stable settings (Sawakuchi et al., Reference Sawakuchi, Blair, DeWitt, Faleiros, Hyppolito and Guedes2011; Guralnik et al., Reference Guralnik, Ankjærgaard, Jain, Murray, Müller, Wälle and Lowick2015; Mineli et al., Reference Mineli, Sawakuchi, Guralnik, Lambert, Jain, Pupim, del Río, Guedes and Nogueira2021). The OSL sensitization of quartz crystals from igneous and metamorphic rocks converted into sediment grains can occur due to heating (Bøtter-Jensen et al., Reference Bøtter-Jensen, Larsen, Mejdahl, Poolton, Morris and McKeever1995) and to illumination–irradiation cycles, as demonstrated by laboratory experiments (e.g., Moska and Murray, Reference Moska and Murray2006; Pietsch et al., Reference Pietsch, Olley and Nanson2008; Moayed et al., Reference Moayed, Fattahi, Autzen, Haghshenas, Tajik, Shoaie, Bailey, Sohbati and Murray2024). Thus, quartz OSL sensitization in nature could occur when quartz grains from soils are heated by wildfires and/or when they are buried and sequentially exposed to sunlight during deposition and erosion in sedimentary systems (Pietsch et al., Reference Pietsch, Olley and Nanson2008) or as a result of upward and downward movement in soils by the activity of bioturbators (Sawakuchi et al., Reference Sawakuchi, Jain, Mineli, Nogueira, Bertassoli, Häggi and Sawakuchi2018; Zhang et al., Reference Zhang, Sheng-Hua, Sun, Lu, Zhou and Hao2022; Tanski et al., Reference Tanski, Rittenour, Pavano, Pazzaglia, Mills, Corbett and Bierman2024).
However, recent studies observed absent or minor sensitization of quartz OSL due to sediment transport and deposition (Sawakuchi et al., Reference Sawakuchi, Jain, Mineli, Nogueira, Bertassoli, Häggi and Sawakuchi2018; Capaldi et al., Reference Capaldi, Rittenour and Nelson2022; Magyar et al., Reference Magyar, Bartyik, Marković, Filyó, Kiss, Marković and Homolya2024; Parida et al., Reference Parida, Kaushal, Chauhan and Singhvi2025), suggesting that sensitization occurs mostly when quartz sediment grains are stored in soils and sediments. Additionally, single quartz grains originating from the same parent rock or experiencing the same surface history exhibit high variation in OSL sensitivity (e.g., Sawakuchi et al., Reference Sawakuchi, Blair, DeWitt, Faleiros, Hyppolito and Guedes2011). This suggests that quartz OSL sensitization is also influenced by intrinsic (compositional/structural) properties of quartz inherited from parent rocks or acquired during rock exhumation before surface weathering. This study was designed to assess the variability of the initial OSL sensitivity of quartz crystals as well as the response of quartz single grains to illumination–irradiation cycles emulating solar exposure and burial irradiation during sediment transport and deposition.
Material and methods
Sample characteristics and preparation
The studied samples include a well-rounded granodiorite cobble (RSA01, 4°24’53.59”N, 73°18’7.87”W) collected in the Humea River draining the eastern margin of the Eastern Cordillera in the Colombian northern Andes, and a sediment sample (L0017) from a fluvial terrace bounding the lower Negro River close to the confluence with the Solimões River in central Amazonia. The cobble sample RSA01 is derived from the Ordovician La Mina granodiorite, with a zircon U–Pb age of 483 ± 10 Ma (Horton et al., Reference Horton, Saylor, Nie, Mora, Parra, Reyes-Harker and Stockli2010) and an apatite fission-track age of 0.9 ± 0.2 Ma (Mora et al., Reference Mora, Parra, Strecker, Sobel, Hooghiemstra, Torres and Jaramillo2008), documenting very rapid recent exhumation. The sediment sample L0017 was previously studied by Mineli et al. (Reference Mineli, Sawakuchi, Guralnik, Lambert, Jain, Pupim, del Río, Guedes and Nogueira2021), showing quartz sand grains with natural OSL signal in saturation and moderate sensitivities of the 110°C thermoluminescence (TL) peak and fast OSL component. It is interpreted as a mixture of quartz grains sourced from diverse geological terrains from the Brazilian and Guiana shields, as well as from the Andes (Sawakuchi et al., Reference Sawakuchi, Jain, Mineli, Nogueira, Bertassoli, Häggi and Sawakuchi2018). The studied granodiorite (sample RSA01) is considered a crustal rock representing a primary source of quartz to continental depositional systems while the fluvial terrace in central lowland Amazonia (sample L0017) is formed by sediments derived from Andean and cratonic tributaries of the Amazon River. Thus, sample L0017 encompasses quartz grains derived from diverse source lithologies.
The granodiorite cobble sample was drilled for retrieval of an ∼4-cm long and 9.7-mm diameter core that was used to cut five sequential slices with thicknesses of 1.77, 1.58, 1.08, 1.32, and 1.11 mm, distributed from top to bottom of the core. The five rock slices retrieved from sample RSA01 allowed investigating the OSL sensitivity of quartz crystals from the cobble surface to approximately 9 mm depth.
The sediment sample L0017 was treated to isolate quartz grains in the 180–250 µm grain-size interval. This included treatment with hydrogen peroxide (H2O2) and hydrochloric acid (HCl) 10% to eliminate organic matter and carbonates, respectively, separation in lithium metatungstate solution with densities of 2.75 g/cm3 and 2.62 g/cm3 to separate light (< 2.75 g/cm3) from heavy minerals and quartz (< 2.62 g/cm3) from feldspar. Quartz concentrates were treated with 38% hydrofluoric acid (HF) for 40 minutes to eliminate remaining feldspar grains and sieved again to obtain grains in the 180–250 µm fraction.
Luminescence measurements and sensitization experiments
Measurements were performed at the DTU Technical University of Denmark (Department of Physics). OSL measurements were made on a Risø TL/OSL DA-20 system equipped with a Hoya U-340 filter for light detection in the ultraviolet band (peak transmission at 340 nm), blue (470 nm) and infrared (870 nm) LEDs for light stimulation, an ultraviolet LED bleaching unit (365 nm, 11 W), a built-in beta radiation source (86Sr/86Y) with a dose rate of 0.06 Gy/s, and an EMCCD attachment for light detection (Kook et al., Reference Kook, Lapp, Murray, Thomsen and Jain2015). The rock slices of sample RSA01 were loaded directly on the reader carousel while sediment grains were mounted on single-grain discs. The chemical composition of slices of the granodiorite cobble (sample RSA01) was mapped using a micro X-ray fluorescence (μXRF) system (Brüker M4 Tornado), with spot size of 13.7 μm at Mo (Kα) and 33.1 μm at Mo (L). Elemental concentrations were qualitatively mapped, allowing identification of quartz crystals in the rock slices used for OSL measurements.
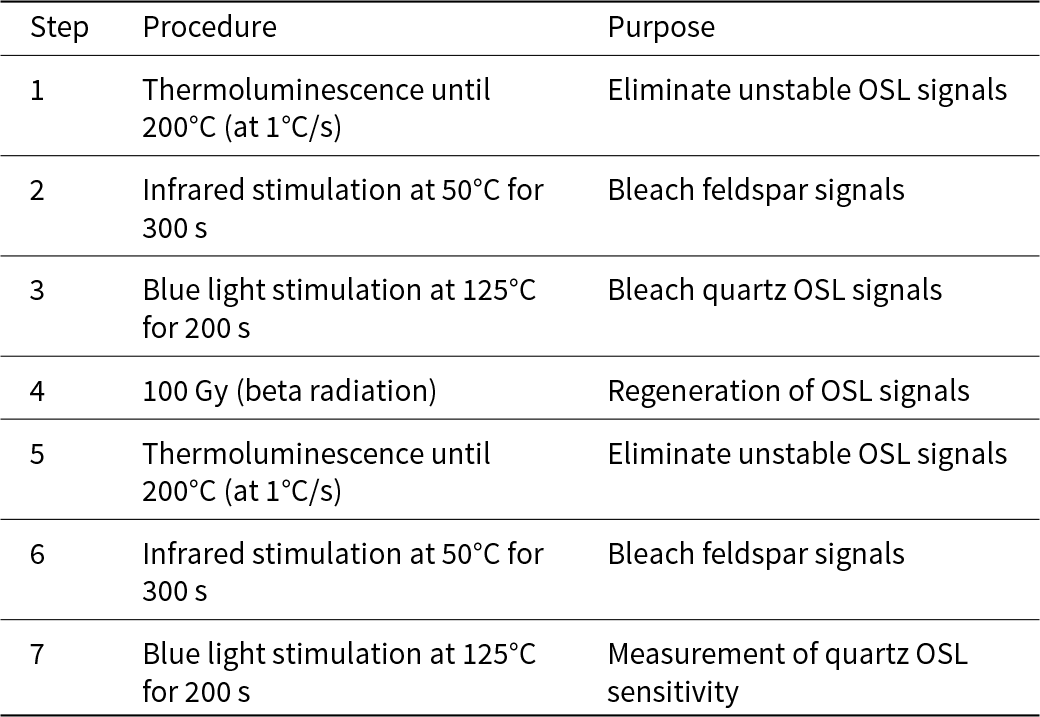
The first study purpose was to characterize the primary OSL sensitivity of quartz crystals from the granodiorite cobble surface to ∼9 mm depth. Thus, the five slices retrieved from the granodiorite cobble were measured using the protocol described in Table 1, aiming to determine the sensitivity of the fast OSL component of quartz, as applied in previous sediment provenance studies (e.g., Sawakuchi et al., Reference Sawakuchi, Jain, Mineli, Nogueira, Bertassoli, Häggi and Sawakuchi2018), but using an EMCCD attachment to obtain spatially resolved quartz OSL sensitivity. The protocol in Table 1 includes bleaching of natural signals of feldspar and quartz (steps 1 to 3), beta irradiation for signal regeneration, and measurement of quartz OSL (step 7) after preheating and infrared stimulation steps.
Sequence of procedures used to measure quartz OSL sensitivity (step 7) in rock slices representing the profile from the granodiorite cobble surface to ∼9 mm depth (sample RSA01).

Table 1 Long description
Steps are listed with columns for Step, Procedure, and Purpose, describing a sequence used to measure quartz OSL sensitivity. Step 1 is thermoluminescence until 200 degrees Celsius at 1 degree Celsius per second, with the purpose, Eliminate unstable OSL signals. Step 2 is infrared stimulation at 50 degrees Celsius for 300 seconds, purpose, Bleach feldspar signals. Step 3 is blue light stimulation at 125 degrees Celsius for 200 seconds, purpose, Bleach quartz OSL signals. Step 4 applies 100 Gy beta radiation, purpose, Regeneration of OSL signals. Steps 5 through 7 repeat the same procedures as steps 1 through 3, with step 7 listing the purpose, Measurement of quartz OSL sensitivity.
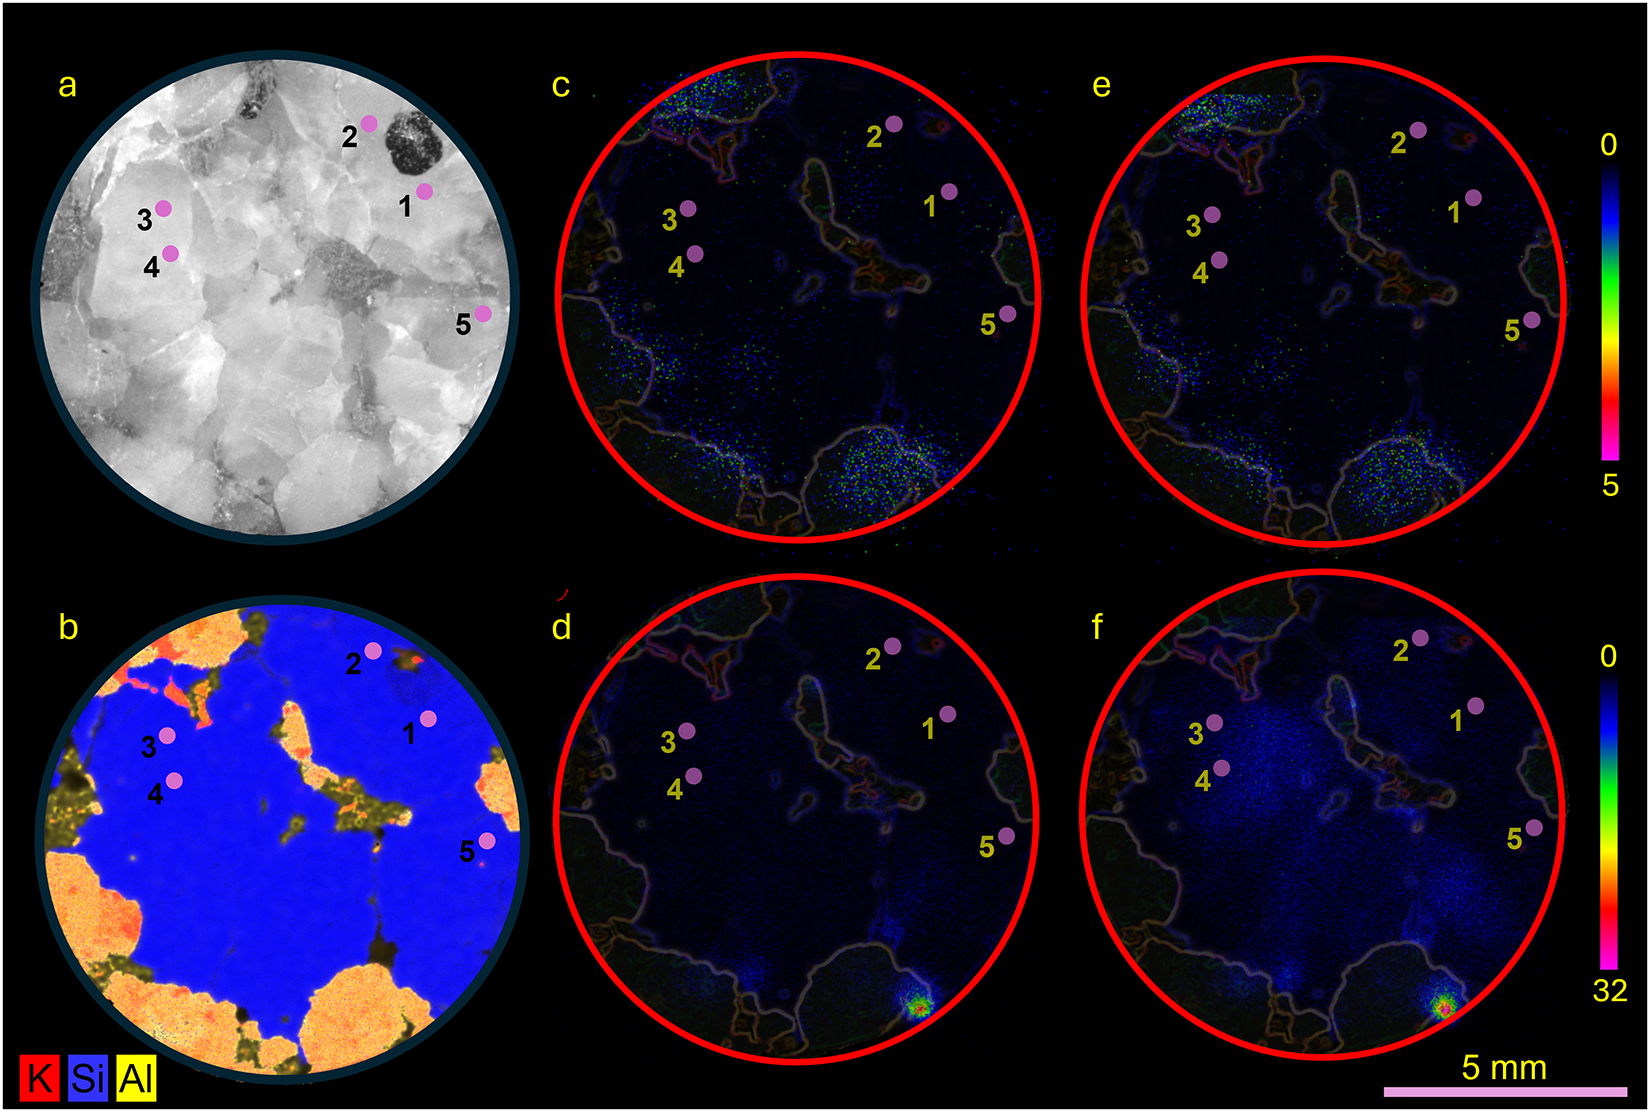
The TL was recorded during heating to 200°C (steps 1 and 5), assisting the identification of quartz crystals through the presence of the 110°C TL peak. The relatively long infrared stimulation (300 s) and blue light stimulation (200 s), respectively, aimed to improve bleaching of feldspar signals and completely record signals from slower OSL components of quartz. The infrared stimulated luminescence (IRSL) also supported the identification of quartz and feldspar crystals in the rock slices, assuming that feldspar has strong IRSL, while it is absent in quartz. The quartz OSL sensitivity was calculated through integration of the first two seconds of light emission using the last 10 seconds as background. The OSL sensitivity was calculated for specific regions of interest (ROI) with a diameter of 250 µm within quartz crystals identified based on the optical image and elemental map (Fig. 1).
Images of the slice retrieved from the granodiorite cobble surface (0–2 mm depth), which was subjected to illumination–irradiation cycles for quartz OSL sensitization. The ROIs used to track quartz OSL sensitization are identified by the pink circles numbered from 1 to 5. (a) Optical image of the granodiorite cobble slice. (b) Element compositional image obtained through μXRF. Quartz crystals are represented by blue color indicating the high relative concentration of silicon (Si). Reddish-yellow colors represent high relative concentrations of potassium (K) and aluminum (Al), indicating crystals of feldspar and other unidentified minerals. The boundaries between quartz crystals and other minerals are shown in the IRSL and OSL images (c–f). (c) Initial IRSL at 50°C (step 6 in Table 2) before the first illumination–irradiation cycle. (d) Initial OSL at 125°C (step 7 in Table 2) before the first illumination–irradiation cycle. (e) IRSL at 50°C (step 6 in Table 2) after 630 illumination–irradiation (2 Gy) cycles. (f) OSL at 125°C (step 7 in Table 2) after 630 illumination–irradiation (2 Gy) cycles. The bright spot in the OSL images (d, f) corresponds to an unknown mineral phase. Color bars at the right side show relative light intensity in arbitrary units for IRSL (c, e) and OSL (d, f) images.

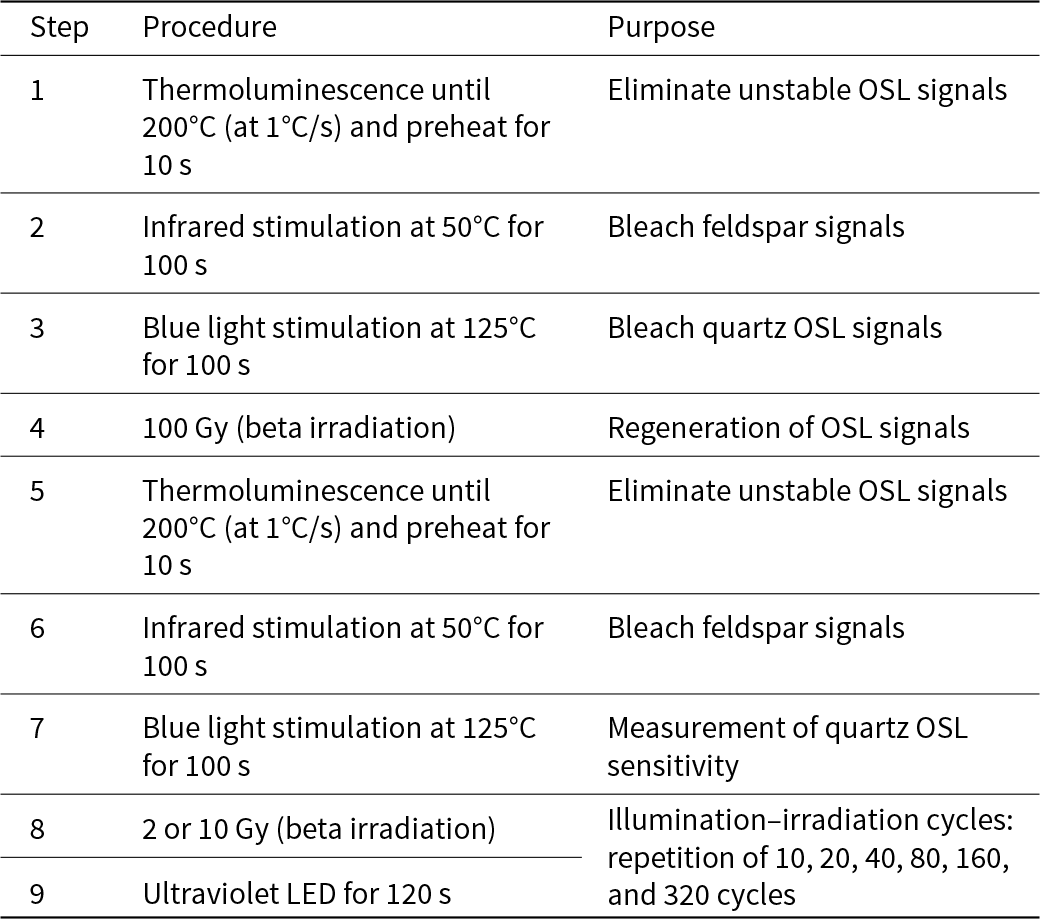
The second study purpose was to evaluate how the OSL sensitivity of quartz rock crystals and quartz sand grains respond to illumination–irradiation cycles. Hence, sensitization experiments using the protocol described in Table 2 were performed with a slice from the granodiorite cobble surface (sample RSA01, 1–2 mm depth) and with 100 quartz sand grains from the fluvial sediment sample L0017. Cycles of irradiation with 2 or 10 Gy beta dose and illumination using a UV LED were applied to induce OSL sensitization of quartz rock crystals and sand grains. The quartz OSL sensitivity (step 7 in Table 2) was measured using a beta dose of 100 Gy and calculated using the first two seconds of light emission and the last 10 seconds as background. Quartz OSL sensitivity was measured after repetition of 10, 20, 40, 80, 160, and 320 illumination–irradiation cycles using a dose of 2 Gy, totaling 630 illumination–irradiation cycles. Additional 10, 20, 40, 80, 160, and 320 illumination–irradiation cycles using a dose of 10 Gy were applied to quartz single grains, thus totaling 1260 illumination–irradiation cycles.
Sequence of procedures used to sensitize OSL of quartz crystals from a rock slice of the granodiorite cobble (sample RSA01) and quartz sand grains of the fluvial sediment (sample L0017). Steps 1 to 7 were designed to bleach remnant luminescence signals and measure quartz OSL sensitivity after applying illumination–irradiation cycles represented by repetition of steps 8 and 9. For the rock slice (sample RSA01A), quartz OSL sensitivity (step 7) was measured after 10, 20, 40, 80, 160, and 320 cycles using 2 Gy, summing a total of 630 illumination–irradiation cycles. For quartz sediment grains (sample L0017), additional 10, 20, 40, 80, 160, and 320 cycles using 10 Gy were applied, following the 630 cycles using 2-Gy doses, totaling 1260 illumination–irradiation cycles.

Table 2 Long description
Columns are Step, Procedure, and Purpose, listing a nine-step sequence for luminescence preparation, bleaching, regeneration, sensitivity measurement, and repeated cycling. Step 1 applies thermoluminescence until 200 degrees Celsius at 1 degree Celsius per second, plus a 10 second preheat, to eliminate unstable OSL signals. Step 2 uses infrared stimulation at 50 degrees Celsius for 100 seconds to bleach feldspar signals, and step 3 uses blue light stimulation at 125 degrees Celsius for 100 seconds to bleach quartz OSL signals. Step 4 applies 100 Gy beta irradiation for regeneration of OSL signals. Steps 5 and 6 repeat the step 1 and step 2 procedures and purposes. Step 7 uses blue light stimulation at 125 degrees Celsius for 100 seconds for measurement of quartz OSL sensitivity. Step 8 applies 2 or 10 Gy beta irradiation for illumination irradiation cycles, described as repetition of 10, 20, 40, 80, 160, and 320 cycles. Step 9 lists ultraviolet LED for 120 seconds, with no purpose stated in the Purpose column.
The OSL sensitivity is reported just as photon counts (first two seconds of light emission), considering that quartz crystal ROIs or quartz single grains have the same size, and the purpose of the study was to define sensitization trajectories for the same ROI or single grain. Thus, the OSL sensitivities calculated for ROIs in quartz rock crystals and for quartz single grains are not comparable in an absolute sense due to mass and shape variation between crystals and sand grains. The TL was recorded during preheat (steps 1 and 5) to check the presence of the 110°C peak, assisting the identification of quartz crystals in the rock slices in combination with the absence of IRSL and Si composition in the μXRF images.
Results
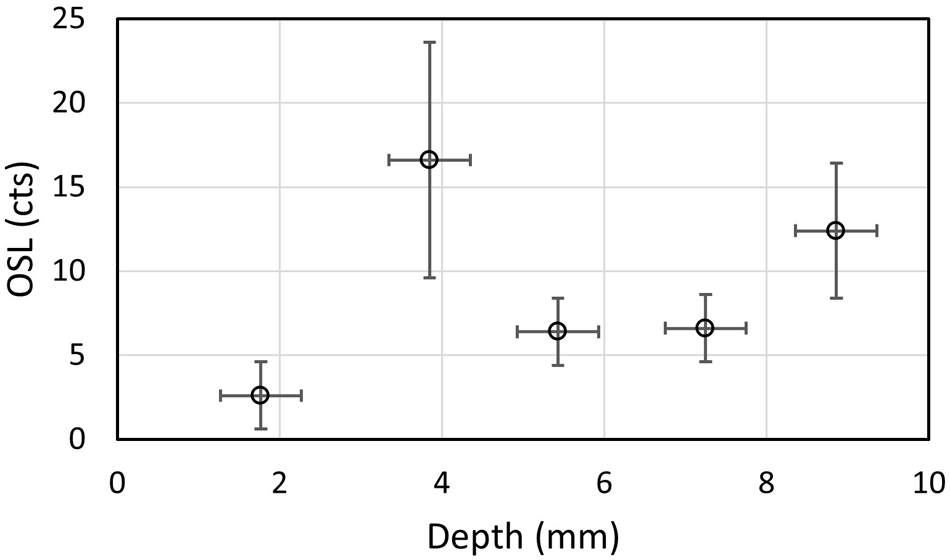
Quartz crystals of the granodiorite cobble have irregular boundaries (Fig. 1a) and can be identified by high Si concentration and absence of Al (Fig. 1b). Quartz crystals are bounded by feldspar crystals characterized by significant IRSL (Fig. 1c and d), as well as by the high relative concentrations of silicon (Si), aluminum (Al), and potassium (K) in the μXRF map (Fig. 1b). Quartz crystals have relatively low and heterogeneous OSL sensitivity, with marked variation within single crystals (Fig. 1d and f). The OSL sensitivity of quartz crystals from the surface to the inner portion of the cobble is similar, without a sensitization trend toward the cobble surface (Fig. 2). Feldspar IRSL sensitivity shows minor change after illumination–irradiation cycles (Fig. 1c and e) while quartz OSL sensitivity demonstrates a significant increase after 630 illumination–irradiation cycles (Fig. 1d and f).
Quartz OSL sensitivity (step 7 in Table 1) of specific ROIs of slices from the surface (0–2 mm depth) to the inner portion (9 mm depth) of the studied granodiorite cobble (sample RSA01). Each datapoint corresponds to the average OSL sensitivity (photon counts recorded during the two first seconds of light emission) of five regions of interest (ROI 1–5) with diameter of 250 μm within quartz crystals of a specific rock slice. The vertical error bars represent the standard deviation. The selected ROIs represent initially brighter portions of quartz crystals. A standard uncertainty of 1 mm (horizontal error bar) was considered for the slice depth.

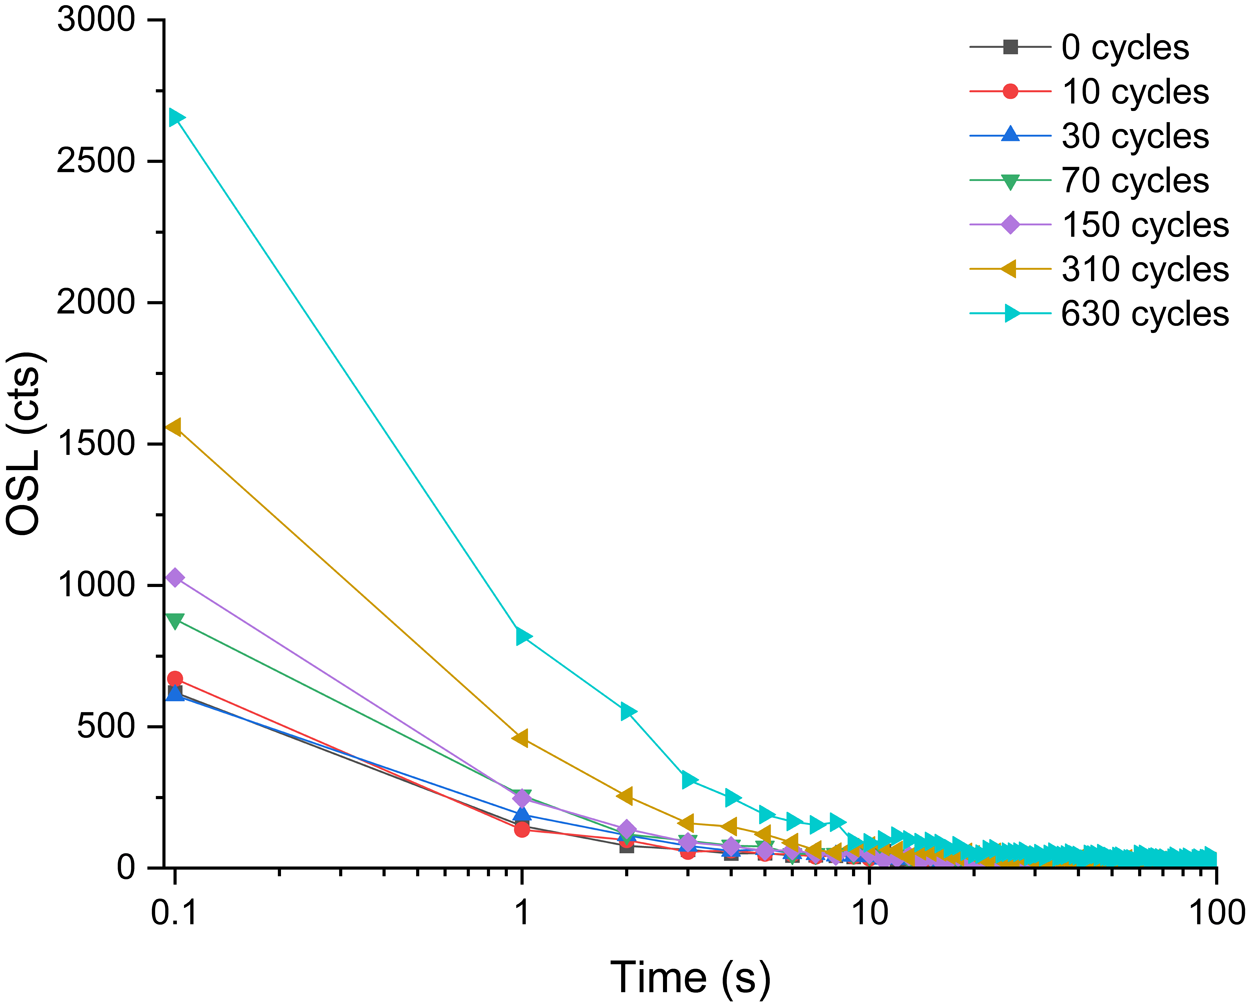
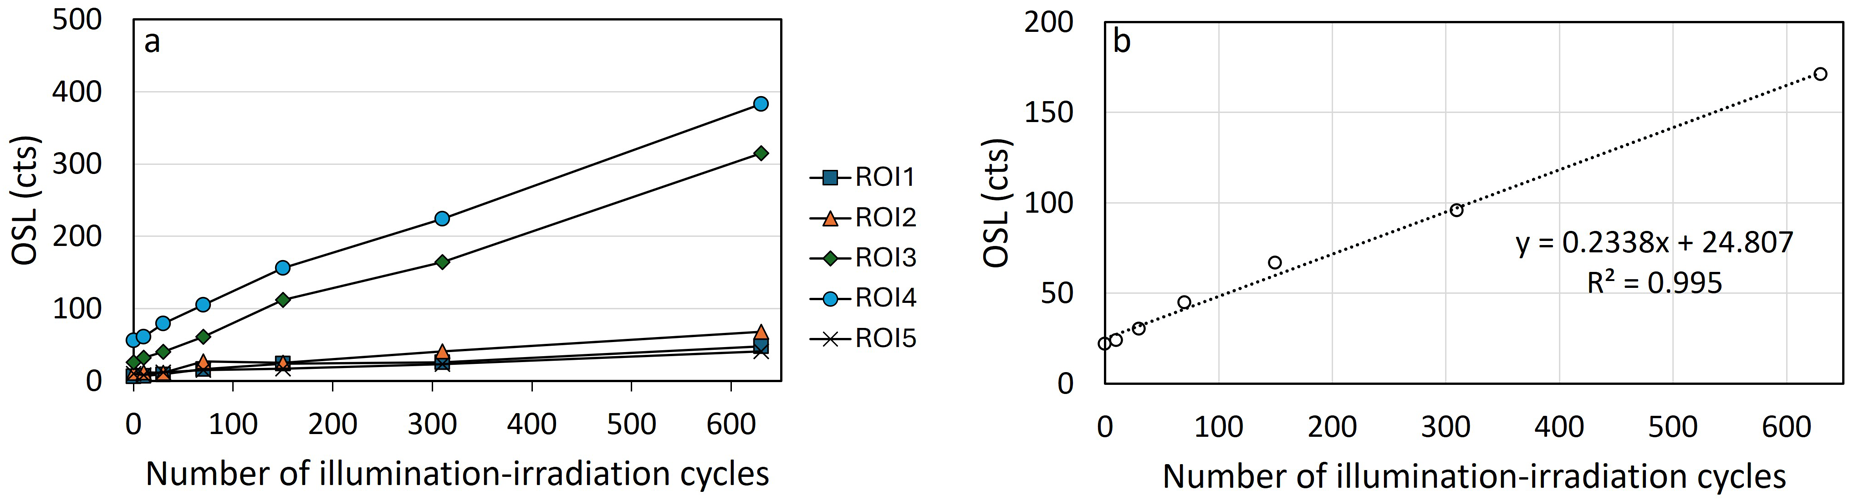
OSL sensitivity of quartz crystals from the granodiorite slice increased with the application of 630 illumination–irradiation cycles (2 Gy). This increase is observed for the first 10 seconds of light emission, as exemplified by OSL decay curves shown in Figure 3. Different portions of the quartz crystals showed varied sensitization range and initially brighter regions exhibited higher OSL sensitization (Fig. 4a). This suggests that the initial sensitivity influences the sensitization potential due to illumination–irradiation cycles. Quartz OSL showed a maximum sensitization of one order of magnitude from 10 to 100 counts after 630 illumination–irradiation cycles. The OSL sensitization follows a quasi-linear trend.
Examples of OSL decay curves for a specific region of interest (ROI) with 1-mm diameter and within an initially brighter quartz crystal from the surface slice of the studied granodiorite (sample RSA01, 0–2 mm depth). The rock slice was subjected to 630 illumination–irradiation (2 Gy) cycles. The OSL decay curves correspond to step 7 of the protocol shown in Table 2.

(a) Trends in OSL sensitivity (step 7 in Table 2) of five regions of interest (ROI 1–5) within quartz crystals of the granodiorite cobble (sample RSA01) across 630 illumination–irradiation cycles. (b) Average OSL sensitivity of ROI 1–5 shown in (a). Datapoints correspond to measurements performed after 10, 20, 40, 80, 160, and 320 illumination–irradiation (2 Gy) cycles. OSL sensitivity is represented in terms of the sum of sequential illumination–irradiation cycles (10, 30, 70, 150, 310, and 630 cycles).

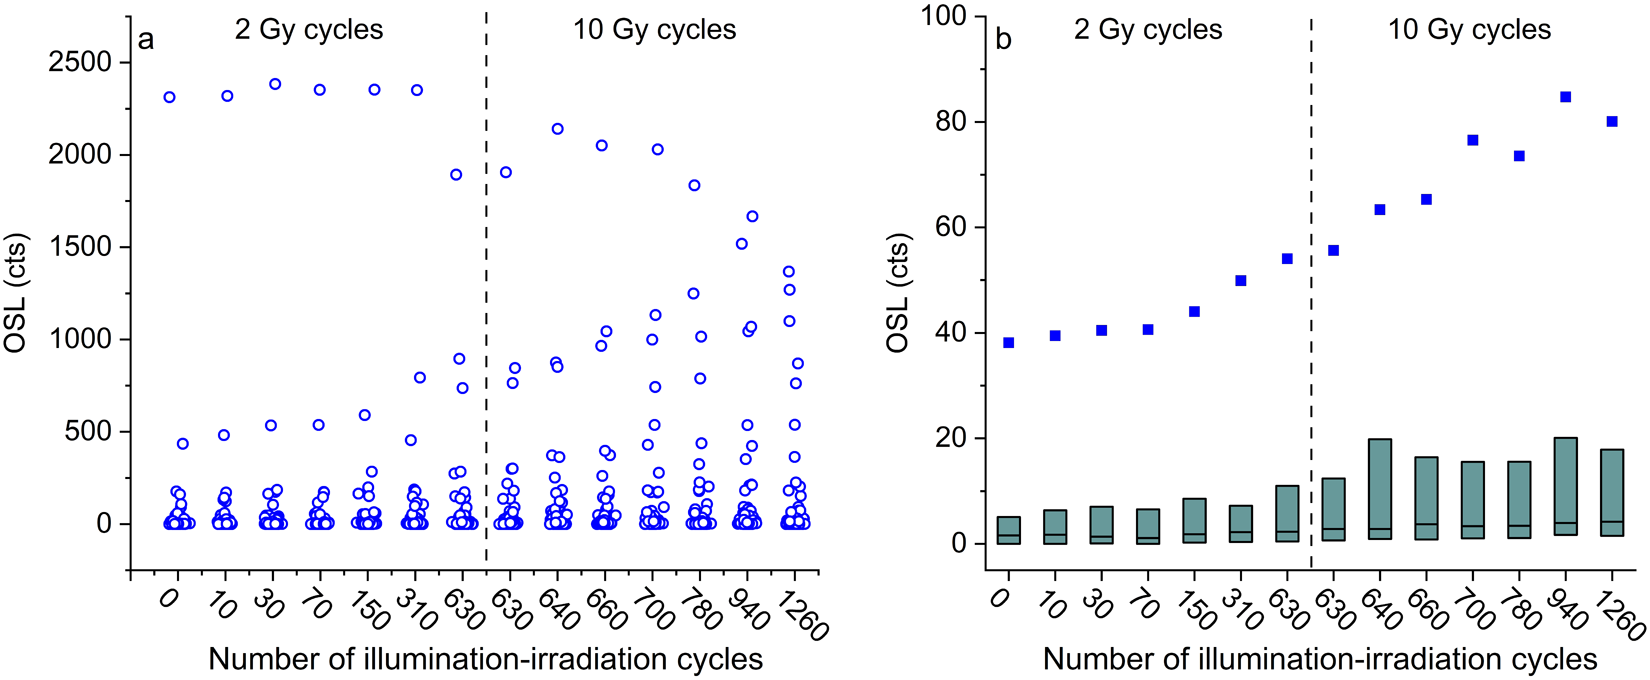
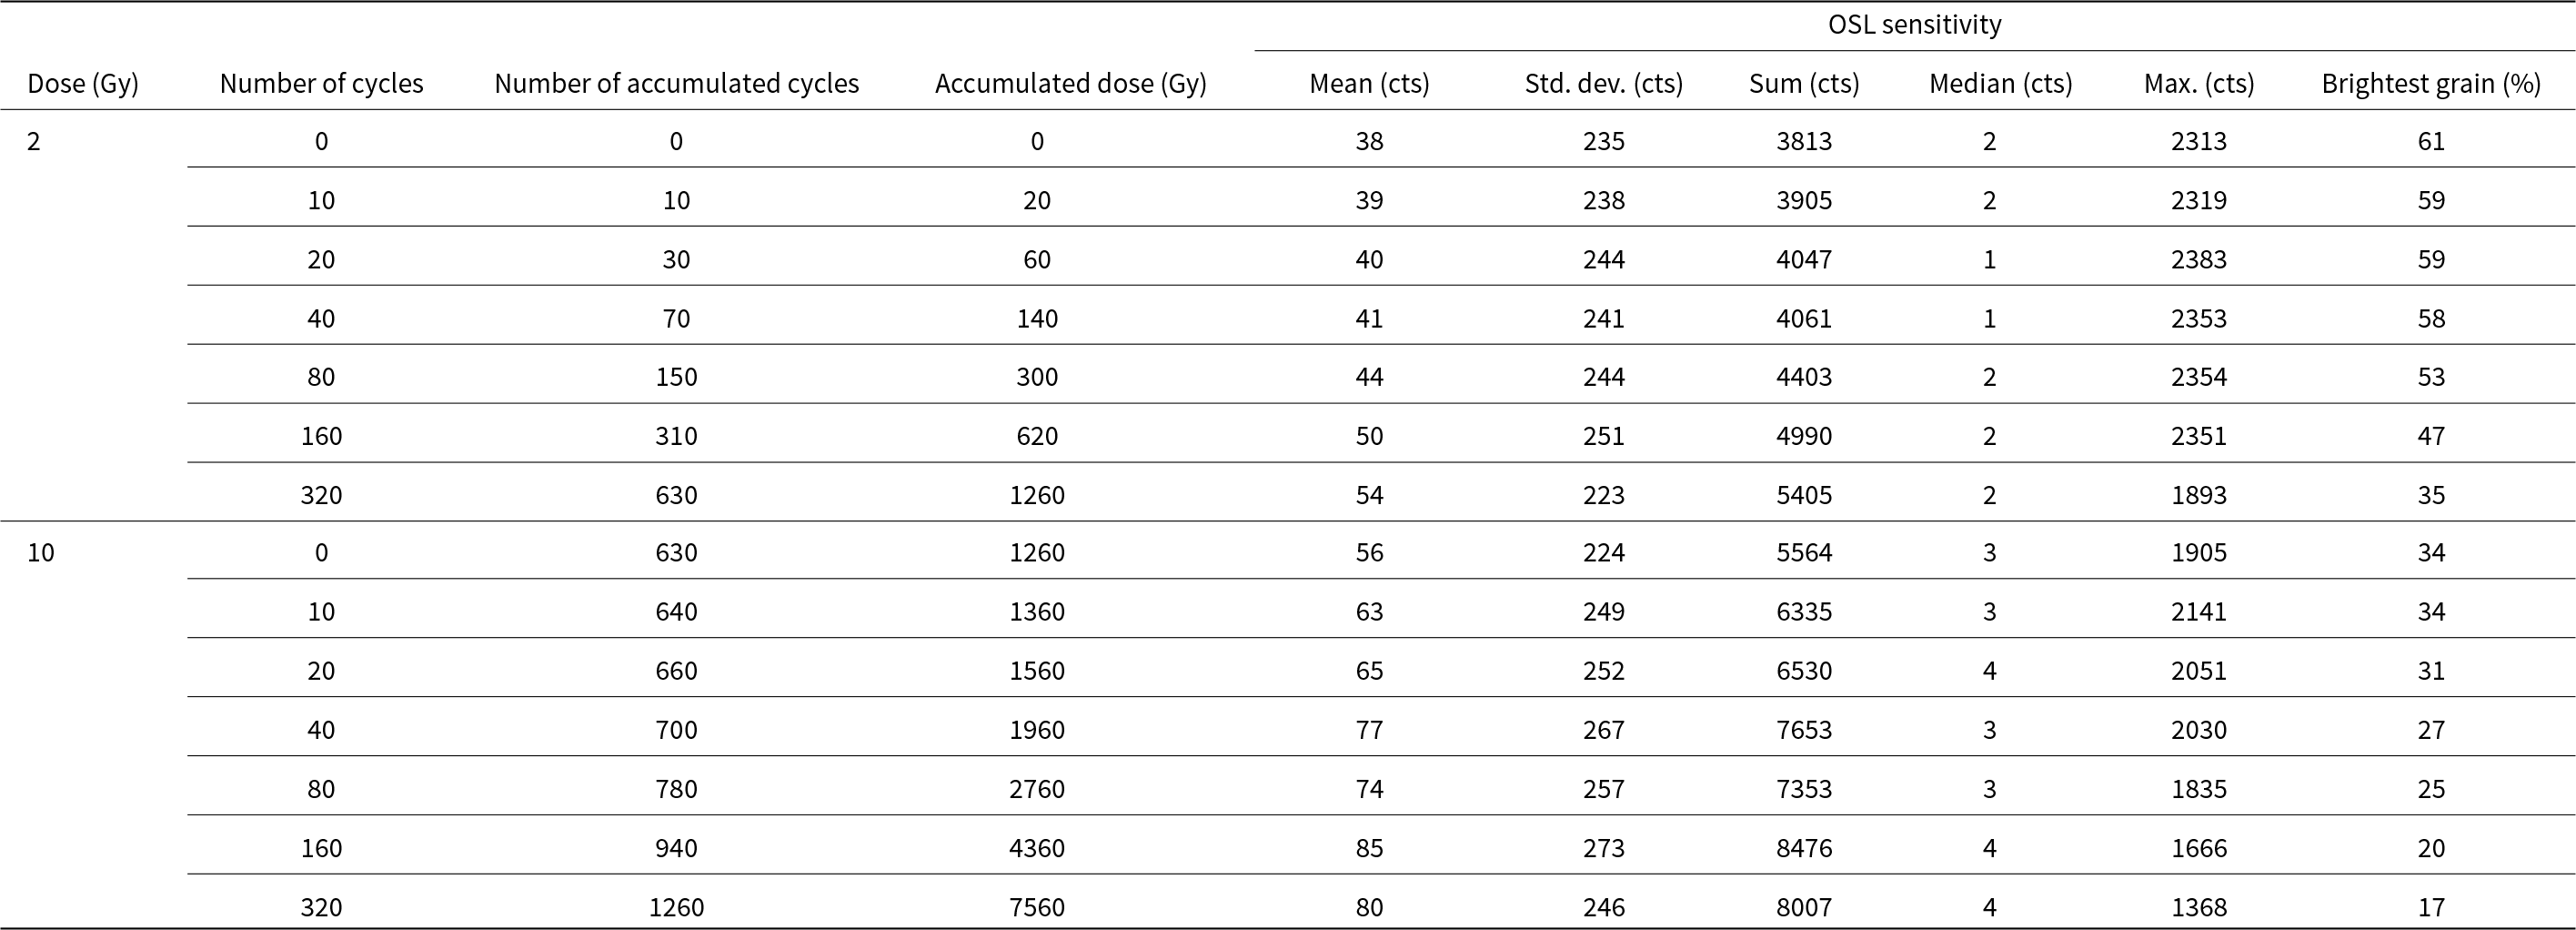
Quartz sediment grains from sample L0017 show initial OSL sensitivities ranging from 1 to 1000 counts (Fig. 5), but with a reduced number of higher sensitivity grains (100 to 1000 counts). The mean OSL sensitivity for 100 quartz grains increased from 38 to 80 counts, with a relatively stable standard deviation and low median (Table 3), after 1260 illumination–irradiation cycles. The sum OSL sensitivity increased from 3813 to 8007 counts while the sensitivity of the brightest grain decreased after 310 illumination–irradiation cycles (Fig. 5a, Table 3). Thus, the OSL sensitivity of the brightest grain decreased from 61% to 17% of the total OSL sensitivity (Table 3). The illumination–irradiation cycles increased the proportion of grains with OSL sensitivity in the 100-counts range and amplified the interquartile range (Fig. 5).
(a) OSL sensitivity (step 7 in Table 2) of 100 quartz single grains from sediment sample L0017 across 1260 illumination–irradiation cycles. The 630 cycles of illumination and 2 Gy dose were followed by 630 cycles of illumination and 10 Gy dose. A dose of 100 Gy was used to measure the OSL sensitivity after repeating 10, 20, 40, 80, 160, and 320 illumination–irradiation cycles, summing 630 cycles for each dose (2 and 10 Gy). The OSL sensitivity was measured after applying the 630 cycles of illumination and 2 Gy dose and before starting the cycles of illumination and 10 Gy dose. Thus, the sensitivity after 630 illumination–irradiation cycles was measured twice as shown in both graphs. (b) Boxplot (first quartile, median, and third quartile) and mean OSL sensitivity (blue squares) of quartz single grains from sample L0017, corresponding to statistics of data points shown in (a). The dashed lines mark the change from 2 Gy to 10 Gy cycles.

Figure 5 Long description
A scatter plot with the horizontal axis labeled, Number of illumination minus irradiation cycles, with tick labels 0, 10, 20, 30, 40, 50, 60, 70, 80, 90, 100, 110, 120, 130, 140, 150, 160, 170, 180, 190, 200, 210, 220, 230, 240, 250, 260, 270, 280, 290, 300, 310, 320, 330, 340, 350, 360, 370, 380, 390, 400, 410, 420, 430, 440, 450, 460, 470, 480, 490, 500, 510, 520, 530, 540, 550, 560, 570, 580, 590, 600, 610, 620, 630, 640, 650, 660, 670, 680, 690, 700, 710, 720, 730, 740, 750, 760, 770, 780, 790, 800, 810, 820, 830, 840, 850, 860, 870, 880, 890, 900, 910, 920, 930, 940, 950, 960, 970, 980, 990, 1000, 1010, 1020, 1030, 1040, 1050, 1060, 1070, 1080, 1090, 1100, 1110, 1120, 1130, 1140, 1150, 1160, 1170, 1180, 1190, 1200, 1210, 1220, 1230, 1240, 1250, 1260. The vertical axis is labeled, OSL, with a scale from 0 to 2500. A vertical dashed line is drawn at 630 on the horizontal axis. Text above the plot reads, 2 Gy cycles, on the left side of the dashed line and, 10 Gy cycles, on the right side. Many open circle markers are plotted at each cycle value, with most points between 0 and 500 on the vertical axis and some points extending above 500 up to around 2500. The image B showing a combined plot with a scatter series and bars. The horizontal axis is labeled, Number of illumination minus irradiation cycles, with tick labels from 0 to 1260. The vertical axis is labeled, OSL, with a scale from 0 to 100. A vertical dashed line is drawn at 630 on the horizontal axis. Text above the plot reads, 2 Gy cycles, on the left side of the dashed line and, 10 Gy cycles, on the right side. Square markers form an increasing sequence from about 40 at 0 cycles to about 60 at 630 cycles, then continue increasing to about 85 to 90 by 1260 cycles. Bars are shown at the same cycle positions, with bar heights mostly between about 5 and 20 on the vertical axis and taller bars around the mid to late cycle values reaching about 25 to 30.
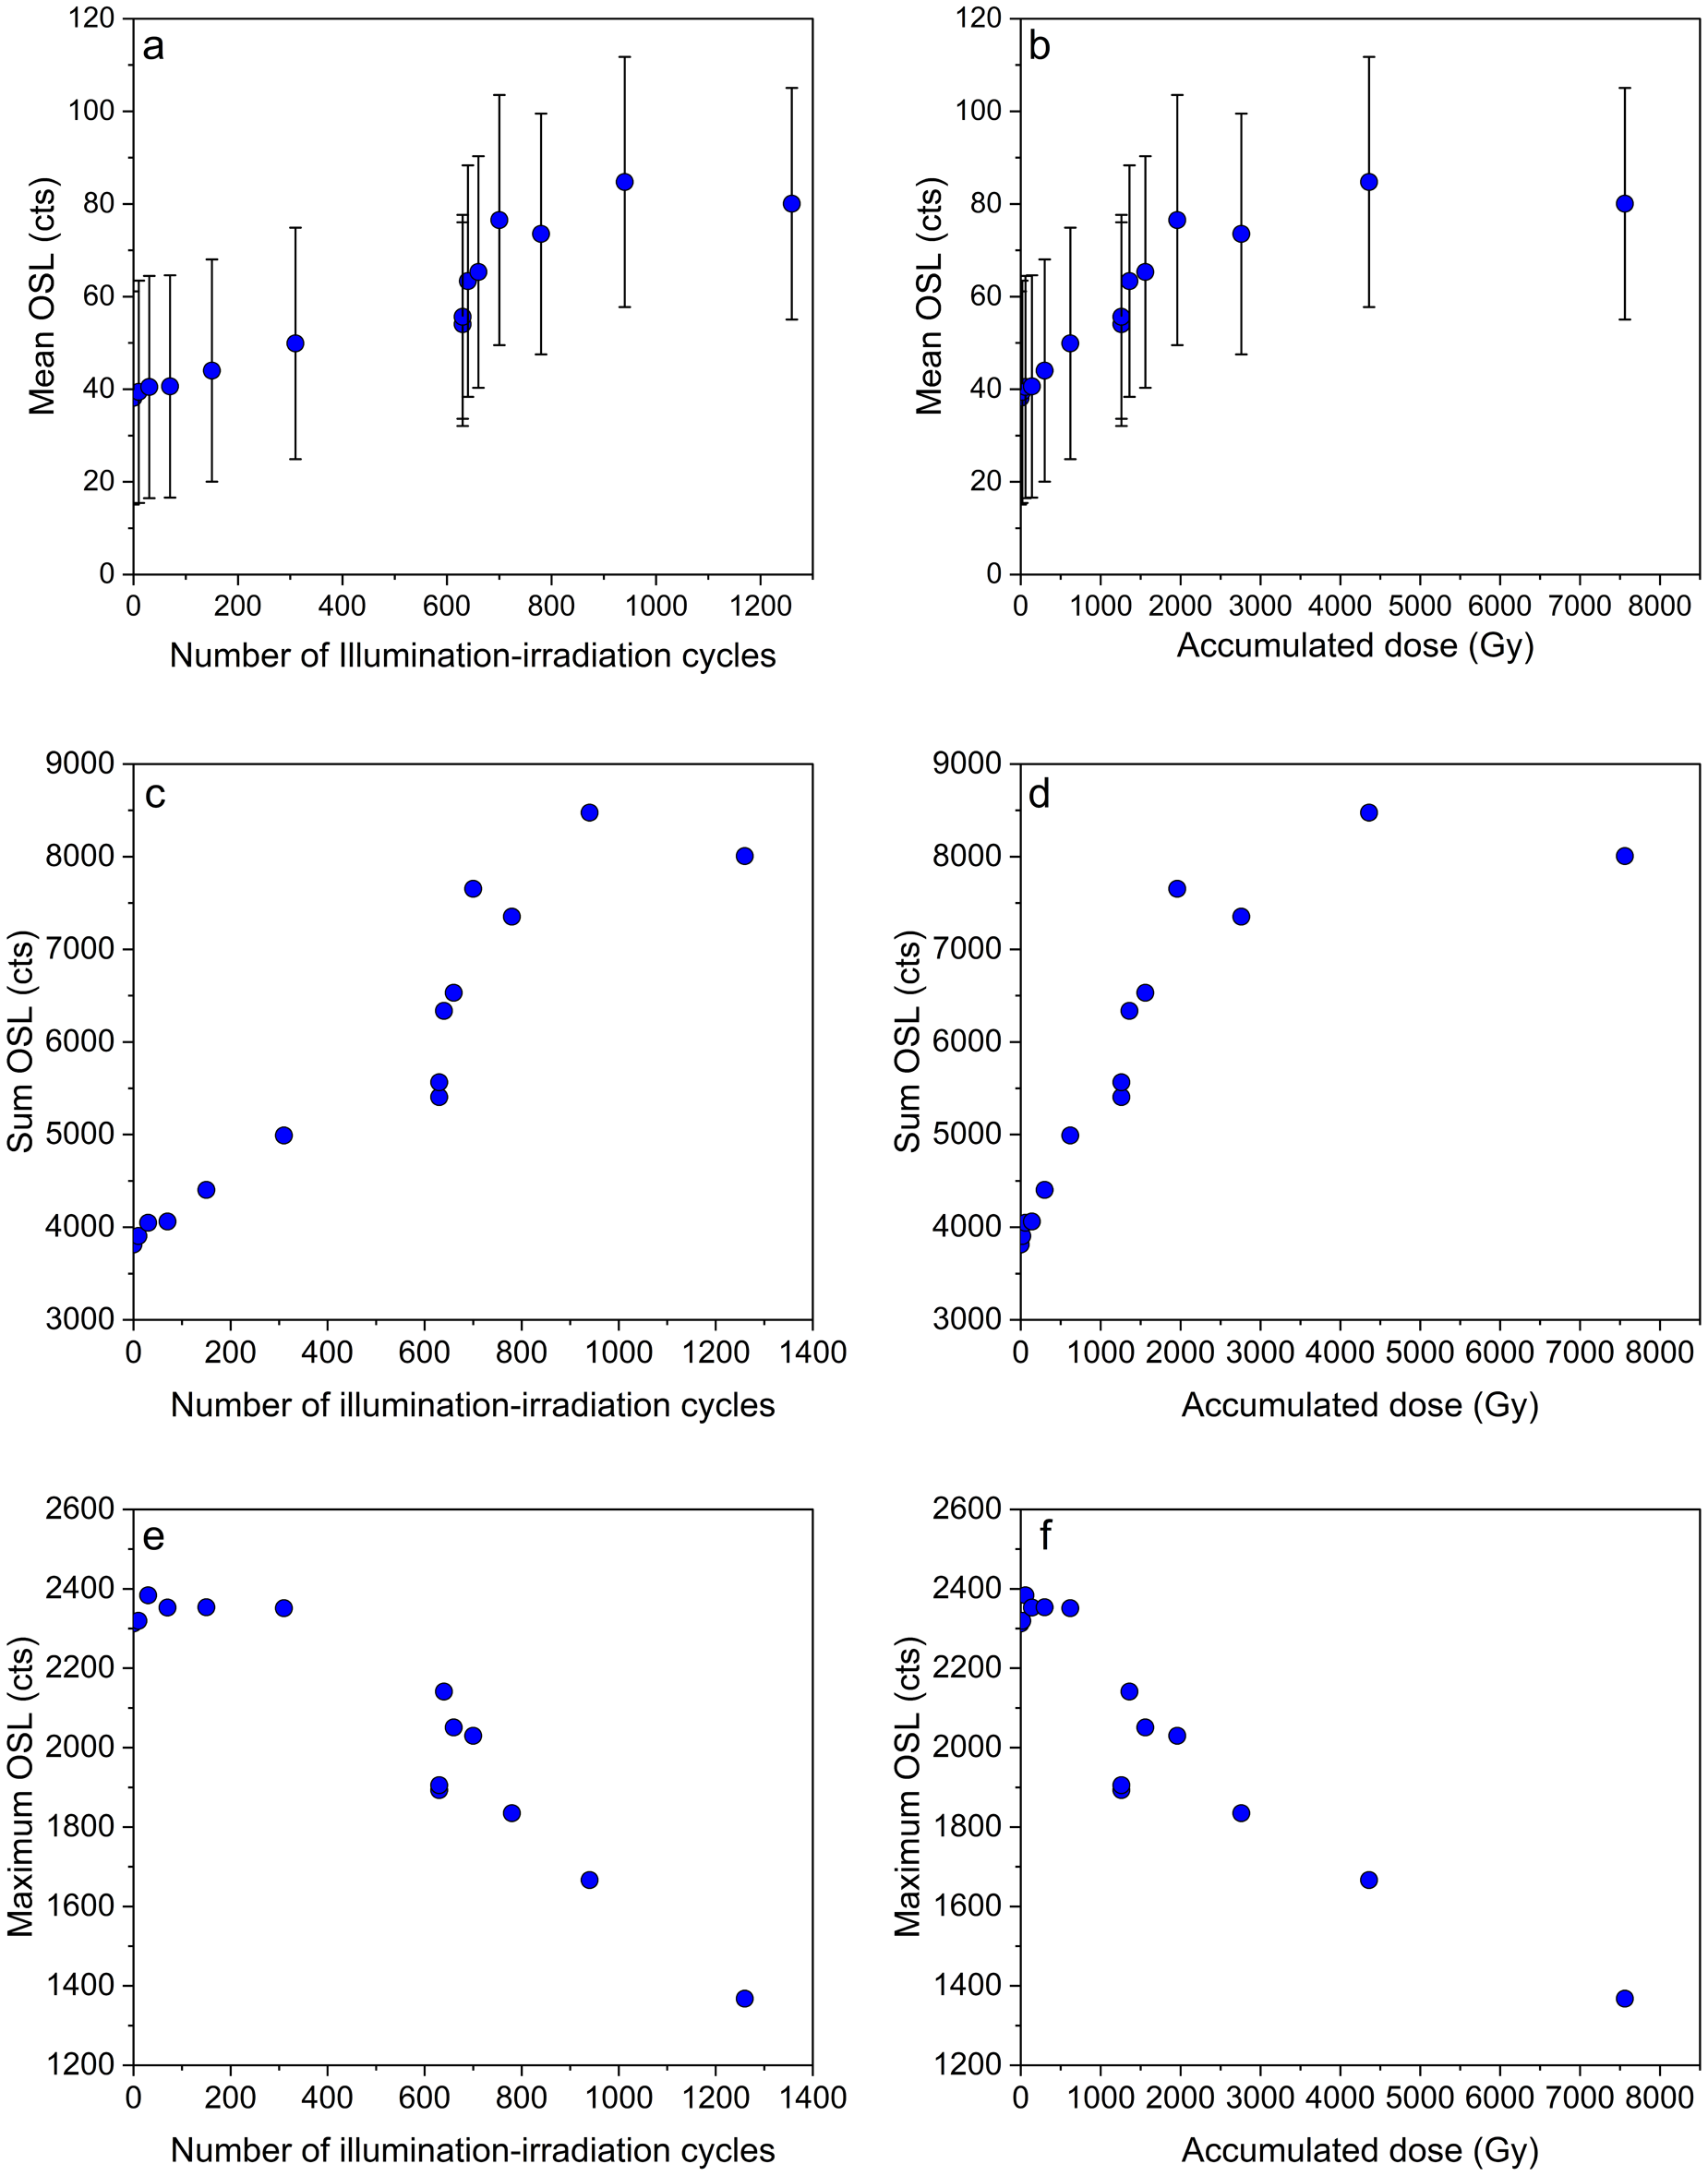
The sum OSL sensitivity of the 100 quartz single grains increased until 940 illumination–irradiation cycles (accumulated dose of 4360 Gy) and then showed a slight decrease until reaching 1260 illumination–irradiation cycles (accumulated dose of 7560 Gy). The OSL sensitivity of the brightest quartz grain decreased from approximately 2300 counts in the first 310 cycles to 1368 counts after 1260 illumination–irradiation cycles (Table 3, Figure 6e and f). This grain represented nearly 60% of the initial light emitted by all quartz grains and around 17% of the OSL sensitivity after 1260 illumination–irradiation cycles. Despite the desensitization of the brightest grain, the sensitivity of all grains combined increased (Fig. 6a–d).
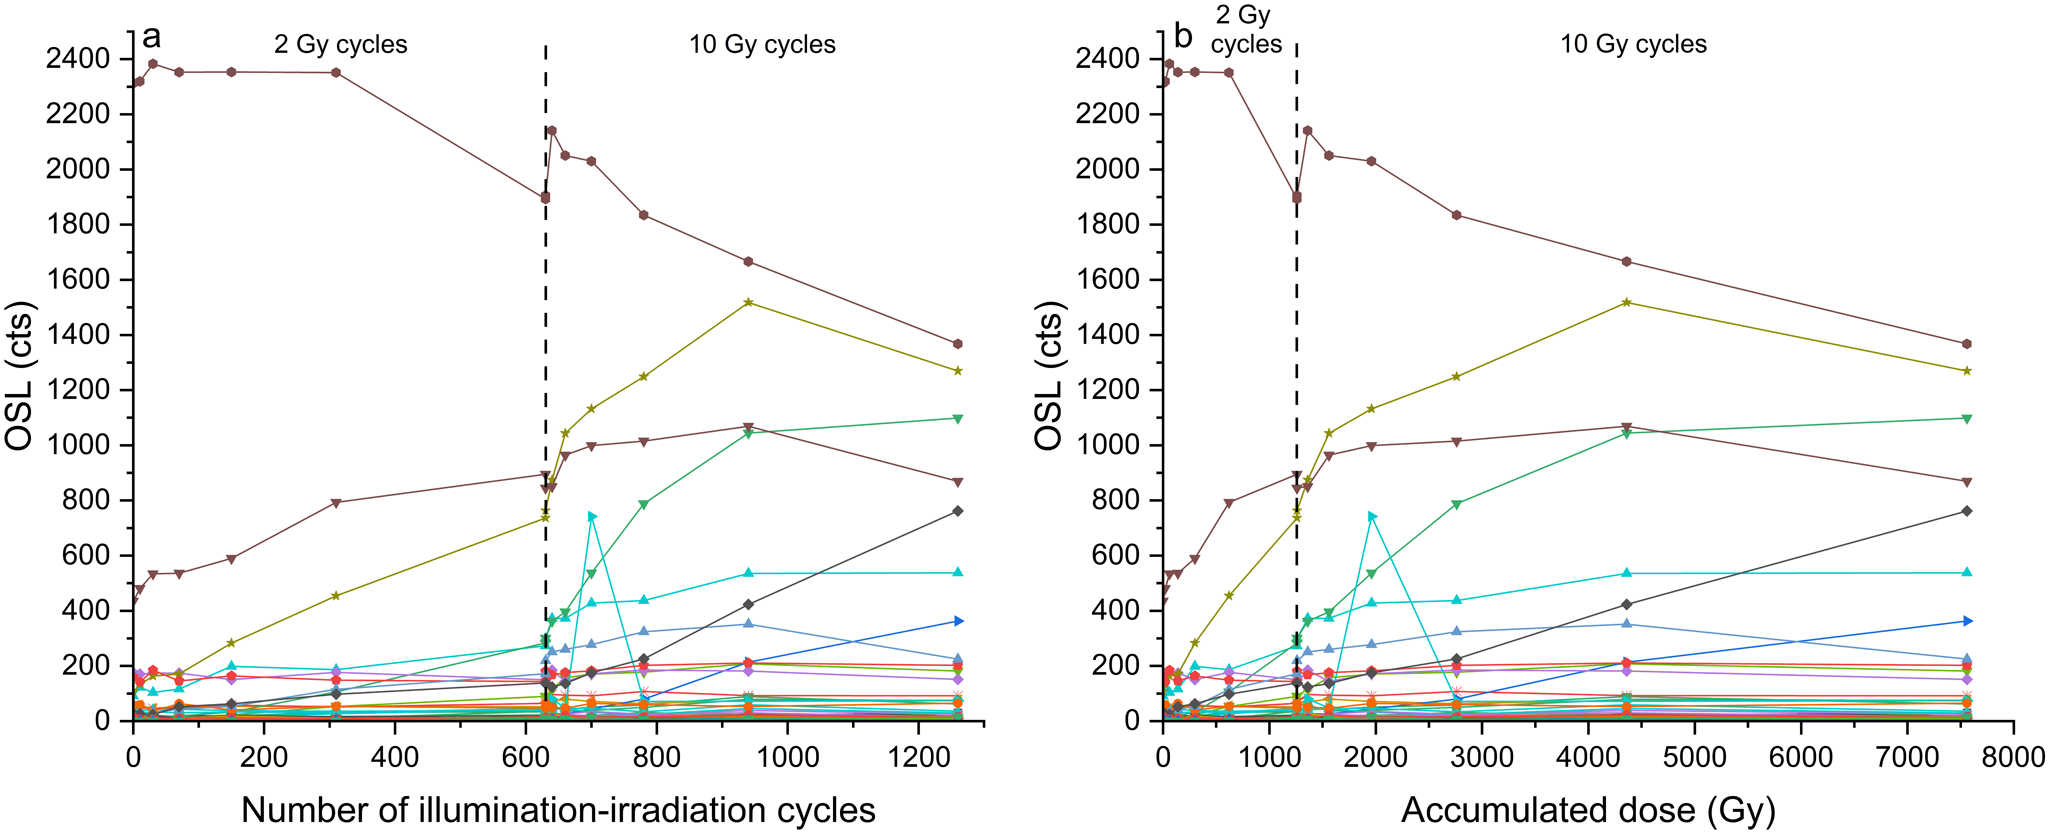
Most quartz single grains from sample L0017 showed trajectories of OSL sensitivity increase, but some brighter grains presented decreasing OSL sensitivity after achieving a maximum sensitivity (Fig. 7). Additionally, some grains presented an abrupt increase in OSL sensitivity when shifting from 2-Gy to 10-Gy cycles. The brightest grain showed stable OSL sensitivity followed by desensitization after 310 accumulated illumination–irradiation cycles (Table 3, Fig. 7). It was also observed that each quartz grain has a specific trajectory of OSL sensitivity variation due to illumination–irradiation cycles. OSL sensitivity trajectories varied in terms of the sensitization rate, maximum sensitivity, and shifting from sensitization to desensitization trend.
Discussion
The study goals include the characterization of quartz OSL sensitivity in the sub-crystal (granodiorite) and sand-grain (fluvial sediment) scales and its response to illumination–irradiation cycles. The OSL sensitivity depth profile in the granodiorite cobble allows evaluating if quartz crystals at the cobble surface are sensitized during fluvial transport before conversion into sand grains. The laboratory experiments applying illumination–irradiation cycles were defined to represent long-distance transport in sedimentary systems, with an accumulated dose equivalent to a burial time of a few million years for the studied quartz sand grains (sample L0017). These goals guide the results discussion.
Quartz crystals from the cobble surface, which were exposed to sunlight during transport, have OSL sensitivity similar to quartz crystals from the inner portion of the cobble, which were not exposed to the sunlight during transport. Quartz crystals from the surface and inner portion of the granodiorite cobble show OSL sensitivity below 20 counts (250-μm diameter ROI), without a trend of increasing sensitivity towards the cobble surface (Fig. 1). The low OSL sensitivity observed in quartz crystals from the granodiorite cobble agrees with previous studies showing low OSL sensitivity of quartz extracted from igneous or metamorphic rocks (Sawakuchi et al., Reference Sawakuchi, Blair, DeWitt, Faleiros, Hyppolito and Guedes2011; Guralnik et al., Reference Guralnik, Ankjærgaard, Jain, Murray, Müller, Wälle and Lowick2015). The results indicate that the transport and deposition history of the studied granodiorite cobble were unable to sensitize the quartz crystals exposed to sunlight during transport in the Humea River. This could be attributed to the relatively short distance (∼30–40 km) between the source area and the deposition site of the studied cobble combined with the bedrock dynamics and reduced sediment storage of the Humea River in the northern Andes. However, this is also in line with previous studies recognizing minor or no influence of fluvial transport on quartz OSL sensitivity (e.g., Magyar et al., Reference Magyar, Bartyik, Marković, Filyó, Kiss, Marković and Homolya2024).
Despite the homogeneously low initial OSL sensitivity, quartz crystals from the studied granodiorite cobble show significant variation in OSL sensitization after illumination–irradiation cycles (Fig. 4a and b). This suggests that primary compositional heterogeneities within and between quartz crystals influence the sensitization of quartz OSL. The heterogeneous sensitization response could be related to specific defects acting as OSL charge traps or recombination centers in quartz (Preusser et al., Reference Preusser, Chitambo, Götte, Martini, Ramseyer, Sendezera, Susino and Wintle2009; Götte and Ramseyer, Reference Götte, Ramseyer, Götze and Möckel2012) or to crystal lattice impurities hindering radiative recombinations (Sharma et al., Reference Sharma, Chawla, Sastry, Gaonkar, Mane, Balaram and Singhvi2017). Quartz crystals from a cobble surface slice (0–2 mm depth) showed a linear increase in OSL sensitivity when submitted to 630 illumination–irradiation (2 Gy) cycles (Fig. 4). The average OSL sensitivity increased one order of magnitude, from 10 to 100 counts, after 630 illumination–irradiation cycles (Fig. 4b). The initially brighter ROIs presented higher sensitization rate (Fig. 4a), also suggesting that the initial concentration of specific defects determines the degree of sensitization in the sub-crystal scale (250-μm diameter ROI). However, sensitization of one order of magnitude observed in quartz crystals from the granodiorite cobble after 630 illumination–irradiation cycles is relatively low compared to the five magnitude range of OSL sensitivity observed in quartz sand grains from fluvial and coastal sediments in South America (Mineli et al., Reference Mineli, Sawakuchi, Guralnik, Lambert, Jain, Pupim, del Río, Guedes and Nogueira2021). It is also noteworthy that the accumulated dose of 1260 Gy comprised in the illumination–irradiation cycles applied to sensitize the granodiorite cobble quartz crystals would demand multiple erosion–deposition cycles, representing a burial storage time of few hundred thousand years if a common dose rate of around 5–6 Gy/ka is assumed for granitic rocks (Jenkins et al., Reference Jenkins, Duller, Roberts, Chiverrell and Glasser2018).
Statistics of OSL sensitivity (step 7 in Table 2) of quartz single grains (n = 100) from sample L0017 subjected to cycles of illumination and irradiation (Table 2). The sensitization cycle dose is informed in the first column. The second column indicates the number of repeated illumination–irradiation cycles before measurement of the OSL sensitivity. The third and fourth columns represent the number of accumulated illumination–irradiation cycles and the accumulated dose during the 1260 cycles, respectively. OSL sensitivity was measured after the 630 illumination and 2-Gy dose cycles and before starting the illumination and 10-Gy dose cycles. Thus, there are two OSL sensitivity measurements corresponding to the first 630 accumulated cycles. Grains lacking an OSL decay curve (“dim grains”) after applying a 100-Gy dose were also considered for statistics calculation. The “Max” column represents the sensitivity of the brightest grain. The last column shows the percentage of light emitted by the brightest grain relative to the light from all grains.

Table 3 Long description
OSL sensitivity statistics are listed by dose in Gy, number of cycles, number of accumulated cycles, and accumulated dose in Gy, with sensitivity columns for mean, standard deviation, sum, median, max, all in counts, plus brightest grain percent. At 2 Gy with 0 cycles and 0 accumulated cycles, mean is 38 cts, standard deviation 235 cts, sum 3813 cts, median 2 cts, max 2313 cts, and brightest grain 61 percent. For the first sequence up to 1260 accumulated cycles, mean rises from 38 cts at 2 Gy to 251 cts at 160 Gy and then is 223 cts at 320 Gy, while max is 2319 to 2383 cts through 20 Gy and is 1893 cts at 320 Gy; brightest grain percent declines from 61 to 35 percent. A second measurement at dose 10 Gy with 0 cycles and 630 accumulated cycles lists mean 56 cts, standard deviation 224 cts, sum 5564 cts, median 3 cts, max 1905 cts, and brightest grain 34 percent. In the later sequence from 10 Gy at 640 cycles through 320 Gy at 1260 cycles, mean ranges from 246 to 273 cts, standard deviation increases from 6335 to 8476 cts then is 8007 cts, median is 3 to 4 cts, max decreases from 2141 to 1368 cts, and brightest grain percent declines from 34 to 17 percent.
Statistics of variation of OSL sensitivity of 100 quartz single grains from sample L0017 (data in Table 3) during application of 1260 illumination–irradiation cycles corresponding to an accumulated dose of 7560 Gy. Statistics are represented in terms of the number of accumulated illumination–irradiation cycles and their corresponding accumulated dose. The first 630 illumination–irradiation cycles used a 2-Gy dose, which was followed by another 630 cycles of illumination and 10-Gy dose. (a, b) Mean OSL sensitivity (n = 100). Error bars correspond to the standard error of the mean. (c, d) Sum OSL sensitivity corresponding to the sum of light emitted by the 100 analyzed quartz grains. (e, f) Maximum OSL sensitivity represented by the initial brightest grain.

Figure 6 Long description
A scatter plot with error bars. The x axis label is, Number of illumination irradiation cycles. The x axis ranges from 0 to 1200. The y axis label is, Mean OSL, cts. The y axis ranges from 0 to 120. Plotted points appear at approximately: 0 and 40, 50 and 42, 100 and 43, 200 and 45, 350 and 50, 600 and 55, 620 and 65, 700 and 75, 800 and 75, 1000 and 85, 1200 and 80. The image B showing a scatter plot with error bars. The x axis label is, Accumulated dose, Gy. The x axis ranges from 0 to 8000. The y axis label is, Mean OSL, cts. The y axis ranges from 0 to 120. Plotted points appear at approximately: 0 and 40, 200 and 45, 500 and 50, 800 and 55, 1000 and 60, 1200 and 65, 2000 and 75, 4500 and 85, 7500 and 80. The image C showing a scatter plot. The x axis label is, Number of illumination irradiation cycles. The x axis ranges from 0 to 1400. The y axis label is, Sum OSL, cts. The y axis ranges from 3000 to 9000. Plotted points appear at approximately: 0 and 3800, 50 and 4000, 200 and 4500, 350 and 5000, 600 and 5500, 620 and 6500, 650 and 7800, 700 and 7400, 900 and 8500, 1300 and 8000. The image D showing a scatter plot. The x axis label is, Accumulated dose, Gy. The x axis ranges from 0 to 8000. The y axis label is, Sum OSL, cts. The y axis ranges from 3000 to 9000. Plotted points appear at approximately: 0 and 3800, 200 and 4000, 800 and 4500, 1000 and 5000, 1200 and 5500, 1500 and 6500, 2000 and 7800, 2500 and 7400, 4500 and 8500, 7500 and 8000. The image E showing a scatter plot. The x axis label is, Number of illumination irradiation cycles. The x axis ranges from 0 to 1400. The y axis label is, Maximum OSL, cts. The y axis ranges from 1200 to 2600. Plotted points appear at approximately: 0 and 2400, 50 and 2400, 100 and 2400, 200 and 2400, 350 and 2400, 600 and 2100, 620 and 1900, 650 and 2200, 700 and 1800, 900 and 1650, 1300 and 1350. The image F showing a scatter plot. The x axis label is, Accumulated dose, Gy. The x axis ranges from 0 to 8000. The y axis label is, Maximum OSL, cts. The y axis ranges from 1200 to 2600. Plotted points appear at approximately: 0 and 2400, 200 and 2400, 500 and 2400, 800 and 2400, 1000 and 2100, 1200 and 2000, 1500 and 1900, 2500 and 1800, 4500 and 1650, 7500 and 1350.
Sensitization trajectories of quartz single grains from sediment sample L0017. Each color represents the sensitization trajectory of a specific quartz grain. The dashed lines mark the change from 2-Gy to 10-Gy cycles. OSL sensitivity (step 7 in Table 2) is represented in terms of the number of accumulated illumination–irradiation cycles (a) and accumulated dose (b).

Figure 7 Long description
Two multi-line graphs. The left graph shows OSL sensitivity against the number of illumination-irradiation cycles, with a vertical dashed line marking the transition from 2-Gy to 10-Gy cycles. The right graph plots OSL sensitivity against accumulated dose in Gy, with a similar dashed line. Each line represents a different quartz grain’s sensitization trajectory. The lines are visually distinguished by different styles and markers. In both graphs, most lines show an increase in OSL sensitivity, with some peaking and then decreasing after the dashed line. Notable peaks occur around 2400 cts for some grains, while others remain stable or show a gradual increase. The dashed lines indicate a significant change in sensitization behavior, with some grains showing abrupt increases or decreases in sensitivity. The graphs illustrate the variation in sensitization trajectories among different quartz grains.
The experiments performed with the fluvial sediment sample L0017 give insights about how quartz OSL could be sensitized during transport and deposition in sedimentary systems. The quartz sand grains from sample L0017 show an initial (natural) OSL sensitivity range of three orders of magnitude (10–1000 counts). This large variation in OSL sensitivity of quartz grains from the same sediment sample, which is commonly observed (Pietsch et al., Reference Pietsch, Olley and Nanson2008; Sawakuchi et al., Reference Sawakuchi, Blair, DeWitt, Faleiros, Hyppolito and Guedes2011), could be related to the heterogeneous sensitization response of grains from the same source rock, as suggested by the sensitization experiments performed with the granodiorite cobble slice (sample RSA01).
The study results show that illumination–irradiation cycles increase the OSL sensitivity of quartz sand grains (average of 100 grains) by up to one order of magnitude around 700 illumination–irradiation cycles (Fig. 6). The maximum sensitization of the population of sediment grains (summed OSL sensitivity) is acquired after illumination–irradiation cycles corresponding to an accumulated dose of approximately 4000 Gy (Fig. 6d), which would imply a burial time of 2–4 Ma, considering average dose rates of 1–2 Gy/ka for quartz in sandy sediments (Mahan et al., Reference Mahan, Rittenour, Nelson, Ataee, Brown, DeWitt and Durcan2022).
Radiation doses of 2 or 10 Gy would correspond to burial time in the few thousand years range (1–20 ka). Thus, the occurrence of hundreds of transport–burial events is unlikely to occur in a single sedimentary system, even in long-distance systems such as large Amazon rivers or large eolian dune fields, where transport distances along hundreds to thousands of kilometers correspond to multiple short-time (years to decades) deposition events. Sediment transport in large fluvial systems, for example, occurs in multiple events with storage of sediments in floodplains ranging from months to a few thousand years (Wohl, Reference Wohl2021), where longer storage time is associated with reduced number of transport events. Alternatively, storage in fluvial terraces can reach a timespan of a hundred-thousand years, which is equivalent to 100 Gy dose range (e.g., Pupim et al., Reference Pupim, Sawakuchi, Almeida, Ribas, Kern, Hartmann and Chiessi2019), but the number of transport–burial cycles is reduced under long-term burial dynamics. Hence, illumination–irradiation cycles occurring during transport of sand in fluvial systems would be unsuitable to allow significant quartz OSL sensitization. This agrees with results from the studied granodiorite cobble and with recent studies showing that OSL sensitivity of quartz sand grains under transport in rivers is controlled by sediment sources instead of sediment transport distance (Sawakuchi et al., Reference Sawakuchi, Jain, Mineli, Nogueira, Bertassoli, Häggi and Sawakuchi2018; Capaldi et al., Reference Capaldi, Rittenour and Nelson2022; Magyar et al., Reference Magyar, Bartyik, Marković, Filyó, Kiss, Marković and Homolya2024; Parida et al., Reference Parida, Kaushal, Chauhan and Singhvi2025).
Although Pietsch et al. (Reference Pietsch, Olley and Nanson2008) observed downstream increase of quartz OSL sensitivity in the Castlereagh River (Australia), this pattern also can also be attributed to a downstream shift from volcanic to sedimentary source rocks in the watershed. In this case, the sedimentary rocks would source quartz grains with higher OSL sensitivity compared with quartz from volcanic sources. Some studies have found quartz with high OSL sensitivity in sediments of bedrock rivers draining igneous and metamorphic rocks, suggesting that sensitization occurs in interfluve soils (e.g., Breda et al., Reference Breda, Pupim, Sawakuchi and Mineli2021). The residence time of quartz in soils can reach several hundred thousand to a few million years in tectonically stable areas such as in central and northern South America (e.g., Wittmann et al., Reference Wittmann, von Blanckenburg, Maurice, Guyot, Filizola and Kubik2011). In this context, the upward and downward movement of quartz grains by bioturbation in soils of tectonically stable areas, such as shield areas of Brazil or Australia, can promote surface exposure and burial events of quartz grains in temporal dynamics compatible with accumulated burial doses of hundreds to thousands of Gy. However, it must be emphasized that the sensitization provoked by laboratory illumination–irradiation cycles performed in this study was unable to reproduce the sensitivity range observed in sediments (Mineli et al., Reference Mineli, Sawakuchi, Guralnik, Lambert, Jain, Pupim, del Río, Guedes and Nogueira2021), suggesting that other surface processes might be involved in sensitization of quartz sediment grains.
Conclusions
Similar OSL sensitivity of quartz crystals from the surface and inner portion of the studied granodiorite cobble indicates that sediment transport itself was unable to promote the luminescence sensitization of quartz. However, this observation is limited to the short transport distance (30–40 km) of the studied cobble from the Humea River. Quartz crystals from the granodiorite cobble and quartz single grains from the fluvial sand exhibit varied response to laboratory illumination–irradiation cycles, indicating that OSL sensitization is controlled by compositional heterogeneities of quartz in the sand-grain scale. Laboratory experiments demonstrate that quartz OSL sensitization due to illumination–irradiation cycles is limited, reaching a maximum OSL sensitivity, and cannot produce the high sensitivity quartz grains observed in Quaternary sediments. The accumulated dose in the laboratory illumination–irradiation cycles, which resulted in the increase of quartz OSL sensitivity by one order of magnitude is equivalent to a burial time of a few million years. This is unlikely to occur during sediment transport and storage cycles in a fluvial system. Hence, the production of quartz sediment grains with OSL sensitivity up to five orders of magnitude higher than the primary sensitivity of quartz crystals from igneous or metamorphic rocks has a minor influence of solar exposure–burial irradiation cycles. Thus, it is concluded that other natural processes may drive the production of high OSL sensitivity quartz found in sediments from tectonically stable Quaternary settings.
Acknowledgments
We thank Hendrik Olesen for assistance with the preparation of rock slices used in luminescence measurements. Paul Hanson, an anonymous reviewer, and the editor Shannon Mahan are acknowledged for their constructive and critical comments, which greatly improved the quality and clarity of the manuscript. This study was supported by the CAPES-ASpECTO grants 88887.091731/2014-01 and 88881.187538/2018-01. AOS thanks FAPESP (grant 2018/23899-2) and CNPq (grant 307179/2021-4) for financial support. CMC acknowledges financial support from FAPESP (grants 2018/15123-4 and 2019/24349-9), CNPq (grant 312458/2020‐7) and CAPES-COFECUB (grants 8881.712022/2022-1 and 49558SM).