

Mastery motivation is an important developmental construct proposed to impact on many aspects of development across the lifespan (Shiner, Masten, & Roberts, Reference Shiner, Masten and Roberts2003; Shonkoff & Phillips, Reference Shonkoff and Phillips2000). Described as the psychological force or drive that stimulates individuals to attempt and persist with challenging tasks (Morgan, Harmon, & Maslin-Cole, Reference Morgan, Harmon and Maslin-Cole1990), mastery motivation is associated with children's cognitive, learning, social, motor, and academic outcomes (Broussard & Garrison, Reference Broussard and Garrison2004; Jennings, Yarrow, & Martin, Reference Jennings, Yarrow and Martin1984; Majnemer et al., Reference Majnemer, Shevell, Law, Birnbaum, Chilingaryan, Rosenbaum and Poulin2008; Yarrow et al., Reference Yarrow, McQuiston, MacTurk, McCarthy, Klein and Vietze1983). In adulthood, mastery motivation and mastery-oriented learning strategies have been linked to educational and occupational achievement (Burlison, Murphy, & Dwyer, Reference Burlison, Murphy and Dwyer2009; Spence & Helmreich, Reference Spence, Helmreich and Spence1983).
Mastery motivation research in childhood has employed three types of measurement: free play, structured tasks, and questionnaires (Busch-Rossnagel & Morgan, Reference Busch-Rossnagel, Morgan, Barrett, Fox, Morgan, Fidler and Daunhauer2013; MacTurk, Morgan, & Jennings, Reference MacTurk, Morgan, Jennings, MacTurk and Morgan1995). Free play and structured tasks have some limitations as researchers are generally only observing a child in a single session for a short period of time and measuring just one or two aspects of mastery motivation, such as task persistence and affect (Morgan et al., Reference Morgan, Maslin-Cole, Harmon, Busch-Rossnagel, Jennings, Hauser-Cram, Brockman and Messer1993). By contrast, questionnaires provide a more global measure of mastery motivation since ratings are derived from a range of observations in different situations over time. Studies employing both observational and questionnaire measures have produced inconsistent results, with some reporting good relationships between the two methods of measurement (Jennings et al., Reference Jennings, Yarrow and Martin1984; Morgan & Bartholomew, Reference Morgan and Bartholomew1998), and others finding no significant correlations (Gilmore, Cuskelly, & Purdie, Reference Gilmore, Cuskelly and Purdie2003; Gilmore & Cuskelly, Reference Gilmore and Cuskelly2011).
The most extensively used questionnaire in mastery motivation research with children is the Dimensions of Mastery Questionnaire (DMQ; Morgan, Busch-Rossnagel, Barrett, & Wang, Reference Morgan, Busch-Rossnagel, Barrett and Wang2009), which can be completed by parents or teachers and, in the case of older children, self-report. The DMQ produces scores for various components of mastery motivation, including cognitive and motor task persistence, persistence in social interactions with children and adults, task pleasure, and negative reactions to failure. There is also a subscale assessing competence.
An extensive body of work has explored mastery motivation in infants and children; however, research with adults has been very limited and there appears to be no comprehensive measure of adult mastery motivation. Achievement motivation questionnaires such as the Academic Motivation Scale (Vallerand et al., Reference Vallerand, Pelletier, Blais, Brière, Senécal and Vallières1992) and the Motivated Strategies for Learning Questionnaire (Pintrich, Smith, Garcia, & McKeachie, Reference Pintrich, Smith, Garcia and McKeachie1993) have been used to assess motivation for learning and achievement; however, these measures tend to be domain specific and are generally only suitable for use with young adults in academic settings. One exception is the Work and Family Orientation Questionnaire (WOFO; Helmreich & Spence, Reference Helmreich and Spence1978), which includes a mastery subscale to assess an adult's preference for challenging tasks, as well as a work orientation subscale to measure career motivation. Some measures of related constructs also include components relevant to motivation. For example, one subscale of the self-regulation measure developed by Geldhof, Little, and Hawley (Reference Geldhof, Little and Hawley2014) contains items related to persistence, but is intended for assessment of academic and social domains only.
Because the measures described above assess only relatively narrow aspects of mastery motivation, a more comprehensive adult questionnaire is needed. Barrett and Morgan (Reference Barrett, Morgan, MacTurk and Morgan1995) proposed that, regardless of age or developmental stage, the definition of mastery motivation and its characteristic components remain the same. However, the tasks, skills, and goals change with age. Based on Morgan et al.’s (Reference Morgan, Harmon and Maslin-Cole1990) conceptualisation of mastery motivation and a review of relevant literature, we identified four components of mastery motivation as necessary in the comprehensive measurement of mastery motivation in adulthood: task persistence, preference for challenge, task-related pleasure, and task absorption.
Task persistence involves sustained effort to gain mastery of a challenging task and is one of the most commonly operationalised components of mastery motivation (Barrett, Morgan, & Maslin-Cole, Reference Barrett, Morgan, Maslin-Cole and Messer1993; McCall, Reference McCall, MacTurk and Morgan1995; Morgan et al., Reference Morgan, Harmon and Maslin-Cole1990). Also often measured is an individual's preference for challenging activities (Gilmore & Cuskelly, Reference Gilmore and Cuskelly2011; McCall, Reference McCall, MacTurk and Morgan1995; Morgan et al., Reference Morgan, Harmon and Maslin-Cole1990). Those high in mastery motivation are likely to embrace rather than avoid challenge, provided the task or goal is optimally challenging (Harter, Reference Harter1977; Harter & Zigler, Reference Harter and Zigler1974; Redding, Morgan, & Harmon, Reference Redding, Morgan and Harmon1988). Task pleasure relates to the positive emotions that are displayed while working towards, and particularly when achieving, mastery (Morgan et al., Reference Morgan, Busch-Rossnagel, Barrett and Wang2009). Task absorption has not been measured consistently in mastery motivation research, but similar concepts such as engrossment and attention have been assessed (Chang & Burns, Reference Chang and Burns2005; Morgan et al., Reference Morgan, Harmon and Maslin-Cole1990; Vlachou & Farrell, Reference Vlachou and Farrell2000). Morgan et al. (Reference Morgan, Harmon and Maslin-Cole1990) proposed that individuals who are motivated to master a task or problem do so in a focused manner. Intense absorption in an optimally challenging task has also been referred to as flow (Csikszentmihalyi, Abuhamdeh, & Nakamura, Reference Csikszentmihalyi, Abuhamdeh, Nakamura, Elliot and Dweck2005).
Two other constructs, self-efficacy and perceived control, while not direct measures of mastery motivation, are relevant because of their influence on mastery behaviours (Deci, Reference Deci1975; Morgan et al., Reference Morgan, Busch-Rossnagel, Barrett and Wang2009). Self-efficacy is important because if individuals do not have confidence in their own ability, they are less likely to attempt a task or persist when faced with challenge (Schunk & Pajares, Reference Schunk, Pajares, Elliot and Dweck2005). Similarly, when individuals perceive that they are in control of their own learning and performance and that they have, or can acquire, the necessary skills to master a task, they are more likely to engage, sustain, and initiate goal-directed behaviour (Baumwoll, Reference Baumwoll1983; Boggiano, Main, & Katz, Reference Boggiano, Main and Katz1988; Petri & Govern, Reference Petri and Govern2004; Schunk, Reference Schunk and Maddux1995).
Mastery motivation is clearly important across the lifespan, not only during infancy and childhood. Being able to establish and work independently towards goals is an integral part of adult life that is possibly even more important in the later years when other-imposed goals (e.g., those associated with regular employment) have diminished. Mastery motivation will contribute to attainments, not only in the areas of education and employment, but also in the personal endeavours that are part of individual lives. Mastery motivation is necessary for the amateur athlete who is working towards a personal best, the home chef who is striving to achieve the perfect risotto, and the elderly person who is trying to maintain independence despite declining mobility. Notably, such endeavours are often undertaken for mastery and personal satisfaction, being intrinsically driven without any economic reward. Given the importance of understanding and supporting mastery motivation across the lifespan, the aim of the present study was to develop a comprehensive, reliable, and valid self-report measure for adults.
Method
Participants
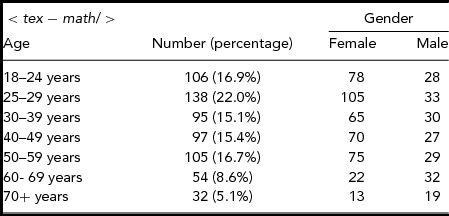
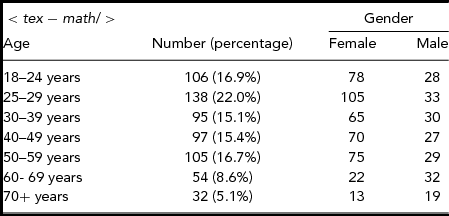
The participants were 628 adults (68% female) aged from 18 to 90 years. The breakdown of the sample by gender and age is shown in Table 1. The sample was somewhat skewed towards younger adults and those with higher levels of educational attainment. Just over 10% of the sample consisted of current university students. Although older adults were approached, they were more reluctant to participate than younger people. A higher proportion of participants reported having completed a university degree (55%) than in the general population (24%; Australian Bureau of Statistics, 2011), and 24% of the sample reported junior or senior high school as their highest level of achievement compared with approximately half of the Australian population.
Breakdown of Sample (n = 628) by Age and Gender
Participants were recruited using a wide variety of methods in Brisbane, the capital city of the state of Queensland, Australia. An online version of the questionnaire was created and the link was distributed via email to personal contacts of the researchers, and these contacts were asked to distribute it further. The link and information about the study were posted on the first author's personal Facebook page. Hard copies of the questionnaire were distributed within the community via letterbox drops and advertisements on shopping centre notice boards, and various community groups agreed to distribute the questionnaire to their members. Participants were recruited from a retirement facility and a nursing home to obtain responses from an older demographic. Most participants resided in Brisbane or the surrounding areas.
Measure
The Dimensions of Adult Mastery Motivation Questionnaire (DAMMQ) is a 41-item, self-report measure of adult mastery motivation. The questions comprise a mixture of items adapted from the adolescent self-report version of the Dimensions of Mastery Questionnaire (DMQ; Morgan et al., Reference Morgan, Busch-Rossnagel, Barrett and Wang2009) and new items developed from a review of relevant literature (described earlier), and consultations with key researchers in the area of mastery motivation — in particular, the developers of the DMQ (Morgan et al., Reference Morgan, Busch-Rossnagel, Barrett and Wang2009).
Items were designed to cover the four identified components of adult mastery motivation (task persistence, preference for challenge, task-related pleasure, and task absorption) as well as two aspects proposed to be related to adult mastery motivation (self-efficacy and perceived control). Items are rated on a 5-point Likert scale ranging from 1 (not at all typical) to 5 (very typical). There are eight items relating to preference for challenge (e.g., ‘I choose to do tasks that I think will be challenging for me’), nine task persistence items (e.g., ‘I persist with a task even if I feel it is difficult’), eight items about task-related pleasure (e.g., ‘I feel a sense of achievement when I complete a difficult task’), five task absorption items (e.g., ‘I perform at my best when I am completely absorbed in a task’), six items assessing self-efficacy (e.g., ‘I am good at the things I do’) and five relating to perceived control (e.g.,’ If I am unsuccessful with a difficult task I know that I can gain the skills needed to try it again’). Eight of the 41 items are negatively worded in order to reduce response bias.
In line with the DMQ, the questionnaire contains the following instruction: ‘Circle the number that best indicates how typical each statement is of you. Think of a rating of 3 as being somewhat typical of you.’
The Work and Family Orientation Questionnaire (WOFO; Helmreich & Spence, Reference Helmreich and Spence1978) is a 32-item scale measuring achievement motivation and attitudes toward family and career. It comprises Likert scale questions that measure achievement motivation, and open-ended questions that assess attitudes towards family and career. Four factors are proposed to measure achievement motivation: mastery, work orientation, competitiveness, and personal unconcern. The mastery factor assesses an individual's preference for completing challenging tasks; the work orientation factor assesses positive attitudes towards work; the competitiveness factor measures the desire to win in interpersonal situations; and personal unconcern measures concerns about the reactions of others to one's achievement. In order to assess the concurrent validity of the DAMMQ, the two subscales mastery and work orientation were used because they tap similar constructs to the DAMMQ (i.e., persistence, preference for challenge, and task-related pleasure). Both subscales have been found to have acceptable internal consistency (mastery α = .64; work orientation α = .7; Fairchild, Horst, Finney, & Barron, Reference Fairchild, Horst, Finney and Barron2005).
Procedure
The University Human Research Ethics Committee granted ethical clearance for this project. A pilot of the initial version of the DAMMQ was conducted with 10 participants to check the wording of questions and length of the questionnaire. On the basis of their feedback, minor modifications were made to the wording and order of some questions.
Participants were then recruited for the main study using the methods described earlier. The questionnaire package began with demographic information (gender, age, and education), followed by the DAMMQ, and finally the two WOFO scales. Respondents had the option of remaining anonymous to help decrease the likelihood of responses being influenced by social desirability bias, or providing contact details, such as a phone number or email address. From those participants who provided contact details, 50 were contacted and asked to recomplete the DAMMQ 2 to 3 months after the original questionnaire had been completed in order to determine test-retest reliability. Thirty-nine participants (26 females and 13 males) returned the second questionnaire.
Results
Factor Analysis
The 41 items of the DAMMQ were subjected to a principal axis factoring (PAF) analysis with oblique rotation (Promax). Oblique rotation was used as it was determined to be the most appropriate method of rotation when factors are proposed to be related (Field, Reference Field2009). The suitability of the data was assessed before analyses were conducted. Although five items were impacted by skewness and kurtosis, and multiple univariate outliers were identified, multiple data transformations resulted in no significant change to the overall analyses. Therefore, the raw data were used, as factor analysis has been found to be robust to breaches of normality (Tabachnick & Fidell, Reference Tabachnick and Fidell2001). The Kaiser-Meyer-Olkin measure verified the sampling adequacy for the analysis, KMO = .93 (‘superb’ according to Field, Reference Field2009) and all KMO values for individual items were >.64 (‘mediocre’ according to Field, Reference Field2009), and therefore were just above the acceptable level. Bartlett's test of sphericity, χ2(820) = 9937.74, p < .001, indicated that correlations between items were sufficiently large for PAF. Although no correlations were found to be above .9, the determinant approached zero (determinant = 8.30E-008) indicating that multiple items were correlating too highly and therefore the assumption of multicollinearity was breached. Nine factors were identified as meeting Kaiser's (Reference Kaiser1960) criterion of retaining eigenvalues of one or above, with these factors accounting for 46.7% of the variance.
A review of the initial factor loadings from the pattern matrix showed that all eight negatively worded items (4, 11, 13, 17, 23, 27, 35, and 36) loaded on a single factor with no other positively worded items loading with them. No common characteristics could be found to represent this factor. Thus, all eight negatively worded items were excluded from subsequent analyses.
A further nine items were sequentially removed. Items 14 and 33 had low communalities (below .30) and low correlations with other items, with item 14 not correlating above .30 with any other items, and item 33 only correlating above .30 with one other item. Items 20 and 31, representing task-related pleasure, loaded together on their own factor. Both items failed to correlate above .30 with any other positively worded items, suggesting they had a poor relationship with the other items and therefore were not measuring the same overall construct. These two items were consequently removed. Item 2 was removed to reduce the level of multicollinearity impacting the analysis. Items 28 and 41 were found not to load on any factors above the adequate level of .32 (Tabachnick & Fidell, Reference Tabachnick and Fidell2001) and were consequently not included in further analyses.
For the final PAF, oblique rotation (Promax) was used and 24 out of the original 41 items were retained. The Kaiser-Meyer-Olkin measure verified the sampling adequacy for the analysis, KMO = .93 (‘superb’ according to Field, Reference Field2009) and all KMO values for individual items were >.83, (‘great’ according to Field, Reference Field2009) and therefore well above the acceptable level. Bartlett's test of sphericity, χ2(276) = 6023.38, p < .001, indicated that correlations between items were sufficiently large for PAF. Removal of the previously described items increased the determinant to .000056, above the recommended level of .00001 (Field, Reference Field2009), and therefore the assumption of multicollinearity was no longer breached.
The pattern matrix revealed that the 24 items loaded on five factors (task persistence, preference for challenge, task-related pleasure, self-efficacy, and task absorption), which met Kaiser's (Reference Kaiser1960) criterion of retaining eigenvalues of one or above. These factors accounted for 47.64% of the variance. Parallel Analysis was used to provide empirical support for extracting the final five factors. This analysis compares the eigenvalues for the extracted factors to those of random factors extracted by chance. Although the analysis found six factors to have eigenvalues greater than the 99th percentile for random factors, the sixth factor was found to be marginal (0.267). Buja and Eyuboglu (Reference Buja and Eyuboglu1992) found that parallel analysis can over-extract, at times identifying negligible factors. After evaluating the six-factor solution, using PAF, it was found that a five-factor solution was more interpretable and therefore the sixth factor was not retained.
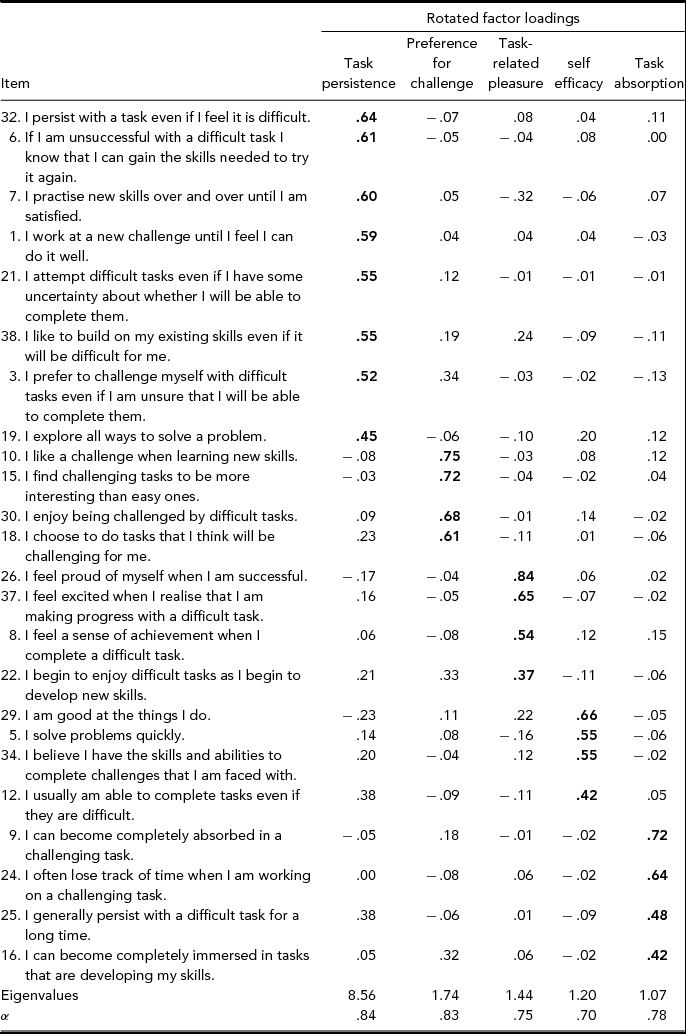
Eight items were found to load on the first factor and four items loaded on each of the remaining four factors, with all factor values equalling above Tabachnik and Fidell's (Reference Tabachnick and Fidell2001) recommendation for a minimum loading of 0.32. There were four items that cross-loaded on two factors; however, they were all significantly lower on one of the factors and the larger value was retained for each. Table 2 shows the final factors and the factor loadings for each item from the pattern matrix. Cronbach's alphas are also presented for each factor.
DAMMQ Final Factors, Items, Rotated Factor Loadings From the Pattern Matrix and Factor Reliabilities

Note: Factor items are in bold face.
Means and Correlations
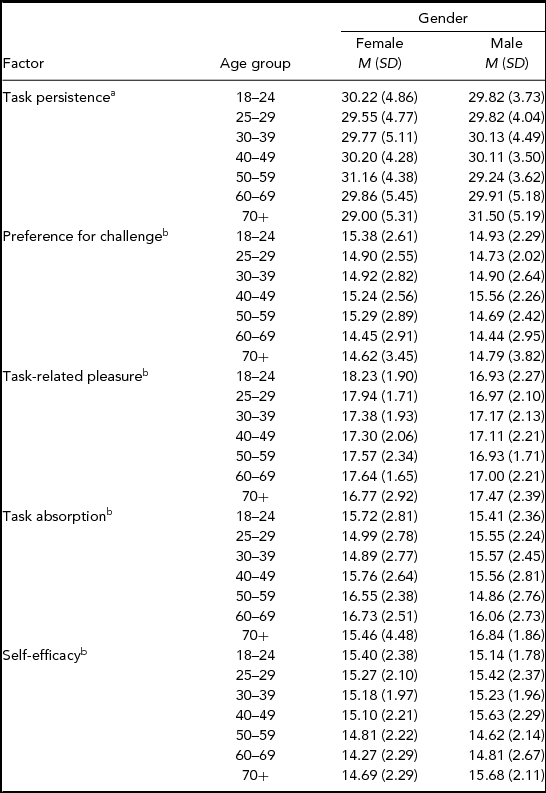
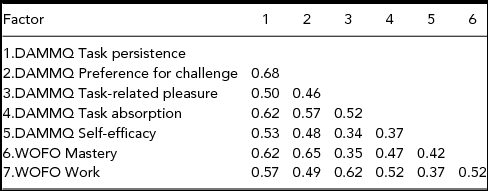
Means and standard deviations for each of the five DAMMQ factors, split by age and gender, are presented in Table 3. Correlations among the factors were positive and significant (see Table 4). Correlations were similar for males and females.
DAMMQ Factor Means and Standard Deviations Split for Age and Gender
Note: aPossible range 8–40; bPossible range 4–20.
Correlations of DAMMQ and WOFO Subscale Scores
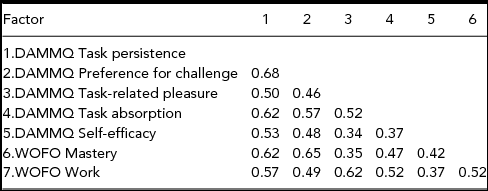
Note: All correlations are significant at p < .001.
Concurrent Validity
As shown in Table 4, there were significant positive correlations among all DAMMQ subscales and the two WOFO subscales.
Test-Retest Reliability
Thirty-nine participants completed the DAMMQ again after a 2- to 3-month interval. Using G*Power analysis, this sample size was determined to be adequate, with an 86% probability of identifying moderate correlations between scores at the two time points if they existed. Good test-retest reliability was demonstrated, with correlations ranging from .48 to .71 (task persistence, r = .69, p < .01; preference for challenge, r = .71, p < .01; task-related pleasure, r = .66, p < .001; task absorption, r = .70, p < .01; self-efficacy, r = .48, p < .01).
Differences According to Age, Gender and Education
A two-way between-groups multivariate analysis of variance (MANOVA) was performed to investigate age and gender differences within the sample. Using the five DAMMQ factors as the dependent variables, there was a significant main effect for age, F(30, 3045) = 1.52, p < .05, partial η2 = .02, and gender, F(5, 605) = 2.39, p < .05, partial η2 = .02, but no significant interaction effect, F(30, 3045) = 1.07, p = .37, partial η2 = .01. The univariate results showed no significant differences for age on any of the DAMMQ factors. According to Tabachnik and Fidell (Reference Tabachnick and Fidell2001), this can occur when the group sample sizes are reduced, causing the inbuilt family wise error controls in the MANOVA to cancel out univariate significance even though a significant multivariate effect was found. In order to remove this adjustment put on the MANOVA, separate ANOVAs were run for each factor. For age, a one-way between-groups ANOVA showed a significant difference on task absorption, F(6, 619) = 2.80, p < .05, partial η2 = .02. Post hoc analyses for uneven group sizes were used to explore all group differences (Hochberg's GT5, as recommended by Field, Reference Field2009). Although no significant differences were found between the age groups, trend analysis found a significant linear trend, F(1, 619) = 9.36, p < .05. Task absorption scores steadily increased from 30–39 years to 60–69 years. No significant differences were found for age on any of the remaining factors.
To further explore the significant MANOVA main effect for age and the extent to which relationships between dependent variables were having an effect, a discriminant analysis was used, as recommended by Field (Reference Field2009). The analysis revealed one discriminant function, which explained 74.2% of the variance, canonical R 2 = .08, and significantly differentiated the age groups, Λ = .89, χ2(30) = 73.15, p < .05. Age groups differed according to a combination of two DAMMQ factors, task absorption and self-efficacy. Post hoc analysis showed that participants aged 18–24, 25–29, and 30–39 significantly differed from participants aged 50–59, 60–69 and 70+, with younger respondents reporting higher self-efficacy and lower task absorption than older people, and those in the older age groups reporting higher task absorption and lower self-efficacy. The 40–49 year age group only differed significantly from the 60–69 year age group.
For gender, the univariate results from the MANOVA showed a significant difference for task-related pleasure, F(1, 609) = 5.58, p < .05, partial η2 = .01, with females reporting significantly higher levels of task-related pleasure than males (females: M = 17.55, SD = 2.63; males: M = 17.09, SD = 2.08). No significant differences were found for gender on any of the other factors.
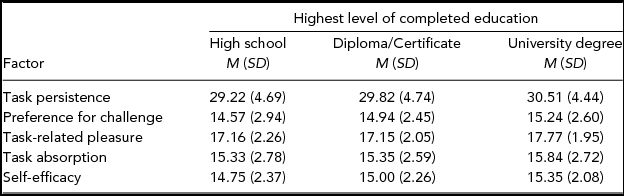
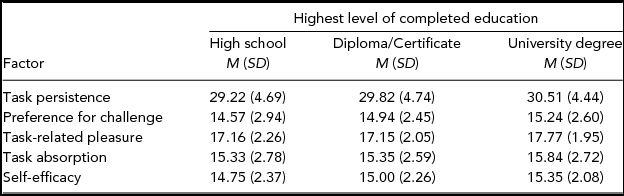
A one-way between-groups MANOVA was conducted to explore differences in mastery motivation according to education. The sample was divided into three groups based on highest level of education attained (high school, post-school diploma/certificate or university degree) and the five DAMMQ factors were used as dependent variables. A significant main effect of education was found, F(10, 1236) = 1.93, p < .05, partial η2 = .02. Univariate results showed significant differences on four of the five factors: task persistence, F(2, 621) = 4.35, p < .05, partial η2 = .01; preference for challenge, F(2, 621) = 3.28, p < .05, partial η2 = .01; task-related pleasure, F(2, 621) = 6.98, p < .05, partial η2 = .02; and self-efficacy, F(2, 621) = 4.11, p < .05, partial η2 = .01. In all cases, university-educated participants reported significantly higher levels of task persistence, preference for challenge, task-related pleasure and self-efficacy than those with only a high school qualification. The means and standard deviations for each factor by educational attainment are shown in Table 5. These between-group differences need to be interpreted with caution because, although significant differences were found, the effect sizes were small, as were the mean score differences for the statistically different groups.
DAMMQ Means and Standard Deviations for Different Levels of Education
Discussion
This article describes the development and initial validation of the first adult self-report measure of mastery motivation. The final version of the DAMMQ comprises 24 items and five subscales: task persistence, preference for challenge, task-related pleasure, task absorption, and self-efficacy. The subscales have good reliability and validity, including internal consistency, test-retest reliability, and concurrent validity.
Many of the original items were not retained following factor analysis. Interestingly, the eight negatively worded items loaded on their own independent factor. The only shared characteristic among the items was that they were negatively worded and the mean responses for each item were alike, suggesting that participants were responding to these items in the same way. Previous research has found similar issues when including negatively worded items within a questionnaire (Ennos, Reference Ennos2000; Miller & Cleary, Reference Miller and Cleary1993; Roszkowski & Soven, Reference Roszkowski and Soven2010). DiStefano (Reference DiStefano2006) suggested that differences in responding to negatively versus positively worded items may result from people's reluctance to admit to their own negative traits. In a questionnaire about student course evaluations, Roszkowski and Soven (Reference Roszkowski and Soven2010) found that positively reframing two negatively worded items improved the internal consistency of the measure and caused a separate factor comprising negative items to disappear. Of note, the negatively worded questions on the DMQ have been problematic, with these items having been eliminated from the latest revision of the instrument (George Morgan, personal communication, 5 May 2015).
Among other items removed from the final DAMMQ were two that were identified as tapping into negative reactions to failure, which is a separate factor in the DMQ (Morgan et al., Reference Morgan, Busch-Rossnagel, Barrett and Wang2009). During item development it was expected that these items would measure an aspect of task-related pleasure that focused on the negative emotions experienced when a goal is not achieved. Theory suggests that an individual's motivation to master new tasks can be undermined if negative reactions are frequent and severe (Dweck & Elliot, Reference Dweck, Elliot and Hetherington1983); however, the DAMMQ items relating to negative reactions to failure had low correlations with other retained items, suggesting that they were not contributing to the measurement of the construct of mastery motivation in adults.
The majority of items measuring perceived control were also removed from the final version of the DAMMQ. These items were weakly related and a number loaded on other factors. Like self-efficacy, perceived control is proposed to be an important motivator that drives individuals to seek challenge and persist with tasks (Deci, Reference Deci1975). It is possible that the items designed to measure perceived control failed to do so consistently because perceived control is dependent on context (see Lefcourt, VonBaeyer, Ware, & Cox, Reference Lefcourt, VonBaeyer, Ware and Cox1979), making it difficult for respondents to allocate overall ratings. Instead of general statements, items that are worded to be more context specific may be preferable, and the use of terms such as ‘usually’ and ‘most likely’ (e.g., ‘When I achieve a goal it's usually because I worked hard’) may help to control for different experiences across varying contexts, thus providing a more robust measure of perceived control.
Within the sample there were few significant differences across age groups, but younger people reported higher self-efficacy and lower task absorption than older ones. There were no differences in mastery motivation between males and females, apart from the higher task pleasure reported by women. Although some older research has reported men to have higher levels of mastery motivation than women (Farmer, Reference Farmer1985; Spence & Helmreich, Reference Spence and Helmreich1978), gender roles have changed significantly over the past few decades. The percentage of women in the workforce in Australia has nearly doubled since 1966 (Australian Bureau of Statistics, 2011) and, in fact, one recent study found that women were more likely than men to adopt mastery goals (Harackiewicz, Tauer, Barron, & Elliot, Reference Harackiewicz, Tauer, Barron and Elliot2002).
There were some small but significant differences in mastery motivation associated with levels of educational attainment. Tertiary qualified adults reported significantly higher task persistence, preference for challenge, task-related pleasure, and self-efficacy than those with only a high school education. Higher academic motivation has been reported previously for adults who have spent more years in full-time education (Schoon, Reference Schoon2008), and Helmreich and Spence (Reference Helmreich and Spence1978) demonstrated higher mastery motivation scores in university populations when compared to high school students. It is probable that highly motivated people are more likely to pursue and successfully complete tertiary study. In addition, however, tertiary education may present more opportunities for mastery and success, thus promoting feelings of competence that stimulate the motivation for further mastery.
Limitations and Future Research
Some limitations of this study need to be noted. Within our sample there was an over-representation of females and those with tertiary education qualifications, and only small numbers of participants over the age of 60 years. Furthermore, the majority of the sample was drawn from an urban, middle class population in Australia. It is possible that individuals with lower levels of education, those living outside urban areas, and people of other cultural backgrounds may respond differently to the questionnaire. In addition, the psychometric data were based on a sample of individuals who were presented with the original 41 items. It is possible that a somewhat different pattern of responses might be obtained using the shorter 24-item instrument. For these reasons, viewing the data as normative should be undertaken with caution. With respect to the group differences that were identified within the sample, it is important to note that sample sizes above 400 can cause relatively small score differences to be exaggerated and thus to reach statistical significance (Field & Hole, Reference Field and Hole2003). In this study, the effect sizes for each between-group analysis and the score differences between groups were relatively small.
Another limitation lies in the possibility that people with higher motivation may have been more likely to participate in the study. This could be especially true for adults aged 60 or above. Many elderly individuals were approached but declined to participate. Obtaining a representative sample of the population is a constant challenge for research. In future research with the DAMMQ, it would be important to include participants from rural areas, those from more varied socioeconomic and cultural backgrounds, and a greater number in the older age groups.
With any self-report measure there is always the possibility that some respondents are influenced by a social desirability bias or a lack of adequate insight into their own abilities and thus do not report accurately (Duncan & McKeachie, Reference Duncan and McKeachie2005). Furthermore, an individual's point of reference could affect the manner in which he or she responds. One elderly participant mentioned that he completed the questionnaire thinking about how he behaved as a younger man because he no longer had either the opportunities or the confidence to tackle challenging activities. Thus, he was reporting on his previous rather than current levels of mastery motivation. Other participants may have compared themselves to a self-selected standard, such as another person of their age or similar occupational level who they evaluated as being high in mastery motivation.
Despite these limitations, the DAMMQ appears to be a reliable and valid measure of mastery motivation for adults. Further development of the instrument could focus on reconsideration of the negatively worded items and those that were intended to assess the theorised dimensions of negative reactions to failure and perceived control. Confirmation of the factor structure in a new sample of adults who complete the 24-item form of the questionnaire is required. This sample should attempt to achieve better representation of males, older people, and those with lower levels of education, within a wider range of geographic locations and cultural contexts. Future work could also explore the instrument's longer-term stability and its predictive validity by evaluating the extent to which scores predict goal achievement. In addition, concurrent comparisons of DAMMQ self-reports with observations of performance on structured mastery tasks would be useful. Given the importance of the construct and the limited knowledge about mastery motivation beyond the years of childhood, the development of the DAMMQ represents a significant advance that we hope will stimulate and facilitate future research with adult populations.
Acknowledgments
None.
Financial Support
This research received no specific grant from any funding agency, commercial, or not-for-profit sectors.
Conflicts of Interest
None.
Ethical Standards
The authors assert that all procedures contributing to this work comply with the ethical standards of the relevant national and institutional committees on human experimentation and with the Helsinki Declaration of 1975, as revised in 2008.