1. Introduction
Intensification of livestock production is widely promoted as a strategy to meet the increasing demand for animal source foods and to improve the livelihoods of smallholder livestock farmers (Delgado et al., Reference Delgado, Rosegrant, Steinfeld, Ehui and Courbuis2000; Otte and Upton, Reference Otte, Upton, Rosati, Tewolde and Mosconi2005; Pica-Ciamarra, Reference Pica-Ciamarra2007). Intensification of livestock production is also seen as an important way of reducing the environmental impact of livestock, in particular in smallholder production systems (Steinfeld et al., Reference Steinfeld, Gerber, Wassenaar, Castel, Rosales and de Haan2006; Gerber et al., Reference Gerber, Steinfeld, Henderson, Mottet, Opio, Dijkman, Falcucci and Tempio2013). Various global studies suggest that intensification of livestock production will reduce emissions of greenhouse gasses (GHG) per unit of production (Steinfeld et al., Reference Steinfeld, Gerber, Wassenaar, Castel, Rosales and de Haan2006; Gerber et al., Reference Gerber, Steinfeld, Henderson, Mottet, Opio, Dijkman, Falcucci and Tempio2013). Intensification is also expected to reduce the pressure on land, resulting in less cultivation of natural areas and destruction of woodlands (Steinfeld et al., Reference Steinfeld, Gerber, Wassenaar, Castel, Rosales and de Haan2006).
In resource-poor environments, cross-breeding with breeds selected for high production has become a standard intensification approach for cattle husbandry. Field studies on the impact of intensification through cross-breeding have mainly been undertaken for dairy cattle. These studies showed that smallholder dairying using cross-breds resulted in economic gains for the households involved (McDermott et al., Reference McDermott, Staal, Freeman, Herrero and van de Steeg2010; Samdup et al., Reference Samdup, Udo, Ibrahim and van der Zijpp2010; Udo et al., Reference Udo, Aklilu, Phong, Bosma, Budisatria, Patil, Samdup and Bebe2011), although it was not feasible for really resource-poor households (Udo et al., Reference Udo, Aklilu, Phong, Bosma, Budisatria, Patil, Samdup and Bebe2011). Weiler et al. (Reference Weiler, Udo, Viets, Crane and de Boer2014) showed, however, that intensification of dairy farming does not necessarily lead to lower emissions per kilogram of milk produced. Consideration of how off-farm feed production contributes to environmental impact is particularly important. Production levels may be higher in more intensive production systems but more feed supplements are also being used.
Little is known about the impact of the intensification of beef cattle systems in smallholder settings on GHG emissions. Wall, Simm, and Moran, Reference Wall, Simm and Moran2009 and Scholtz et al. (Reference Scholtz, Steyn, Marle-Koster and Theron2012) suggest that genetic improvement and cross-breeding may be sustainable ways of reducing the carbon footprint of beef cattle, but no results from field studies support this hypothesis. Intensification will require increased use of inputs, which may offset any beneficial impact of increased production on the environmental impact per unit of production.
In Indonesia, cross-breeding with European breeds has been promoted as a strategy to intensify its beef production. It is implemented throughout the country, regardless of differences in agro-ecology, of which the variation in available feed resources is a main element (Widi et al., Reference Widi, Udo, Oldenbroek, Budisatria, Baliarti and van der Zijpp2015). About 90 percent of cattle in Indonesia are owned by smallholder farmers with fewer than five head of cattle per farm and about 0.1–0.4 ha of crop land. The population pressure in the main island Java means that all agricultural land is used for cropping. As a consequence, the cattle management systems are predominantly based on cut-and-carry (stall) feeding (Palte, Reference Palte1989).
In Java, cross-breeding is mainly practised by using Simmental semen on the local Ongole population (Widi et al., Reference Widi, Udo, Oldenbroek, Budisatria, Baliarti and van der Zijpp2015). Indonesian farmers, in common with smallholders in developing countries, keep cattle not only for meat production, but also for financial security, draught power, manure for cropping and social status (Widi, Reference Widi2004). Comparisons of cross-bred and Ongole cattle production systems in different agro-ecological zones in Central Java have shown that the reasons for keeping cattle are similar for both systems (Widi et al., Reference Widi, Udo, Oldenbroek, Budisatria, Baliarti and van der Zijpp2015). Reproductive performances were not different between the two types of breeding stock. But at comparable ages, cross-bred cows and progeny reached approximately 25 and 17 percent heavier body weights than Ongole cows and progeny. Cross-bred cattle fetched higher sale prices, but they were fed more supplementary feed (Widi et al., Reference Widi, Udo, Oldenbroek, Budisatria, Baliarti and van der Zijpp2015). Consequently, no differences in the gross margins from cattle keeping were observed between farms with Ongole cattle and farms with cross-bred cattle within the same agro-ecological zone (Widi et al., Reference Widi, Udo, Oldenbroek, Budisatria, Baliarti and van der Zijpp2015).
Is intensification through cross-breeding indeed beneficial for the environment? There is a lack of field studies to substantiate the claims about the environmental benefits of intensification. Life cycle assessment (LCA) is commonly used to assess the environmental impact of producing livestock products (de Vries and de Boer, Reference de Vries and de Boer2010; de Boer et al., Reference de Boer, Cederberg, Eady, Gollnow, Kristensen, Macleod, Meul, Phong, Thoma, Van der Werf and Zonderlaand-Thomassen2011). Environmental impacts from beef cattle production have mainly been estimated for intensive systems in Europe and America (Casey and Holden, Reference Casey and Holden2006; de Vries and de Boer, Reference de Vries and de Boer2010; Nguyen, Hermansen and Mogensen, Reference Nguyen, Hermansen and Mogensen2010). In such studies the impacts are generally expressed per unit of meat produced. In resource-poor cattle keeping systems, the different livelihood functions should be included when assessing impacts per unit of production and mitigation opportunities (Weiler et al., Reference Weiler, Udo, Viets, Crane and de Boer2014). This will not only give a more realistic picture of the impacts but will also reflect farmers’ realities when considering mitigation options. The objective of this study was to assess the environmental impact, in terms of GWP and land use, of Ongole and cross-bred beef cattle production systems in different agro-ecological zones in Central Java. This was achieved by applying the LCA methodology.
2. Materials and methods
2.1. Study areas
The study areas were situated in the southern part of Central Java. They represented two agro-ecological zones, the uplands and the lowlands, with three different rainfall patterns. Wet lowlands, wet uplands and dry uplands could be distinguished. The study areas differ in topography, soil types, soil fertility and agro-climatic conditions. Wet lowlands (lower than 100 m above sea level; annual rainfall of 2 400–3 000 mm; BPS, 2009) have fertile soils and are characterized by irrigated farming systems with paddy and maize as the main crops. Wet uplands (higher than 500 m above sea level with annual rainfall of 3 000–3 600 mm; BPS, 2009) also have fertile soils and are characterized by both irrigated and rain-fed farming systems, with paddy fields, horticulture and forest. Dry uplands (higher than 500 m above sea level) have less fertile soils and low annual rainfall (1 800–2 400 mm; BPS, 2009). This zone has rain-fed farming systems with mainly cassava and dry land paddy.
Wet lowlands were divided into wet lowlands I, located in Yogyakarta Province, where cross-breeding is broadly applied, and wet lowlands II, located in Central Java Province, where cross-breeding is less frequently applied. Wet lowlands II is a traditional breeding area of local cattle (Ongole, in Indonesia called Peranakan Ongole, PO). In this area, the local government allocated several districts (an administration unit within an area) for maintaining Ongole cattle.
All farms apply stall-feeding. The feed resources for cattle production are mainly cut native grasses and crop by-products. Rice straw is more frequently available in the lowlands than in the uplands. Supplementary feeds, such as wheat bran, fresh cassava, dried cassava, cassava waste, tofu (soybean curd) waste and soybean hulls are available locally. Cassava and legumes are available more frequently in the dry uplands. Rice bran is produced by the local milling factories. Compounded concentrates are usually produced by feed mill companies, which are located outside the study areas, particularly in areas where dairy farming is practised. Compounded concentrates are distributed to cooperatives and local shops selling farming supplies.
Most smallholder farmers in Central Java keep cattle for capital savings and additional income and to produce manure, which is beneficial for their crops. Farmers consider capital savings as security to be able to meet unexpected or large expenses. They consider income as the cash they receive from the sale of progeny (Widi et al., Reference Widi, Udo, Oldenbroek, Budisatria, Baliarti and van der Zijpp2015). They usually sell calves after weaning, which is around 7 months, until approximately 1 year of age. The smallholder farmers can be regarded as cattle breeders, they sell animals to traders and middle men. These intermediaries sell stock to other farmers, feedlots or butchers. Butchers either slaughter the animals immediately or fatten them for several months before slaughtering. The farmers store the manure in or close to the barns for several months and utilize all manure to fertilize soils for crop production.
2.2. Data collection
We sampled data from mixed farms owning cattle for 10 years or longer and owning at least one cow. In total, 252 farms were purposively selected, for monitoring inputs, outputs and on-farm resource flows: 56 (17 Ongole and 39 cross-bred) farms in wet lowlands I, 63 (31 Ongole and 32 cross-bred) farms in wet lowlands II, 59 (12 Ongole and 47 cross-bred) farms in wet uplands and 74 (30 Ongole and 44 cross-bred) farms in dry uplands (Widi et al., Reference Widi, Udo, Oldenbroek, Budisatria, Baliarti and van der Zijpp2015). Farmers could not distinguish subsequent cross-bred generations.
LCA calculations were based on the inputs and outputs of the cattle component of the study farms during the period from January 2011 until January 2012. Feed was the major input. Many different feeds were offered to the cattle. The feeds were categorized as fresh forages, dry forages and supplementary feeds. The proportions of the different fresh forages were estimated by separating the fresh forage into its components. Feed inputs were calculated based on farmers’ estimates and direct observation of the types and amounts of feeds offered to each individual animal during 1 year. The estimates of the types and amounts of fresh forages offered were recorded by farmers each day. Trained enumerators (n = 8) checked the farm recording once a month. Young animals, approximately 6–12 months, were fed only fresh forages, and it was assumed that they get a half portion compared with adult animals. The amounts of dry forages and supplementary feeds that were bought were estimated from the amounts purchased. These estimates were translated into kilograms of dry matter (DM) and crude protein (CP) intake per animal, applying the feed composition tables of Hartadi, Reksohadiprodjo and Tillman (Reference Hartadi, Reksohadiprodjo and Tillman2005) for feeds available in Central Java.
Weights of cows, other adult stock (e.g. bulls and heifers) and young stock were estimated by the enumerators by measuring the chest girth using a measurement tape that transformed the chest girth in centimetres into live weight in kilograms (developed by FHK Ogawa Seki Co. Ltd, Tokyo, Japan) (Widi et al., Reference Widi, Udo, Oldenbroek, Budisatria, Baliarti and van der Zijpp2015).
In the LCA procedures, the emissions were allocated to the relative economic values of the different functions. The measurement of economic values took place over a period of 1.5 years (January 2011–July 2012), to ensure that the participating farms produced young stock in that period. The first author recorded, through monthly visits to the sample farms, farmers’ inputs and outputs of cattle keeping during this period.
2.3. LCA procedures
An LCA is usually divided into four steps: goal and scope definition, inventory analysis, impact assessment and interpretation (ISO 14040, 1997; ISO 14041, 1998; ISO 14042, 2000 and ISO 14043, 2000). The first step of an LCA includes the definition of the system boundary, the “Functional Unit” (FU) to which environmental impacts are allocated, the method of allocation and the impact categories to be analysed.
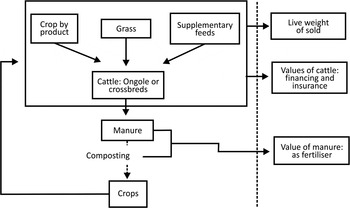
The system boundary of the LCA determines which processes of a production system shall be included within the LCA. The system boundary of the cattle component in Ongole and cross-bred farms is shown in Figure 1. We assessed all processes up to the farm-gate, including the cattle (enteric fermentation), cut-and-carry forages and supplementary feeds. Transportation of forages by trucks was only found in the dry uplands area. Emissions for manure were not assigned to the cattle component, as all manure was used for cropping (Figure 1).
System boundaries for the life cycle assessment (LCA) of local and cross-bred cattle production systems.

Given the system boundary, we computed the emissions of the main GHG: carbon dioxide (CO2), methane (CH4) and nitrous oxide (N2O). The method used to calculate GHG emissions from enteric fermentation was based on the intergovernmental panel on climate change (IPCC) good practice guidance, Tier 2 approach (IPCC, 2006). We considered emissions under the current production conditions. Global warming potential and land use were assigned to all the feeds offered to the cattle on the farms on a yearly basis. Ecoinvent data 2.2 allowed us to compute the GWP and land use for each feed ingredient (Ecoinvent 2.2, available at http://pre-sustanability.com). If recent yield data were not available in Ecoinvent 2.2, we used production data from the FAO statistical database, and computed GWP and land use per feed ingredient using Simapro7.3 (Simapro 7.3, available at http://pre-sustanability.com).
2.4. Allocation procedures
The FU in a LCA analysis should represent the main function of the analysed system. Because of the multi-functionality of cattle keeping in the study areas, two allocation approaches were used: (i) allocation to live weight of young stock produced in the farms, and (ii) allocation to live weight of young stock produced taking into account the other functions of cattle keeping. ISO 14044 (2006) provides guidelines on how to allocate the environmental impact of a process or production system in the case of multiple functions. In this study we used economic allocation, which implies the allocation of GWP and land use to the different functions based on their economic values. When crop by-products were used as feed, economic allocation was applied based on the economic value of the crop for human food consumption and the value of its by-products for animal feed.
2.5. Economic allocation to the different functions of cattle keeping
Live weight of young stock sold has a direct market value, whereas young stock not sold represent an opportunity value. The economic value of cattle as a means of finance and insurance and the use of manure as fertilizer can only be assessed indirectly.
The economic value of live weight produced was calculated as follows:
 $$L{C_k}:\,\,S{C_k} \times \hbox {head price}$$
where LC k is the total economic value of live weight produced during 1 year in Indonesian Rupiah (IDR), SC k is the number of cattle produced in one year (head) and head price is the cattle price (IDR), which is determined by body weight estimation.
The head prices of cattle sold were provided by the individual farmers. Village traders or middle men buy cattle from farmers. Prices are based on exterior appearance of the cattle. We interviewed farmers regarding the price of young stock produced at the farms. The opportunity values of weaners still present on the farms were based on estimates of the farmers or traders.
The economic value of manure used as fertilizer was estimated based on synthetic N fertiliser equivalents, in this case urea (CO(NH2)2), which was the common fertilizer that farmers used. The economic value of manure used was calculated as follows:
 $${\rm MANURE}:{N_{{\rm manure}}} \times \hbox{fertilizer price},$$
where, MANURE is the total economic value of manure used as fertilizer during 1 year (IDR), N manure is kilograms N in manure used as fertilizer and fertilizer price is economic value of N in urea (CO(NH2)2) expressed as (IDR/kg N). Manure production in terms of kilograms per day (kg d−1) of DM was calculated by multiplying the estimated weight of fresh manure produced per animal per day and the DM content of fresh manure. We assumed that an adult Ongole produces 15 kg d−1of fresh manure and an adult cross-bred 20 kg d−1 and young stock produces half of these amounts, and that the DM content is 15 percent (Pertiwinigrum, personal communication). We assumed that cattle manure has a N content of 1.7 percent, based on Moore and Gamroth (Reference Moore and Gamroth1993) and that 50 percent of N was lost during storage (Moore and Gamroth, Reference Moore and Gamroth1993). The price of fertilizer (urea) was estimated at 1 600 IDR per kilogram in 2011, and therefore we estimated the price of N at 3 478 IDR per kilogram (N content of urea is 46 percent, Hartadi, Reksohadiprodjo and Tillman (Reference Hartadi, Reksohadiprodjo and Tillman2005)).
Estimation of the intangible benefits of cattle was based on Bosman, Moll and Udo (Reference Bosman, Moll and Udo1997), Moll (Reference Moll2005) and Moll, Staal and Ibrahim (Reference Moll, Staal and Ibrahim2007). The intangible benefit from financing is related to not having to pay interest for borrowing money from a bank or an informal money lender when an animal is sold (Moll, Reference Moll2005; Moll, Staal and Ibrahim (Reference Moll, Staal and Ibrahim2007)). The benefit of financing was estimated as:
 $${F_k}:\,\,L{C_k} \times f$$
where F k is benefit of financing, LC k is total, economic value of live cattle sold in a farm in 1 year (IDR) and f is financing factor. The total economic value of live cattle sold, LC k , refers to the direct economic value of the cattle. The formal interest rate of credit in the study areas was 12 percent (Bank BNI Yogyakarta, 2013, personal communication).
Bosman, Moll and Udo (Reference Bosman, Moll and Udo1997) described the intangible insurance benefit of livestock as the economic value of the stock as insurance for the household, i.e. to pay premium in case of health insurance or another type of insurance. The intangible insurance benefit was estimated as:
 $${I_k}:\,\,S{F_k} \times s$$
where I k is insurance benefit, SF k is number of cattle on farm multiply by price per head (IDR), and s is insurance factor. The factor s was set at 9 percent (Asuransi Prudential – Yogyakarta, 2003, personal communication). This represents the human health insurance premium that would have to be paid for health insurance.
2.6. Impact assessment
The impact categories considered were GWP and land use. The carbon footprint, GWP in CO2-equivalents (CO2-eq) per kilogram animal product, is widely used to assess the climate change impact of cattle (Steinfeld et al., Reference Steinfeld, Gerber, Wassenaar, Castel, Rosales and de Haan2006; Gerber et al., Reference Gerber, Steinfeld, Henderson, Mottet, Opio, Dijkman, Falcucci and Tempio2013). In Java, land use is very much under pressure as almost all agricultural land is used for crop production. Grazing lands have disappeared and cattle are kept in a cut-and-carry management system. To assess the GWP of Ongole and cross-bred cattle farms, emissions of CO2, CH4 and N2O were summed based on their equivalence factors in terms of kilograms of CO2-equivalents: 1 for CO2, 25 for CH4 and 298 for N2O (IPCC, 2007). Land used for producing the different types of feed was expressed in square metres (m2) (Phong, de Boer and Udo, Reference Phong, de Boer and Udo2011). Interpretation of the results is based on the FU, live weight produced in the study period.
We compared the emission intensities and farm characteristics of the 25th percentile of Ongole farms, representing farms with lower emission intensities, with the emission intensities and farm management characteristics of all the other Ongole farms. The same analysis was conducted for cross-bred farms. This analysis was conducted to explore why some farms had lower emission intensities than others, analogous with Gerber et al. (Reference Gerber, Steinfeld, Henderson, Mottet, Opio, Dijkman, Falcucci and Tempio2013).
2.7. Data analysis
One-way ANOVA was performed to analyse the variation in GWP and land use per kilogram live weight produced among areas, with breed nested within areas (Ott and Longnecker, Reference Ott and Longnecker2010). The model was simplified to compare breeds within areas, because for most parameters no interaction was found between breed and area (Widi et al., Reference Widi, Udo, Oldenbroek, Budisatria, Baliarti and van der Zijpp2015).
3. Results
3.1. Characteristics of Ongole and cross-bred cattle farms
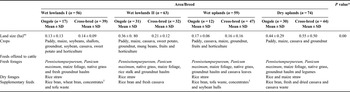
Table 1 presents the farm characteristics for the four study areas. Land size was not significantly different between the two types of farms within the four study areas. Most of the land was used for crop production. Farmers usually planted forages along the boundaries of their fields. Cut-and-carry feeding was practised in all study areas. Forages were collected from the fields, riversides, roadsides, forest edges and backyards. Supplementary feeds were offered irregularly. In wet lowlands II, rice bran was only offered during the rice harvesting period, because farmers utilized the by-product of their own harvested rice, whereas in the other areas rice bran was offered independent of the harvesting period.
Characteristics of farms with Ongole and cross-bred cattle in the four study areas in Central Java.

nsThere were no significant differences between breeds within area and in all areas (P < 0.05).
*P value for differences between areas.
1 Concentrate composition: rice bran, palm kernel meal, cassava meal, maize cob, molasses and urea.
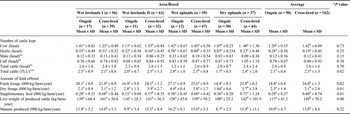
Table 2 presents the inventory results for cattle herds, feeding practices and manure estimates for Ongole and cross-bred farms. The total number of cattle did not differ between Ongole (2.4) and cross-bred (2.6) farms within the four study areas. The amounts of the different feed types fed differed significantly among areas. More fresh forages were fed on wet uplands farms than in the other three areas. More dry forages were fed on wet lowlands II and wet uplands farms than in the other two areas and less supplementary feeds were fed in wet lowlands II than in the other three areas. Overall, the amounts fed of fresh forages, dry forages and concentrates were significantly higher for cross-bred farms than for Ongole farms. In wet lowlands I the amount of fresh forages fed hardly differed between Ongole and cross-bred farms, but the amount of concentrates fed was significantly higher for cross-bred farms (680 kg per farm per year or cross-bred farms vs 280 kg for Ongole farms). Overall, live weight produced was also significantly higher for cross-bred farms (149 kg) than for Ongole farms (117 kg). In all areas, cross-bred farms produced more kilograms of live weight of young stock than Ongole farms, but the variation between farms was high, so the differences between breeds within areas were only significant in wet lowlands II.
Composition of the cattle herd, feeding practices and manure produced for Ongole and cross-bred farms in the four study areas in Central Java, January 2011–January 2012.

a,bDifferent superscripts indicate significant differences between breeds within area and in all areas (P < 0.05).
nsThere were no significant differences between breeds within area and in all areas (P < 0.05).
*P value for differences between areas.
1 TLU, Tropical livestock unit; adult cattle are equal to 1 cattle TLU and cattle younger than 1 year are equal to 0.6 cattle TLU (FAO, 2013).
3.2. Economic allocation of the multiple functions for Ongole and cross-bred cattle farms
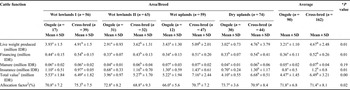
Cattle have multiple economic functions. Table 3 shows the relative contributions of the different functions that could be quantified. The biggest contribution was from live cattle produced; this accounted for 71.8 percent of total value for Ongole cattle and 71.4 percent for cross-bred cattle. The contribution of live weight produced was not significantly different (P < 0.05) between the two types of cattle farms within the different study areas. The insurance function of cattle comprised 18 percent of the total value of Ongole cattle, and 19 percent of the total value of cross-bred cattle. The additional two functions, which were quantified contributed little to the total value of cattle, an average contribution of 8.1 percent for financing and 1.1 percent for manure used as fertilizer.
Economic allocation of the multiple functions (IDR/year) and allocation factor (%) for Ongole and cross-bred farms in the four study areas in Central Java, January 2011–July 2012

IDR, Indonesian Rupiah.
a,bDifferent superscripts indicate significant differences between breeds within area and in all areas (P < 0.05).
*P value for differences between areas.
1 Total value = live weight produced + financing + manure + insurance.
2 Allocation factor = (live cattle sold/total value) × 100.
3.3. Global warming potential of Ongole and cross-bred cattle production systems
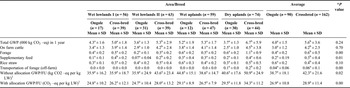
Table 4 shows the total GWP and the GWP per kilogram of live weight produced for the cattle component of the two farm types in the four study areas. Ongole farms tended to have a significantly lower GWP than cross-bred farms (4 000 vs 5 600 kg CO2-eq per year, P < 0.05). On average, 76 percent of GWP was due to methane emissions from enteric fermentation. The remaining 24 percent came from feeds and transport of forages. Use of fresh home-produced forages in cross-bred farms resulted in significantly higher GWP per farm compared with Ongole farms. Among areas, emissions from the use of forages were significantly higher in the dry uplands than in other areas (P < 0.05). Most of the forages in the dry uplands were native grasses.
Global warming potential (GWP) of Ongole and cross-bred cattle production systems in the four study areas in Central Java, January 2011–January 2012

FU, functional unit; LW, live weight.
a,bDifferent superscripts indicate significant differences between breeds within area and in all areas (P < 0.05).
nsThere were no significant differences between breeds within area and in all areas (P < 0.05).
*P value of differences between areas.
1 Without or with allocation to different livelihood functions.
Ongole and cross-bred cattle did not have a significantly different impact in terms of GWP per kilogram of live weight produced. When all the GWP was allocated to live weight produced, the average GWP per kilogram of live weight produced was 38.7 kg CO2-eq for Ongole farms and 42.3 kg CO2-eq for cross-bred farms. The GWP per kilogram of live weight based on economic allocation to the different functions of cattle averaged 26.9 kg CO2-eq for Ongole cattle farms and 28.9 kg CO2-eq for cross-bred farms (Table 4).
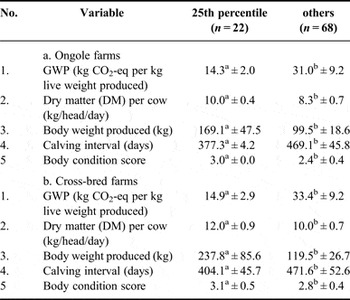
The 25th percentile of Ongole farms with the lowest emission intensities had a 46 percent lower GWP per kilogram live weight produced than the other farms (Table 5). The result for cross-bred farms was similar with 45 percent lower GWP per kilogram live weight. The 25th percentile of both farm types owned fewer animals (1.6 vs 2.1 for Ongole farms, and 1.6 vs 2.3 for cross-bred farms), but produced more kilograms of live weight (169 kg vs 100 kg for Ongole farms and 238 kg vs120 kg for cross-bred farms) (Table 5). The amount of feed offered per animal (kg DM/head per day) was higher for the 25th percentile of farms compared with all the other farms for Ongole farms (10.0 vs 8.3 kg d−1) and cross-bred farms (12.0 vs 10.0 kg d−1). Calving interval (days) was significantly shorter for the 25th percentile of farms than for the other farms for both Ongole farms (377 vs 469 days) and cross-bred farms (404 vs 472 days). Body condition scores for the 25th percentile of farms were also higher than on the other farms for both Ongole (3.0 vs 2.4) and cross-bred farms (3.1 vs 2.8).
Comparison of cattle management characteristics between the 25th percentile of farms with lowest Global warming potential (GWP) per kg live weight produced and all other farms for Ongole (a.) and cross-bred farms (b.), January 2011–January 2012.

a,bDifferent superscript indicates a significant difference between the 25th percentile and the other farms.
3.4. Land use in Ongole and cross-bred cattle production systems
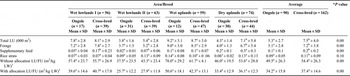
Table 6 shows the land use per farm and per kilogram live weight for the cattle component of Ongole and cross-bred farms in the four study areas. In all areas the land use (off-farm and on-farm land use) for the cattle component of Ongole cattle farms tended to be lower than for cross-bred cattle farms. In the wet lowlands II and dry uplands, this difference was significant (P < 0.05). Overall this parameter was also significantly lower (P < 0.05) for Ongole farms, 5 339 m2 compared with 7 467 m2 for cross-bred farms. Table 6 shows that nearly all of this land use (96 percent) was for fresh forage production. The land use for producing supplementary feeds (0.1 m2 for Ongole farms and 0.2 m2 for cross-bred farms) was significantly higher for cross-bred farms than for Ongole farms. The amount of land required to produce 1 kg of live weight was slightly higher for cross-bred cattle (37.4 m2) than for Ongole cattle (34.2 m2) (Table 6). Among areas, the wet lowlands I and wet uplands showed higher (P < 0.05) total land use and land use per kilogram live weight produced than the other two areas, both without and with economic allocation to the different livelihoods functions. More home-produced forage is used in these areas.
Land use (LU) of Ongole and cross-bred cattle production systems in the four study areas in Central Java, January 2011–January 2012

FU, functional unit; LW, live weight.
a,bDifferent superscripts indicate significant differences between breeds within area and in all areas (P < 0.05).
*P value of differences between areas.
1 Without or with allocation to different livelihood functions.
4. Discussion
4.1. Methodology: multi-functionality
In this study, the cattle were components of mixed farming systems and served multiple functions that were linked to each other. Including the various functions of cattle in our LCA calculations resulted in approximately 30 percent lower emissions per unit of live weight produced compared with the calculations in which multiple functions were not considered. The estimate for the insurance function of cattle was relatively small (approximately 20 percent) relative to the total value of cattle. This is in contrast with the finding of Widi et al. (Reference Widi, Udo, Oldenbroek, Budisatria, Baliarti and van der Zijpp2015) that farmers regarded “saving” as the most important motive for keeping cattle When farmers need cash for big expenses, they sell one of their cattle. It seems likely that our method of valuing the insurance function of cattle still underestimates the true value of this function of keeping cattle in Indonesia. The function of security will remain important in the future, as farmers regard cattle as an attractive way to accumulate capital (Widi et al., Reference Widi, Udo, Oldenbroek, Budisatria, Baliarti and van der Zijpp2015).
Farmers considered manure as the third most important motive for keeping cattle (Widi et al., Reference Widi, Udo, Oldenbroek, Budisatria, Baliarti and van der Zijpp2015). Our estimation of the economic value of manure (1.1 percent of the total economic value of cattle keeping) seems to underestimate its real value. This estimate was based only on the synthetic fertilizer N-equivalent and therefore excludes the P and K values of manure, and the positive effects of manure on soil organic matter and water-holding capacity (Hiernaux and Diawara, Reference Hiernaux and Diawara2014). Manure production will be valued higher in the future because farmers appreciate its effect on soil fertility and structure and because of the rising cost of fertilizers.
4.2. The effect of cross-breeding on GWP and land use
Global studies have estimated that emission intensities for beef are highest in developing regions, e.g. South Asia, sub-Saharan Africa, Latin America and the Caribbean, and East and Southeast Asia (Gerber et al., Reference Gerber, Steinfeld, Henderson, Mottet, Opio, Dijkman, Falcucci and Tempio2013). Gerber et al. (Reference Gerber, Steinfeld, Henderson, Mottet, Opio, Dijkman, Falcucci and Tempio2013) mention that the high emissions in these regions are largely caused by low feed digestibility (leading to higher enteric and manure emissions), poorer animal husbandry and lower slaughter weights (slow growth rates leading to more emissions per kilogram of meat produced), and higher age at slaughter (longer life leading to more emissions).
It is difficult to compare our results with the other studies in the literature because the FU differs. Our results are expressed as GWP per kilogram of live weight produced because the weaners were sold to other farmers as breeding stock or to feedlot companies for fattening. Other studies in the literature use a different FU, especially kilogram of carcass weight. Our estimates of 27–29 kg CO2-equivalents per kilogram of live weight are slightly higher compared with the estimate of 46 kg CO2-equivalents per kilogram carcass weight (equivalent to 23 kg CO2-eq per kilogram live weight at slaughter) in South Asia of Gerber et al. (Reference Gerber, Steinfeld, Henderson, Mottet, Opio, Dijkman, Falcucci and Tempio2013). Suckler beef systems in Ireland, UK and Canada have much lower emissions, ranging from 5.6 to11.2 kg CO2-equivalents per kilogram of live weight produced (de Vries and de Boer, Reference de Vries and de Boer2010).
The global call for the intensification of livestock production to improve productivity in order to reduce GHG emission intensities (Steinfeld et al., Reference Steinfeld, Gerber, Wassenaar, Castel, Rosales and de Haan2006; Herrero et al., Reference Herrero, Thornton, Notenbaert, Wood, Masangi, Freeman, Bossio, Dixon, Peters, van de Steeg, Lynam, Parthasarathy Rao, MacMillan, Gerard, McDermott, Sere and Rosegrant2010; Gerber et al., Reference Gerber, Steinfeld, Henderson, Mottet, Opio, Dijkman, Falcucci and Tempio2013) is not supported by the results of our field research on the environmental impact of cross-breeding in mixed farming systems of Central Java. The postulated paradigm that breeding strategies, such as cross-breeding, can reduce the carbon footprint of cattle production (Scholtz et al., Reference Scholtz, Steyn, Marle-Koster and Theron2012) is not straightforward in complex mixed farming systems. In our case, intensification through cross-breeding resulted in increased production: 25 percent higher body weights for adult cross-bred cows and 14–19 percent higher body weights for weaners compared with local Ongole cattle (Widi et al., Reference Widi, Udo, Oldenbroek, Budisatria, Baliarti and van der Zijpp2015). However there were no differences in GWP per kilogram live weight produced between local Ongole and cross-bred cattle production systems. Cross-breds required more feed; they were fed more forages, which were collected from the farm and communal sources or bought, and more supplementary feeds, such as rice bran, pollard, compound concentrates, tofu (soybean curd) waste, and soybean hulls (Table 2). We did not measure feed efficiencies (Net Feed Intake: feed intake compared with theoretical feed use) of cross-bred and Ongole animals, but feed intake estimates (Widi et al., Reference Widi, Udo, Oldenbroek, Budisatria, Baliarti and van der Zijpp2015) indicated that DM and CP intakes per kg metabolic body weight were higher for cross-breds than for Ongole cows. In Australia, progeny of Brahman (Bos indicus) cows bred by British (Bos taurus) sire breeds were the least efficient in feed use, whereas purebred Brahmans were the most efficient (Moore, Johnston and Burrow, Reference Moore, Johnston and Burrow2015). Cross-breds showed faster growth rates, but may be feed efficiency of Ongole stock was better. The advantage from the faster growth of cross-breds in terms of reduced GWP per kilogram live weight produced is counteracted by the higher emissions from feed production for cross-breds. Thus the expectation was that local breeds in the local production systems would have higher emissions per unit product than “improved” breeds, in this case cross-bred of Ongole and Simmental cattle, was not substantiated.
Cross-breeding did not result in lower land use. The Ongole and cross-bred beef cattle farms in the study areas had the same land use, approximately 36 m2 per kilogram of live weight produced. Forages contributed the most to total land use. The use of supplementary feeds was low. Crop by-products, such as rice bran and maize cobs, have a low value. Therefore only a small fraction of land use for crops is allocated to crop by-products for beef production.
Cross-breeding is not done in a systematic way; Simmental semen is used irrespective of the cross-bred generation of the female animals. The majority of cross-bred farmers keep F 1 stock, however, this is gradually changing towards F 2 stock. Farmers do not prefer to upgrade to higher levels of Simmental (Widi et al., Reference Widi, Udo, Oldenbroek, Budisatria, Baliarti and van der Zijpp2015). The current cross-breeding practices have not improved the environmental performance of cattle production in Central Java. However, our estimates do not include the impact of cross-breeding on the final fattening stage. This fattening is often done by butchers, large scale farmers (>50 heads) or feedlots (>1 000 heads). Their feeding practices are comparable with those of the smallholders in the present study. The only component in the cross-breeding strategy is the use of exotic semen. Farmers do not receive any assistance in feeding and breeding management. Thus, cross-breeding has not changed the farming systems in the study areas; herd sizes and management practices did not differ between farms with cross-bred or Ongole breeding stock. Cross-breeding has also not affected the motives for keeping cattle, which were similar between Ongole and cross-bred cattle farms (Widi et al., Reference Widi, Udo, Oldenbroek, Budisatria, Baliarti and van der Zijpp2015).
Increasing animal productivity requires both better quality and greater quantities of feed (Steinfeld et al., Reference Steinfeld, Gerber, Wassenaar, Castel, Rosales and de Haan2006; Gerber et al., Reference Gerber, Steinfeld, Henderson, Mottet, Opio, Dijkman, Falcucci and Tempio2013). Growing more feed crops might conflict with other land uses, given the limited availability of land in Java. A current regulation stipulates that farmers are not allowed to plant non-food crops on productive lands (Setneg, Reference Setneg1999). Farmers do not have sufficient cash to buy more forages and supplements. These constraints suggest that there is little scope to increase the quality and quantity of feed. Nevertheless, there is large heterogeneity among farmers; the coefficients of variation for the overall emission intensities and land use are approximately 40–45 percent. The driving force behind the differences between farmers is the difference in kilograms of live weight produced. The 25th percentiles of Ongole and cross-bred farms with the lowest GWP per kilogram live weight produced fed their animals more in terms of DM compared with other farms. They also had lower calving intervals and higher body condition scores for their cows, indicating that they managed their animals in a more efficient way (Table 4).
4.3. Conservation of genetic resources and the relation with emissions and land use
In Indonesia, the policy of cross-breeding and the increasing demand for meat are putting considerable pressure on local farm animal genetic resources. Policies that promote cross-breeding run concurrently with more recent policies promoting breeding programmes for local cattle (Widi et al., Reference Widi, Udo, Oldenbroek, Budisatria, Baliarti and van der Zijpp2015). This paradox is also found in the international literature. There is a large global literature on livestock biodiversity and the need for conserving local farm animal genetic resources (Hall, Reference Hall2004; FAO, Reference Rischkowsky and Pilling2007, 2010a). On the other hand, the global literature considers local ruminant breeds as less efficient in their potential for mitigating GHG emissions than improved breeds. Local ruminant breeds are expected to have higher emission intensities than improved breeds as they are usually fed roughages and crop residues only, and have low outputs (Steinfeld et al., Reference Steinfeld, Gerber, Wassenaar, Castel, Rosales and de Haan2006; FAO, 2010b). Hoffmann (Reference Hoffman2010) expressed concern that the pressure to reduce GHG emissions from ruminants may disadvantage local breeds. In two of the study areas, wet lowlands II and dry uplands, the local government has started a “Return to Ongole” breeding programme. Our results indicate that the promotion of local breeds does not necessarily conflict with efforts to reduce the intensity of GHG emissions from cattle keeping in mixed farms in Java.
5. Conclusions
Cross-breeding (as a tool for intensification) was not more efficient in mitigating GHG emissions and reducing land use per kilogram of live weight produced than local breeds in the current smallholder farming systems in Central Java. The biggest contribution to GWP was from enteric fermentation, which is closely related to the low quality of feeds available. The advantage from the faster growth of cross-breds in terms of GWP and land use per kilogram live weight produced was counteracted by the higher emissions from feed production for cross-breds.
Cross-breeding has not changed current cattle keeping practices. Only exotic semen is provided; sustainable cross-breeding will require assistance in terms of feeding and breeding management. This could improve environmental performance, as the farms with lower emission intensities had, on average, lower calving intervals and higher body condition scores.
Acknowledgements
The first author was supported by a PhD grant from Directorate General of Higher Education (DGHE), Ministry of Research, Technology and Higher Education, Republic Indonesia. The first author acknowledges the support of Universitas Gadjah Mada and Animal Production Systems Group, Wageningen University, The Netherlands, staff members of Livestock Bureaus in Yogyakarta and Central Java Provinces, and farmers in the four study areas. The first author would also like to thank the undergraduate students for their support and assistance in collecting the data. The comments of an anonymous reviewer were highly appreciated. Last but not least, the first author would like to thank Dr William Thorpe and Natasha van Vliet for their valuable and constructive comments.
Statement of interest
The work reported in this manuscript is not being considered for scientific publication elsewhere. The authors declare that there are no conflicts of interest related to this manuscript.