Introduction
The importance of beech forests for forest biodiversity conservation in Central Europe has recently been highlighted by several studies (Müller et al., Reference Müller, Brunet, Brin, Bouget, Brustel, Bussler, Förster, Isacsson, Köhler, Lachat and Gossner2013; Lachat et al., Reference Lachat, Wermelinger, Gossner, Bussler, Isacsson and Müller2012; Gossner et al., Reference Gossner, Lachat, Brunet, Isacsoon, Bouget, Brustel, Brandl, Weisser and Müller2013). Within beech forest biodiversity, deadwood-associated (saproxylic) species account for about 25% of the total species richness occurring in temperate and boreal forest ecosystems (Siitonen, Reference Siitonen2001; Stokland et al., Reference Stokland, Tomter, Söderberg and Marchetti2004). This high proportion makes them challenging candidates for forest biodiversity monitoring. However, the species-rich saproxylic group is often seen as a response group in forest ecology. Furthermore, this group is known to be highly sensitive to forest management and has consequently become threatened (Nieto & Alexander, Reference Nieto and Alexander2010). Furthermore, saproxylic organisms may be used to discriminate old-growth forests from managed ones (Siitonen & Saaristo, Reference Siitonen and Saaristo2000), or as indicators for different forestry regimes (Davies et al., Reference Davies, Tyler, Stewart and Pullin2008).
Among the saproxylic organisms, beetles account for more than 20% of the species diversity (Stokland et al., Reference Stokland, Tomter, Söderberg and Marchetti2004) and are often used as a relevant indicators of forest management impacts for convenience and practical reasons. Monitoring saproxylic beetle diversity has three main objectives: (i) forest site ranking, i.e., sorting sites according to their biodiversity level, and to identify relevant conservation sites (Timonen et al., Reference Timonen, Siitonen, Gustafsson, Kotiaho, Stokland, Svedrup-Thygeson and Mönkkönen2010), (ii) identifying environmental structural drivers of forest biodiversity (Bouget et al., Reference Bouget, Larrieu and Brin2014) in order to establish efficient conservation measures and management guidelines, and (iii) assessing the impacts of forest management on biodiversity (Davies et al., Reference Davies, Tyler, Stewart and Pullin2008).
The monitoring of species assemblages is nonetheless costly, mainly due to difficult and time-consuming species identification (Müller & Brandl, Reference Müller and Brandl2009). High resolution analyses require informative long-time and costly datasets. The importance of data quality in saproxylic ecological studies has already been highlighted (Parmain et al., Reference Parmain, Dufrêne, Brin and Bouget2013). Several strategies are available to simplify the study of saproxylic species assemblages, especially to reduce the time spent on identification. These strategies imply the identification of specimens (i) at a morphospecies level (Obrist & Duelli, Reference Obrist and Duelli2010), (ii) a supra-species level (e.g., genus level), or (iii) at the species level for only a species subset (indicators – Schmidl & Bussler, Reference Schmidl and Bussler2004) or selected families or species (monitoring species – Müller & Gossner, Reference Müller and Gossner2010).
Morphospecies, instead of species, have been used in order to reduce identification cost, but this seems more efficient for butterflies and spiders (Derraik et al., Reference Derraik, Closs, Dickinson, Sirvid, Barratt and Patrick2002) than for beetles (Olivier & Beattie, Reference Olivier and Beattie1996). Supra-species monitoring, also called ‘taxonomy sufficiency’, is widely used to rapidly assess changes in biodiversity (Beattie & Olivier, Reference Beattie and Olivier1994), but it does not allow researchers to determine fine-scale changes (Williams & Gaston, Reference Williams and Gaston1994) nor can multivariate analyses be computed (Terlizzi et al., Reference Terlizzi, Bevilacqua, Fraschetti and Boreo2003). Species subsets may be easier, cheaper and faster to study than the entire target group (Williams & Gaston, Reference Williams and Gaston1994), but relevant subsets able to predict overall species richness are difficult to identify. Within the saproxylic beetle group, the explanatory power of several species subsets have already been tested, such as easy-to-identify (Sebek et al., Reference Sebek, Barnouin, Brin, Brustel, Dufrêne, Gosselin, Meriguet, Micas, Noblecourt, Rose, Velle and Bouget2012) or red-listed species (Timonen et al., Reference Timonen, Siitonen, Gustafsson, Kotiaho, Stokland, Svedrup-Thygeson and Mönkkönen2010; Lachat et al., Reference Lachat, Wermelinger, Gossner, Bussler, Isacsson and Müller2012). A near-full set of species can be quickly obtained while excluding the families whose identification is very time-consuming or taxonomically complicated (Kennedy & Jacoby, Reference Kennedy and Jacoby1997). Family exclusion is therefore a frequently used procedure in beetle studies (Grove, Reference Grove2002; Ohsawa, Reference Ohsawa2007; Bouget et al., Reference Bouget, Larrieu and Brin2014). Most of the excluded families are taxonomically complicated and their biology is not well known. Among saproxylic beetle families, some are nearly always kept for analyses (Cerambycidae, Elateridae, Cetoniidae) whereas others are often excluded from mass-trapping samples to exclude doubtful data (Cryptophagus and Atomaria genera in Cryptophagidae, Epuraea in Nitidulidae, Latridiidae and Staphylinidae, especially Aleocharinae). Sebek et al. (Reference Sebek, Barnouin, Brin, Brustel, Dufrêne, Gosselin, Meriguet, Micas, Noblecourt, Rose, Velle and Bouget2012) explored the surrogate ability of several saproxylic beetle families, either individually or in combination, to estimate total species richness per trap. However, rove beetles (Staphylinidae) were not available in the beetle dataset they used.
The rove beetle family is one of the most species-rich saproxylic beetle families (just behind longhorn beetles. Supplementary Material). Today, staphylinid taxonomy is in effervescence worldwide, with many new species being described (Brunke et al., Reference Brunke, Klimaszewski and Anderson2012). On the other hand, it is also one of the most frequently excluded taxa. In some forest environments, staphylinids are one of the most abundant and species-rich families in trapped saproxylic beetle assemblages (Alinvi et al., Reference Alinvi, Ball, Danell, Hjältén and Pettersson2007; Müller et al., Reference Müller, Bussler and Kneib2008). In addition to their hyper-diversity (they are the most species-rich saproxylic sub-family in western Europe), Staphylinidae are hard to identify for the following reasons: (i) there are very few specialized taxonomical experts (Kim & Byrne, Reference Kim and Byrne2006); (ii) identification keys and books are difficult to keep up to date due to the quickly evolving taxonomy (though recent publications (Löbl & Smetana, Reference Löbl and Smetana2004; Assing & Schülke, Reference Assing and Schülke2011) have updated the previous identification tools (Lohse, Reference Lohse, Freude, Harde and Lohse1964; Lohse et al., Reference Lohse, Benick, Likovsky, Freude, Harde and Lohse1974) for Central Europe (excluding, however, some species-rich sub-families such as Aleocharinae, Pselaphinae and Scydmaeninae); (iii) identification requires the analysis of internal genitalia, i.e., the Aleocharinae, (Schmidl & Bussler, Reference Schmidl and Bussler2004; Bouget et al., Reference Bouget, Brustel and Zagatti2008; Stokland & Meyke, Reference Stokland and Meyke2008); and (iv) the few specialists are rapidly overwhelmed by the huge quantities of samples related to large-scale sampling designs (Langor et al., Reference Langor, Spence, Hammond, James, Cobb, Grove and Hanula2006).
These reasons all indicate that excluding Staphylinidae from forest biodiversity samples may save time and money and make saproxylic beetle datasets more rapidly available for analysis. Nonetheless, the effects of such an exclusion on the results in ecological studies must be evaluated.
Using a large-scale dataset compiled in European beech forests (Müller et al., Reference Müller, Brunet, Brin, Bouget, Brustel, Bussler, Förster, Isacsson, Köhler, Lachat and Gossner2013), we addressed the following main questions:
Do saproxylic beetle assemblages with and without staphylinids congruently respond to ecological (landscape, macroclimatic and local) gradients? How do the species richness and composition of assemblages with and without staphylinids co-vary?
In addition, we analyzed this secondary issue:
Is the response of staphylinid-restricted assemblages to ecological gradients well reflected by the response of staphylinid-excluded assemblages?
Material and methods
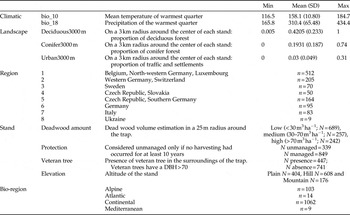
We compiled saproxylic beetle data obtained during various projects and corresponding to a total of 1188 flight-interception traps in 238 forest stands dominated by European Beech (>50% beech cover) on 85 sites in nine different countries (see Supplementary Material) from Sweden to Switzerland and the Ukraine (Carpathians). All traps were cross-vane flight-interception traps made up of transparent plastic windows, with total interception area comprised between 0.6 and 1 m2.
Ecological gradients and environmental data
For the purpose of this study, forest conditions were surveyed at the following levels (see Gossner et al., Reference Gossner, Lachat, Brunet, Isacsoon, Bouget, Brustel, Brandl, Weisser and Müller2013, for details):
-
(i) Landscape characteristics (see table 1) (3-km radius around the center of each stand) were assessed according to the European-wide land-cover mapping project CORINE (http://www.corine.dfd.dlr.de), which uses satellite remote-sensing images at a scale of 1:100,000. Land-use information includes 44 categories, which were used to calculate the following variables (table 1): the proportion of deciduous forest, the proportion of conifer stands relative to the extent of forest and the proportion of traffic and settlements. For Switzerland, the variables were taken from www.swisstopo.admin.ch; for Ukraine, the variables were estimated from Google Earth aerial photos.
-
(ii) Climate variables (see table 1) were extracted from the WorldClim database with a resolution of 30 s and calculated as a mean value within a 1-km radius; a larger radius would have led to inaccurate values for sites in rough terrain (Hijmans et al., Reference Hijmans, Cameron, Parra, Jones and Jarvis2005). We selected mean temperature and precipitation of warmest quarter as ecologically meaningful variables for the life cycle of beetles. In addition, we included trap elevation.
-
(iii) Stand conditions (see table 1) were defined according to three parameters: the estimated deadwood amount in three levels (low (<30 m3 ha−1; N=689), medium (30–70 m3 ha−1; N=257), high (>70 m3 ha−1; N=242)), the protection status (managed versus unmanaged; a stand was considered unmanaged only if harvesting had been absent for at least 10 years), and the occurrence of veteran trees in the trap surroundings (presence versus absence).
Description of variables (macro-climate, stand, region and landscape) explored in the study. See Gossner et al. (Reference Gossner, Lachat, Brunet, Isacsoon, Bouget, Brustel, Brandl, Weisser and Müller2013) for further details.

Beetle data
Beetles were identified to the species level by taxonomic experts, and only saproxylic species were considered for our analyses. We classified beetles as saproxylic following Schmidl & Bussler (Reference Schmidl and Bussler2004) and Köhler (Reference Köhler2010).
We defined three types of species assemblage: (i) with Staphylinidae only (staphylinid-restricted), (ii) with all species except for Staphylinidae (staphylinid-excluded), and (iii) with all species including Staphylinidae (staphylinid-included).
We distinguished three levels of Staphylinidae species richness per trap: low (staphylinid species accounted for <10% of total trap richness; N=466)), medium (staphylinid richness=10–25% of total richness; N=521)) and high (>25% of the species were Staphylinidae, N=201).
Analyses
Most analyses were carried out at the trap level. The European dataset was divided into eight regions, defined by hierarchical cluster analysis (HCA) of between-trap Euclidian distance matrices between geographical coordinates (vegdist function, lme4 package (Bates et al., Reference Bates, Maechler, Bolker and Walker2014)) (Supplementary Material). These geographical clusters were included in our models as random spatial effects.
The correlations between staphylinid-restricted/staphylinid-excluded and staphylinid-included/staphylinid-excluded species richness were calculated with Spearman correlation tests.
We also analyzed the effects of staphylinid exclusion on site ranking, based on species richness. We ranked forest sites (regional scale) and stands (local scale) according to the species richness of staphylinid-included or staphylinid-excluded assemblages. We used the ‘min’ method in the rank R function to manage ties (ex-aequos). At both spatial scales (forest n=85 and stand n=238), we computed the mean absolute value of rank differences (standardized by sample size) and the total percentage of congruent rankings (±5% ranking error). After ranking, we also quantified how much the top-ten forests (or sites, or stands) diverge using staphylinidae-excluded or -included species richness values.
Contributions of environmental variables (climate, landscape and stand variables; table 1) to variations in species richness (rarefied by abundance) between staphylinid-restricted/staphylinid-excluded and staphylinid-included/staphylinid-excluded assemblages were analyzed in Linear Mixed Models, with country, forest site and stand as spatially-implicit random effects on the intercept (glmer function in lme4 (Bates et al., Reference Bates, Maechler, Bolker and Walker2014)).
Compositional differences between staphylinid-restricted/staphylinid-excluded and staphylinid-included/staphylinid-excluded assemblages were analyzed using spatially-constrained Mantel tests (method=‘pearson’, permutation=999, strata=region). To rank the effect of several variables on variations in species composition (including singletons), we performed a canonical analysis of principal coordinates (CAP) (vegan R-package, Anderson & Willis, Reference Anderson and Willis2003) with ‘forest’ as a constrained factor. Based on Jaccard distance matrices, we carried out inertia partitioning on all explanatory environmental variables, since co-linearity among predictor variables is not considered to be a problem in CAP. We calculated the marginal (intrinsic) inertia explained by each variable (with all other variables partialled out before analysis), the latter's statistical significance (permutation tests – 199 runs), and the relative contribution of each set of variables to marginal inertia.
All analyses were conducted with R 3.0.1 (R Core Team, 2013).
Results
Our compiled dataset included 552,651 individuals and 936 saproxylic beetle species. Staphylinidae was the most species-rich family (145 species). These 145 staphylinid species account for about 16% of the cumulated richness and 14% of the mean richness per trap. The contribution of rove beetles to the mean species richness per trap was not different in managed or in unmanaged stands, in deciduous- or in conifer-dominated forests, in deadwood-poor or in deadwood-rich stands, and in lowland or in mountain forests (for details, see Supplementary Material).
-
(1) Staphylinid-included versus staphylinid-excluded assemblages
Alpha diversity and stand ranking
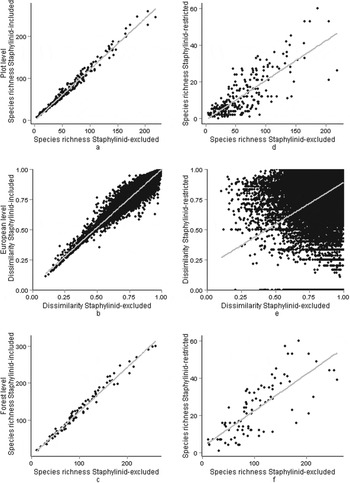
At the stand level, the Spearman correlation value between species richness in staphylinid-included versus staphylinid-excluded assemblages was very high (rho=0.99; fig. 1a). The ten most species-rich stands were consistent between staphylinid-included and staphylinid-excluded assemblages for nine out of ten stands. The stand ranking based on staphylinid-excluded data gave a similar result compared with staphylinid-included data in more than 75% of the cases, considering a 5% ranking error; respectively 77 and 79% of the cases in managed and unmanaged stands. The mean value of rank difference between staphylinid-included and staphylinid-excluded ranking standardized by sample size was 0.03, both in managed and unmanaged stands. The Mantel correlation value between staphylinid-included and staphylinid-excluded dissimilarity matrices was high and significant (r=0.98, P<0.001; fig. 1b).
a; b; c: correlation between staphylinid-included and staphylinid-excluded data. d; e; f: correlations between staphylinid-restricted and staphylinid-excluded data.

Gamma diversity and site ranking
At the forest site level, species richness in staphylinid-included and staphylinid-excluded assemblages was strongly correlated (Spearman rho=0.99; fig. 1c). The identification of the ten most species-rich sites in our dataset was similar with staphylinid-excluded data compared with staphylinid-included data in more than 75% of the cases (with an accepted 5% ranking error). In the Top10 sites given by the ranking of staphylinid-excluded assemblages, eight were also among the Top10 based on staphylinid-included data. The mean value of rank difference between staphylinid-included and staphylinid-excluded data ranking, standardized by sample size, was 0.03.
Environmental drivers of variations in species richness
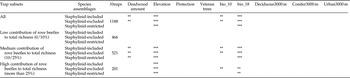
Whether staphylinid-included or -excluded datasets were used, the influence of structural variables on species richness was consistent. Furthermore, the proportion of variance explained by fixed factors (for significant factors only, R 2) was slightly higher for staphylinid-excluded data (Supplementary Material). The level of staphylinid richness per trap did slightly influence the response of beetle species richness to environmental parameters. In the dataset restricted to traps with low or medium staphylinid richness, the effects of stand, climatic and landscape variables on species richness per trap were always consistent between staphylinid-included and staphylinid-excluded assemblages. However, in the case of traps with high staphylinid richness, the effect of the climatic variable, mean temperature of the warmest quarter, was significant on the staphylinid-excluded assemblage, but not on the whole assemblage.
Environmental drivers of variations in species composition
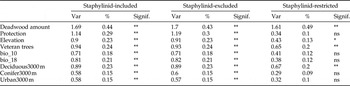
From the CAP results, a uniform and significant response of the intrinsic contributions to inertia of selected variables was observed with both the staphylinid-included and the staphylinid-excluded species assemblages. Deadwood amount was the most powerful explanatory variable (table 3).
-
(2) Response of staphylinid-restricted assemblages
At the stand level, the Spearman correlation value between species richness in staphylinid-restricted versus staphylinid-excluded assemblages was lower than the staphylinid-included/staphylinid-excluded correlation but remained significant (rho=0.74; fig. 1d). The Mantel correlation value was low but still significant between staphylinid-restricted and staphylinid-excluded distance matrices (r=0.18, P<0.001; fig. 1e). At the forest site level, species richness values were less correlated in staphylinid-restricted versus staphylinid-excluded assemblages (rho=0.78; fig. 1f) than in staphylinid-included versus staphylinid-excluded assemblages.
Environmental drivers of variations in species richness
The effects of stand, climatic and landscape variables on species richness per trap were not always consistent between staphylinid-restricted and staphylinid-excluded assemblages (table 2). Deadwood amount and mean temperature of the warmest quarter had a significant effect on species richness per trap in the staphylinid-excluded data, whereas they did not significantly affect the species richness per trap in the staphylinid-restricted data.
Response in species richness of staphylinid-included, staphylinid-excluded and staphylinid-restricted assemblages to macro-climate, stand and landscape variables, analyzed using a Generalized Linear Mixed Model with a Gaussian error distribution, and forest site and stand as spatial random effects.

Only significant responses were displayed (***P<0.001, ** 0.01>P>0.001, * 0.05>P>0.01). bio_10, mean temperature of the warmest quarter; bio_18, precipitation of the warmest quarter; Deciduous3000 m, proportion of deciduous forest in a 3 km-radius buffer; Conifer3000 m, proportion of conifer forest in a 3 km-radius buffer; Urban3000 m, proportion of traffic and settlements in a 3 km-radius buffer; Ntraps, number of traps in each Trap subset.
Environmental drivers of assemblage variations
In comparison with staphylinid-excluded assemblages, staphylinid-restricted assemblages were far less influenced by selected environmental variables: five out of nine predictors did not have a significant intrinsic contribution to inertia (table 3). Unlike staphylinid-excluded assemblages, staphylinid-restricted assemblages were not significantly influenced by management treatment by a surrounding landscape cover of conifer-dominated forests or by bio-climatic variables (table 3). Like staphylinid-excluded assemblages, staphylinid-restricted assemblages were affected by a surrounding landscape cover of deciduous-dominated forests, by local deadwood amount and by local occurrence of veteran trees. As for staphylinid-excluded assemblages, deadwood amount had the most important intrinsic contribution to inertia.
CAP used to partition the variation in the response species-plot matrix with respect to the combination of explanatory variables (macro-climate, stand and landscape). Only the intrinsic contribution to inertia of each variable is displayed.

Signif. codes: ***P<0.001, ** 0.01>P>0.001, * 0.05>P>0.01, ns P>0.05
Mean temperature and deadwood amount did significantly affect the species richness of staphylinid-excluded assemblages, but not of staphylinid-restricted assemblages.
Discussion
To include or exclude staphylinids?
In beech-dominated forests, the contribution of rove beetles to the species richness of saproxylic beetle assemblages was important on average, and particularly so in managed stands, in deciduous-dominated landscapes, in deadwood-poor forests and in lowlands. This shows the important role rove beetles should play in biodiversity monitoring in managed forests at low altitudes; however, these types of forests are not currently the focus of much recent research (e.g., Carnus et al., Reference Carnus, Parrotta, Brockerhoff, Arbez, Jactel, Kremer and Walters2006). These findings clearly support the interest of our study on the impact on ecological results of taking into account this species-rich family or not.
From our evaluation of the effects of Staphylinidae family exclusion on results in ecological studies, we can infer that simplified staphylinid-excluded assemblages are relevant surrogates for whole assemblages. The species richness and composition of assemblages with or without staphylinids consistently co-varied. At the stand and forest site levels, the species richness values of the total assemblage and the staphylinid-excluded assemblage were highly positively correlated. Ranking procedures, with and without Staphylinidae included in species richness, gave consistent and similar results at both local and regional scales. The congruency of stand ranking using the whole or the staphylinid-excluded data for species richness calculations was the same in unmanaged and in managed stands. Moreover, the distance matrices based on both types of assemblages also strongly correlated. Indeed, species richness and composition of saproxylic beetle assemblages, with or without staphylinids, congruently responded to landscape, climatic and stand gradients. The staphylinid-included and the staphylinid-excluded assemblages were generally influenced by similar environmental drivers (deadwood amount, temperature, and elevation), with a greater part of variance explained for staphylinid-excluded assemblages. Therefore, the difference in R 2 between models based on staphylinid-included or excluded datasets was low, and we cannot draw conclusions on this point.
Overall, excluding Staphylinidae from saproxylic beetle assemblages did not lead to irrelevant estimations at local or regional scales, contrary to analyses based on data from poorly replicated designs (Parmain et al., Reference Parmain, Dufrêne, Brin and Bouget2013). Olivier & Beattie (Reference Olivier and Beattie1996) obtained similar identical rankings between sites with a simplified morphospecies approach compared with a detailed species inventory.
Staphylinids as a target group?
Since rove beetle species are numerous, easily caught in window-flight traps in various forest conditions, the Staphylinidae family could legitimately be suggested as a potential surrogate group reflecting saproxylic beetles as a whole. Indeed, they are often used in other types of monitoring (e.g., pitfall traps; Buse & Good, Reference Buse and Good1993). Nevertheless, according to our results in European beech forests, the response of staphylinid-restricted assemblages to rough ecological gradients did not reflect the response of other saproxylic beetle families, though at the stand and the forest site levels, their species richness was significantly correlated. While investigating the surrogate power of four other single saproxylic beetle families, Sebek et al. (Reference Sebek, Barnouin, Brin, Brustel, Dufrêne, Gosselin, Meriguet, Micas, Noblecourt, Rose, Velle and Bouget2012) observed the highest correlation between within-family and total richness for Cerambycidae (rho=0.50). In our study, we found higher correlation values for Staphylinidae (rho=0.68). However, the environmental drivers of species richness and composition of staphylinid-excluded or staphylinid-restricted assemblages differed. Moreover, the distance matrices based on the two types of assemblages converged only slightly.
Even though Bohac (Reference Bohac1999) proposed the use of rove beetle assemblages as bio-indicators for human land use in semi-natural and urban areas, we do not recommend their use as indicators of saproxylic assemblages in a forest context.
Perspectives
We studied saproxylic beetle assemblages only in terms of species richness and composition. Further approaches could focus on the guild structure and the conservation interest of the community. Such research would need to confront the lack of knowledge on rove beetle biology and rarity status. Furthermore, the data that do exist indicate that staphylinid species that have been recorded as predators specialists are probably more opportunistic than was predicted (e.g., Horák et al., Reference Horák, Chobot, Gabriš, Jelínek, Konvička, Krejčík and Sabol2011). Furthermore, as alluded to in the introduction, many staphylinid species have undescribed larvae and the females of several species are not distinguishable from other species (e.g., Scaphisoma sp.). Staphylinidae are known to have large ecological niches (Bohac, Reference Bohac1999); most of them live in highly variable environments as generalist predators in soil litter or as parasitoids of Dipteran pupae (i.e., Aleocharinae). Their detailed ecological requirements and association to deadwood microhabitats, as well as their rarity status and distribution patterns remain poorly known for many species. Falsely identified saproxylic staphylinid species may therefore weaken, disturb or, in the worst case, invert the relationships pattern between species and environmental conditions. Further ecological and taxonomical research on Staphylinidae is thus urgently needed.
The saproxylic beetle group is family-rich, with more than 70 families in France alone (Bouget et al., Reference Bouget, Brustel and Zagatti2008). Beetle families other than Staphylinidae may also be time-consuming to identify, and are sometimes excluded from assemblage analyses. These neglected families may concern key feeding groups of specialized species, such as Ciidae, a fungus-eating species, or they may include threatened and often regionally red-listed species such as Aderidae. Their exclusion may lead to biases in the identification of conservation sites and in functional community analyses. The costs and benefits of family exclusion versus exhaustiveness in beetle biodiversity assessment – especially rapid biodiversity assessments (Sebek et al., Reference Sebek, Barnouin, Brin, Brustel, Dufrêne, Gosselin, Meriguet, Micas, Noblecourt, Rose, Velle and Bouget2012) – should be further investigated. Finally, our study was based only on European beech forests, and it would be informative to conduct similar analyses in differing forest settings, for instance in European temperate oak forests or in conifer-dominated boreal forests.
The supplementary material for this article can be found at http://www.journals.cambridge.org/BER
ACKNOWLEDGEMENTS
We are grateful to Y. Paillet, B. Nusillard, C. Moliard (Irstea), T. Noblecourt, T. Barnouin, F. Soldati (ONF), F. Köhler, U. Bense, L. Zapponi, H. Bussler, and all the local forest managers for their field and laboratory work, to F. Gosselin (Irstea) for helpful comments on statistical analyses, L. Cizek and J. Schlaghamerský for helpful comments on a previous draft of the paper, and to Vicki Moore who checked the English language. We are undebtfull to two anonymous reviewers for their helpful comments. Data collection in Italy was supported by the LIFE project ManFor C.BD. (LIFE09 ENV/IT/000078). This study was partly supported by CIGA ČZU 20144302 ‘Managed forests in lowlands and their potential from the perspective of two distinct taxa – beetles and birds’.