

1. Introduction
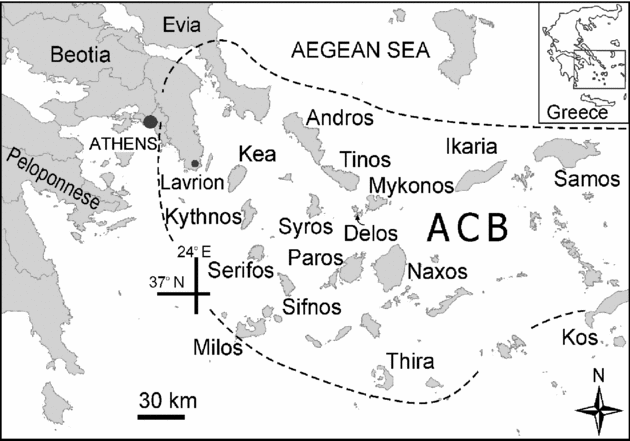
The SE part of Attica (Greece) (Fig. 1), known also as the ‘Lavrion area’ or the ‘Lavreotiki peninsula’, has been famous for mining and processing of argentiferous ore since the 10th century bc and for the production of silver and lead contributing to the economic development of ancient Athens during the classic era. Lavrion has attracted the interest of mineral collectors and has become a site of great importance for studies in the fields of industrial archaeology and the environmental impact of old mining and metallurgical activities. The geology and metallogeny of Lavrion were studied by Marinos & Petrascheck (Reference Marinos and Petrascheck1956). During the following years only a little geological work was carried out in the area on structures and petrology of regionally metamorphosed rocks and on the igneous rocks (Kessel, Reference Kessel1990; Papanikolaou & Syskakis, Reference Papanikolaou and Syskakis1991; Baltatzis, Reference Baltatzis1996; Altherr & Siebel, Reference Altherr and Siebel2002), in comparison to the neighbouring Cycladic islands, which have been extensively studied. These igneous rocks in SE Attica are the most westerly occurrence of a series of Middle to Late Miocene plutons and hypabyssal rocks in the Attic–Cycladic belt that were emplaced following the peak of Barrovian metamorphism during widespread extension and mid-crustal detachment (Buick, Reference Buick1991; Gautier & Brun, Reference Gautier and Brun1994). The aim of this paper is to present new data on the geology, age and petrology of the igneous rocks occurring in the Basal Unit, in an attempt to interpret the geodynamic setting of these Late Miocene intrusive rocks of the area.
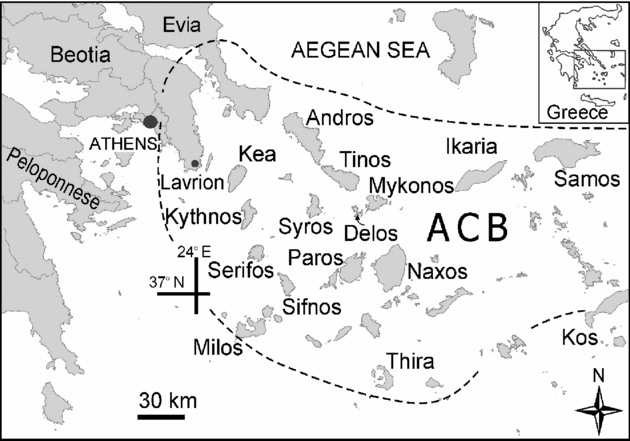
Geographic map of the south Aegean region indicating the extent of the Attic–Cycladic Belt (ACB) and locations discussed in the text.
2. Regional setting
The area of Lavrion forms part of the Attic–Cycladic belt (Fig. 1), which belongs to the central Hellenides and is composed of a stacked sequence of nappes mainly emplaced in the Early Eocene (Dürr et al. Reference Dürr, Altherr, Keller, Okrusch, Seidel, Cloos, Roeder and Schmidt1978). In the Attic–Cycladic belt four major tectonostratigraphic units can be distinguished:
(a) The Basal Unit (para-autochthon) represents a remnant of a carbonate platform of Late Triassic to Late Cretaceous age, overlain by Tertiary anchimetamorphic flysch (e.g. Dubois & Bignot, Reference Dubois and Bignot1979; Minoux, Bonneau & Kienast, Reference Minoux, Bonneau and Kienast1980; Avigad & Garfunkel, Reference Avigad and Garfunkel1989). Glaucophane relics and Si-rich phengites in the metaflysch indicate that the para-autochthon underwent high-pressure/low-temperature metamorphism (Shaked, Avigad & Garfunkel, Reference Shaked, Avigad and Garfunkel2000). Rb–Sr dating on high-Si-phengite from mica-rich metapelites yielded ages of c. 23 Ma (Ring & Reischmann, Reference Ring and Reischmann2002). These dates along with similar Rb–Sr dates on high-Si-phengite from the Basal Unit on Tinos (Bröcker & Franz, Reference Bröcker and Franz1998) and 40Ar/39Ar dates from Samos (Ring, Layer & Reischmann, Reference Ring, Layer and Reischmann2001) were interpreted by Ring & Reischmann (Reference Ring and Reischmann2002) as the age of the high-pressure metamorphism. Bröcker et al. (Reference Bröcker, Bieling, Hacker and Gans2004) instead suggested that this age constrains the timing of the greenschist-facies overprint.
(b) The Lower Unit, dominating in the central Aegean, comprises mainly Carboniferous basement orthogneisses and post-Carboniferous volcano-sedimentary sequences of interbedded metabasites, marbles and metapelites affected by eclogite- to blueschist-facies metamorphism during the Eocene (e.g. Altherr et al. Reference Altherr, Schliestedt, Okrusch, Seidel, Kreuzer, Harre, Lenz, Wendt and Wagner1979; Okrusch & Bröcker, Reference Okrusch and Bröcker1990; Trotet, Vidal & Jolivet, Reference Trotet, Vidal and Jolivet2001). Cretaceous zircon SHRIMP 206Pb–238U ages from an eclogite (S. Keay, unpub. Ph.D. thesis, Australian National Univ. 1998) and similar results from meta-igneous lithologies from Syros (Tomaschek et al. Reference Tomaschek, Kennedy, Villa, Lagos and Ballhaus2003) were related to the presence of an inherited magmatic component, whereas zircon rims yielding Eocene ages were interpreted to date high-pressure metamorphism. Cretaceous U–Pb ages of zircons from high-pressure rocks from Tinos and Syros reported by Bröcker & Enders (Reference Bröcker and Enders1999) and Bröcker & Keasling (Reference Bröcker and Keasling2006) were interpreted as reflecting hydrothermal or metasomatic processes in a subduction zone environment, indicating that the Cycladic blueschist belt recorded both Cretaceous and Eocene high-pressure episodes.
The high-pressure metamorphic event was a consequence of Alpine orogenesis during Cretaceous to Eocene subduction of the Apulian microplate beneath Eurasia (Dürr et al. Reference Dürr, Altherr, Keller, Okrusch, Seidel, Cloos, Roeder and Schmidt1978). High-pressure rocks were partly overprinted by Miocene (25–16 Ma) greenschist- to amphibolite-facies metamorphism during exhumation (e.g. Altherr et al. Reference Altherr, Kreuzer, Wendt, Lenz, Wagner, Keller, Harre and Hohndorf1982; Bröcker et al. Reference Bröcker, Kreuzer, Matthews and Okrusch1993; Avigad et al. Reference Avigad, Garfunkel, Jolivet and Azanon1997; Parra, Vidal & Jolivet, Reference Parra, Vidal and Jolivet2002). In the southern Cyclades (Naxos, Paros), the overprint culminated in anatectic processes (e.g. Altherr et al. Reference Altherr, Schliestedt, Okrusch, Seidel, Kreuzer, Harre, Lenz, Wendt and Wagner1979, Reference Altherr and Siebel1982; Wijbrans & McDougall, Reference Wijbrans and McDougall1988).
(c) The Upper Unit, which tectonically overlies the Lower Unit, consists of both non-metamorphic Late Permian to Middle Triassic volcaniclastic rocks, Late Triassic–Jurassic carbonate rocks and remnants of Eo-Hellenic ophiolites transgressively covered by Late Cretaceous carbonates, and various sequences of Late Cretaceous high-temperature/low-pressure metamorphic rocks (e.g. Reinecke et al. Reference Reinecke, Altherr, Hartung, Hatzipanagiotou, Kreuzer, Harre, Klein, Keller, Geenen and Böger1982; Papanikolaou, Reference Papanikolaou and Helgeson1987; Altherr et al. Reference Altherr, Kreuzer, Lenz, Wendt, Harre and Dürr1994). The HT–LP metamorphic rocks comprise mainly orthogneisses, amphibolites and a dismembered ophiolite (Katzir et al. Reference Katzir, Matthews, Garfunkel, Schliestedt and Avigad1996).
(d) Early to Late Miocene shallow marine to continental sediments overlie the Cycladic Blueschist Unit or the ductile shear zones of granitoids (Dermitzakis & Papanikolaou, Reference Dermitzakis and Papanikolaou1980; Böger, Reference Böger1983; Dürr & Altherr, Reference Dürr and Altherr1979; Sánchez-Gómez, Avigad & Heimann, Reference Sánchez-Gómez, Avigad and Heimann2002). They were deposited in half-graben basins formed during the Aegean back-arc extension (Gautier & Brun, Reference Gautier and Brun1994).
Late orogenic extension overprinted the stacked nappes. Studies on metamorphic core-complexes in the Cyclades have suggested that back-arc extension began at least in Early Miocene times, when the Eocene eclogites and blueschist rocks underwent the greenschist- to amphibolite-facies metamorphism. Large-scale extension in the Aegean was achieved by low-angle normal faults, which caused exhumation of ductile basement rocks to surface levels (e.g. Lister, Banga & Feenstra, Reference Lister, Banga and Feenstra1984; Gautier & Brun, Reference Gautier and Brun1994; Avigad et al. Reference Avigad, Garfunkel, Jolivet and Azanon1997; Jolivet et al. Reference Jolivet, Faccenna, Goffé, Burov and Acard2003; Ring & Layer, Reference Ring and Layer2003).
Miocene extension in the Attic–Cycladic belt was accompanied by the emplacement of I- and S-type granitoid magmas. Numerous granitoids intruded the Cycladic realm between 15 and 9 Ma (Altherr et al. Reference Altherr, Kreuzer, Wendt, Lenz, Wagner, Keller, Harre and Hohndorf1982; Skarpelis, Kyriakopoulos & Villa, Reference Skarpelis, Kyriakopoulos and Villa1992; Pe-Piper, Piper & Matarangas, Reference Pe-Piper, Piper and Matarangas2002) and in places caused contact metamorphism of the surrounding rocks and development of skarns and skarn-type mineralization (Salemink, Reference Salemink1985; Skarpelis & Liati, Reference Skarpelis, Liati and Hardy1990; Bröcker & Franz, Reference Bröcker and Franz1994). Emplacement of the numerous plutons in the Cycladic metamorphic complex was synchronous with extensional detachment faulting (e.g. Lister, Banga & Feenstra, Reference Lister, Banga and Feenstra1984; Buick, Reference Buick1991). Magma locally pierced the detachments and/or suffered syn-extensional shearing (Altherr et al. Reference Altherr, Kreuzer, Wendt, Lenz, Wagner, Keller, Harre and Hohndorf1982; Faure, Bonneau & Pons, Reference Faure, Bonneau and Pons1991; Lee & Lister, Reference Lee and Lister1992). Most Miocene plutons of the central Aegean are classified as I type. Monzonitic to monzogranitic intrusive rocks are exposed in the ENE (Kos, Samos), granites in the centre and south (Tinos, Mykonos, Naxos, Delos, Ikaria, Thera) and granodiorites in the WNW (Serifos, Lavrion) (Altherr et al. Reference Altherr, Henjes-Kunst, Matthews, Friedrichsen and Hansen1988; Altherr & Siebel, Reference Altherr and Siebel2002). The present South Aegean Volcanic Arc is located to the southern part of the Cyclades and mimics the southward retreat of the subduction zone.
3. Geology of Lavrion area
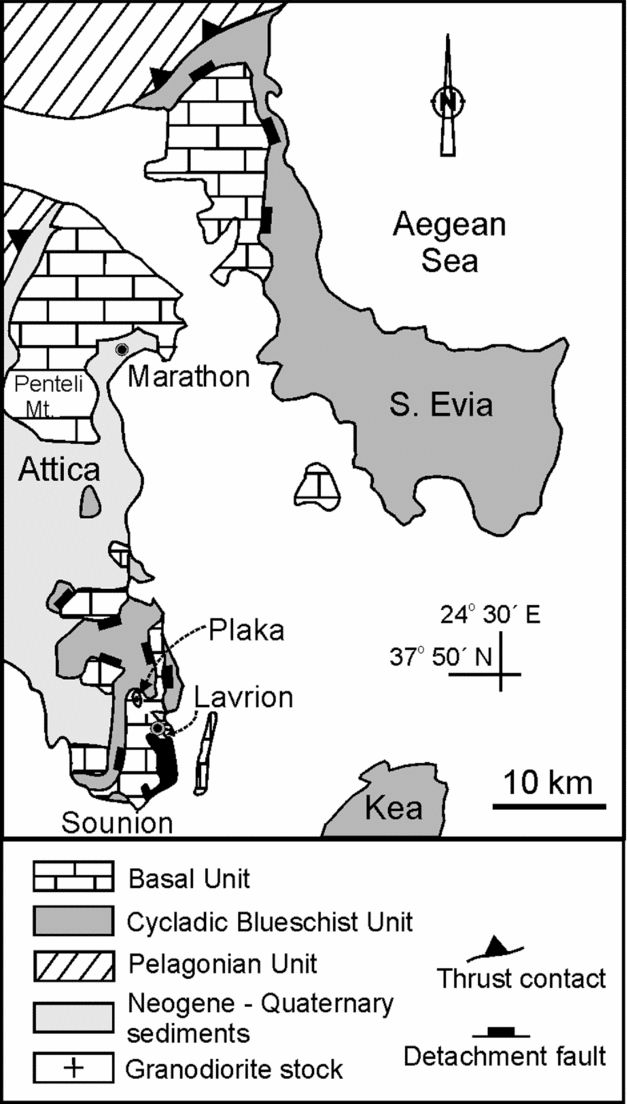
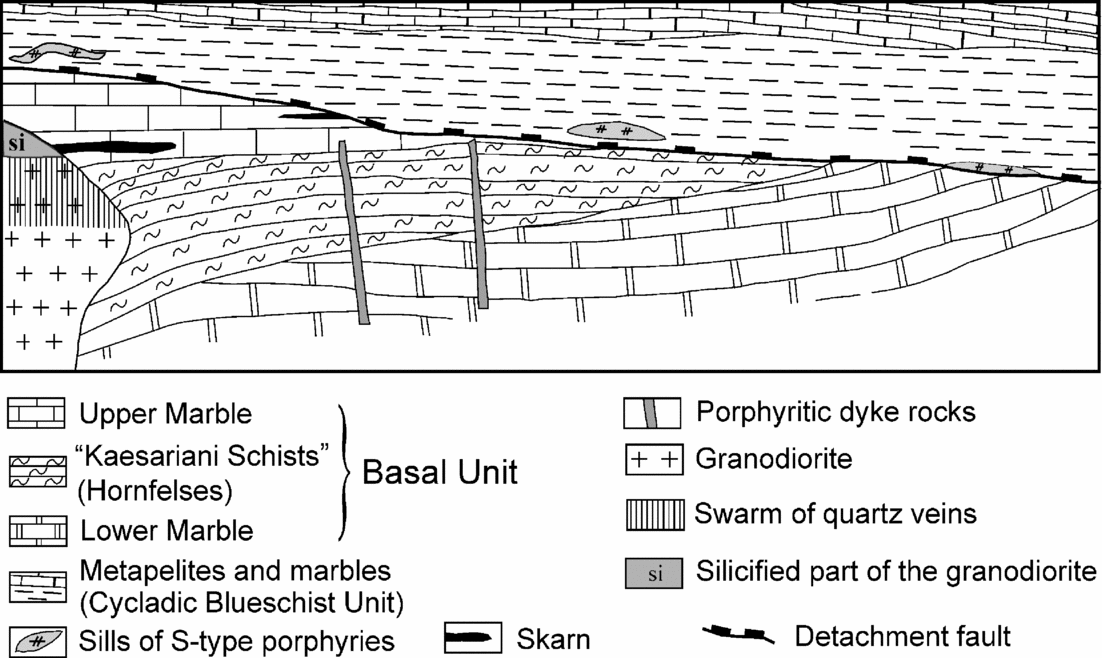
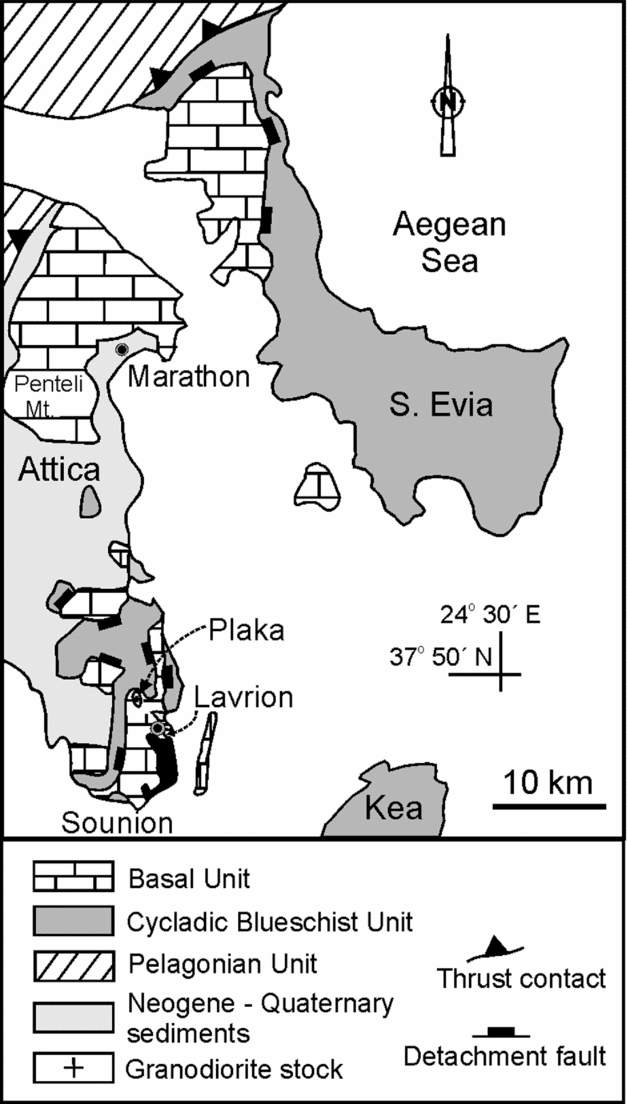
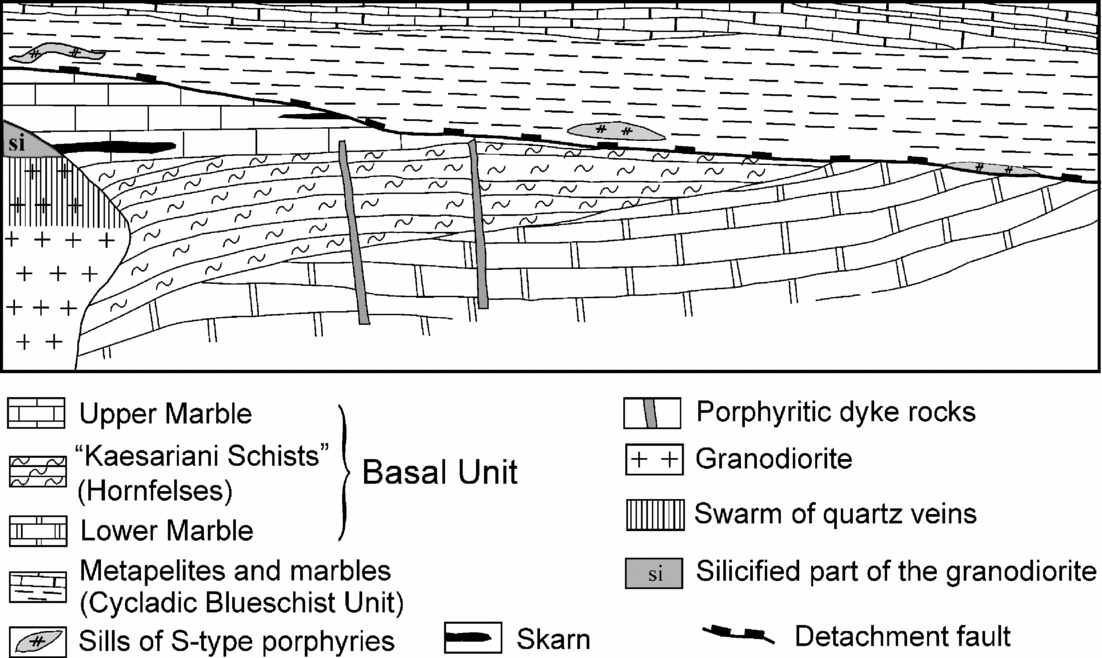
In the Lavrion area, the tectonostratigraphy consists of two units: the ‘Basal Unit’ (para-autochthon) and the ‘Blueschist Unit’ (allochthon), which is a part of the Cycladic Blueschist Unit. A detachment fault separates the Basal from the Blueschist Unit (Figs 2, 3, 4). The original contact between the two units was a thrust plane (Marinos & Petrascheck, Reference Marinos and Petrascheck1956; Kessel, Reference Kessel1990), developed during the Eocene or Oligocene compression of the Cyclades. The Basal Unit comprises metaclastic rocks with intercalations of carbonates (‘Kaesariani schists’) sandwiched between mylonitized marbles (‘Upper’ and ‘Lower’ marbles). Fossils within the ‘Basal Unit’ indicate a Late Triassic–Early Jurassic age (Marinos & Petrascheck, Reference Marinos and Petrascheck1956). Elsewhere in Attica and in southern Evia, the para-autochthon (referred to as ‘Almyropotamos–Attica Unit’ by Katsikatsos et al. Reference Katsikatsos, Migiros, Triantafyllis and Mettos1986) is composed mainly of a thick sequence of Triassic–Jurassic to Late Cretaceous marbles with schist intercalations (Marinos & Petrascheck, Reference Marinos and Petrascheck1956; Katsikatsos, Reference Katsikatsos and Kallergis1977). Occurrence of high-Si phengite in metapelites from Attica indicates that they underwent a high-pressure metamorphism (Baziotis, Mposkos & Perdikatsis, Reference Baziotis, Mposkos and Perdikatsis2006). Metamorphosed igneous rocks, bearing high-silica phengite, occur within the metaclastic subunit of the ‘Basal Unit’ in the Lavrion area. An Early Miocene age can be assumed for the regional metamorphism of the ‘Basal Unit’ at Lavrion by analogy with dated rocks in the ‘Almyropotamos Unit’ in south Evia (Ring & Reischmann, Reference Ring and Reischmann2002; Ring & Layer, Reference Ring and Layer2003).
Simplified geological map of eastern Attica and south Evia island (modified after Marinos & Petrascheck, Reference Marinos and Petrascheck1956; Katsikatsos et al. Reference Katsikatsos, Migiros, Triantafyllis and Mettos1986 and Shaked, Avigad & Garfunkel, 2000).
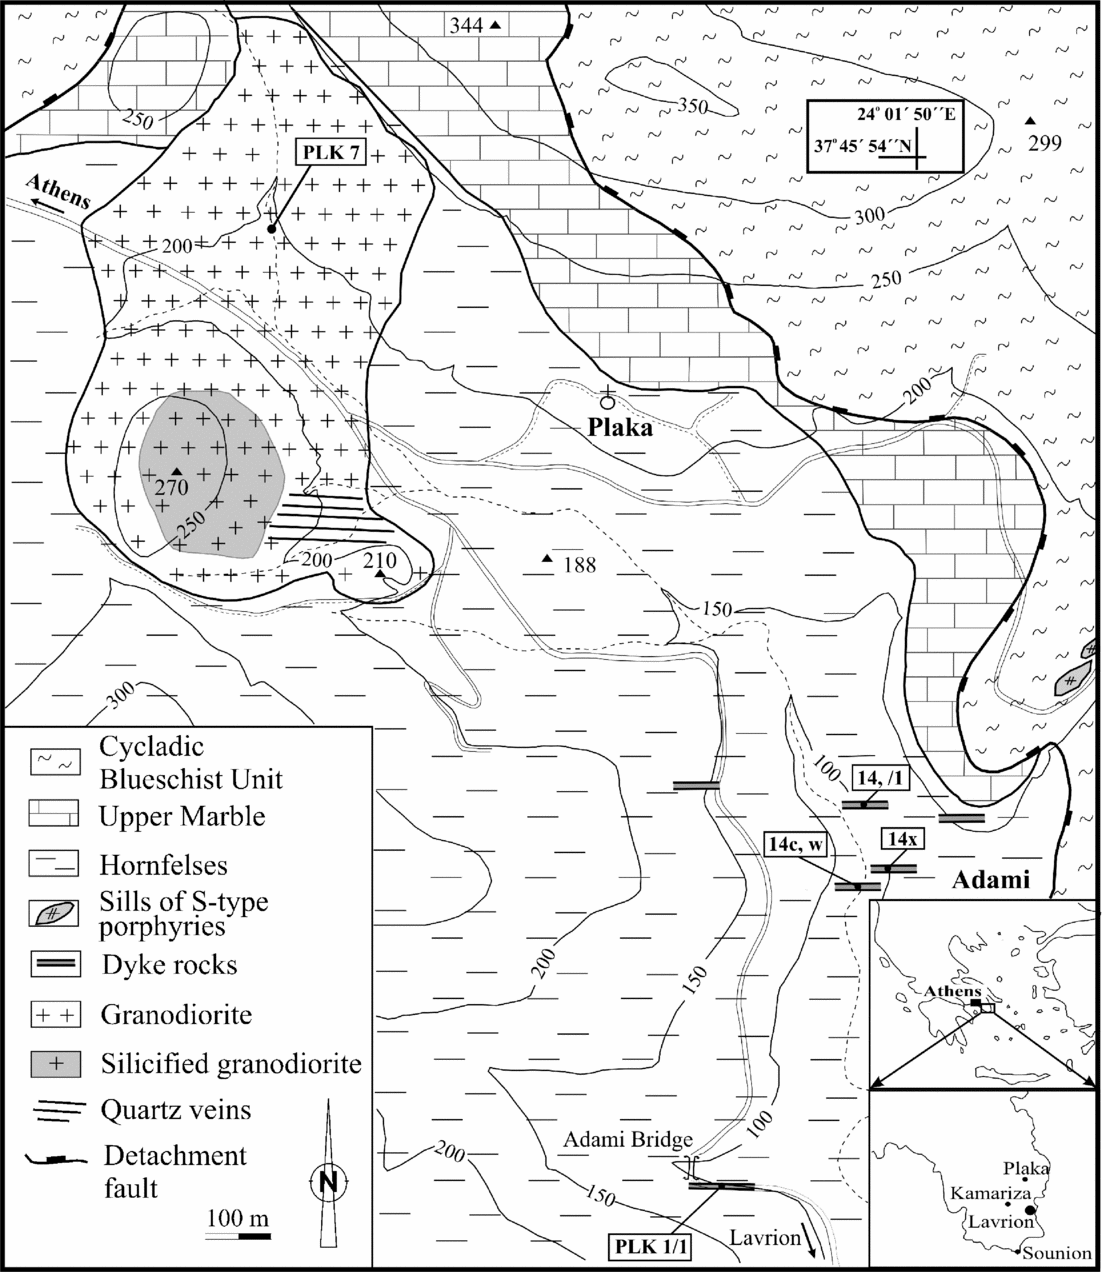
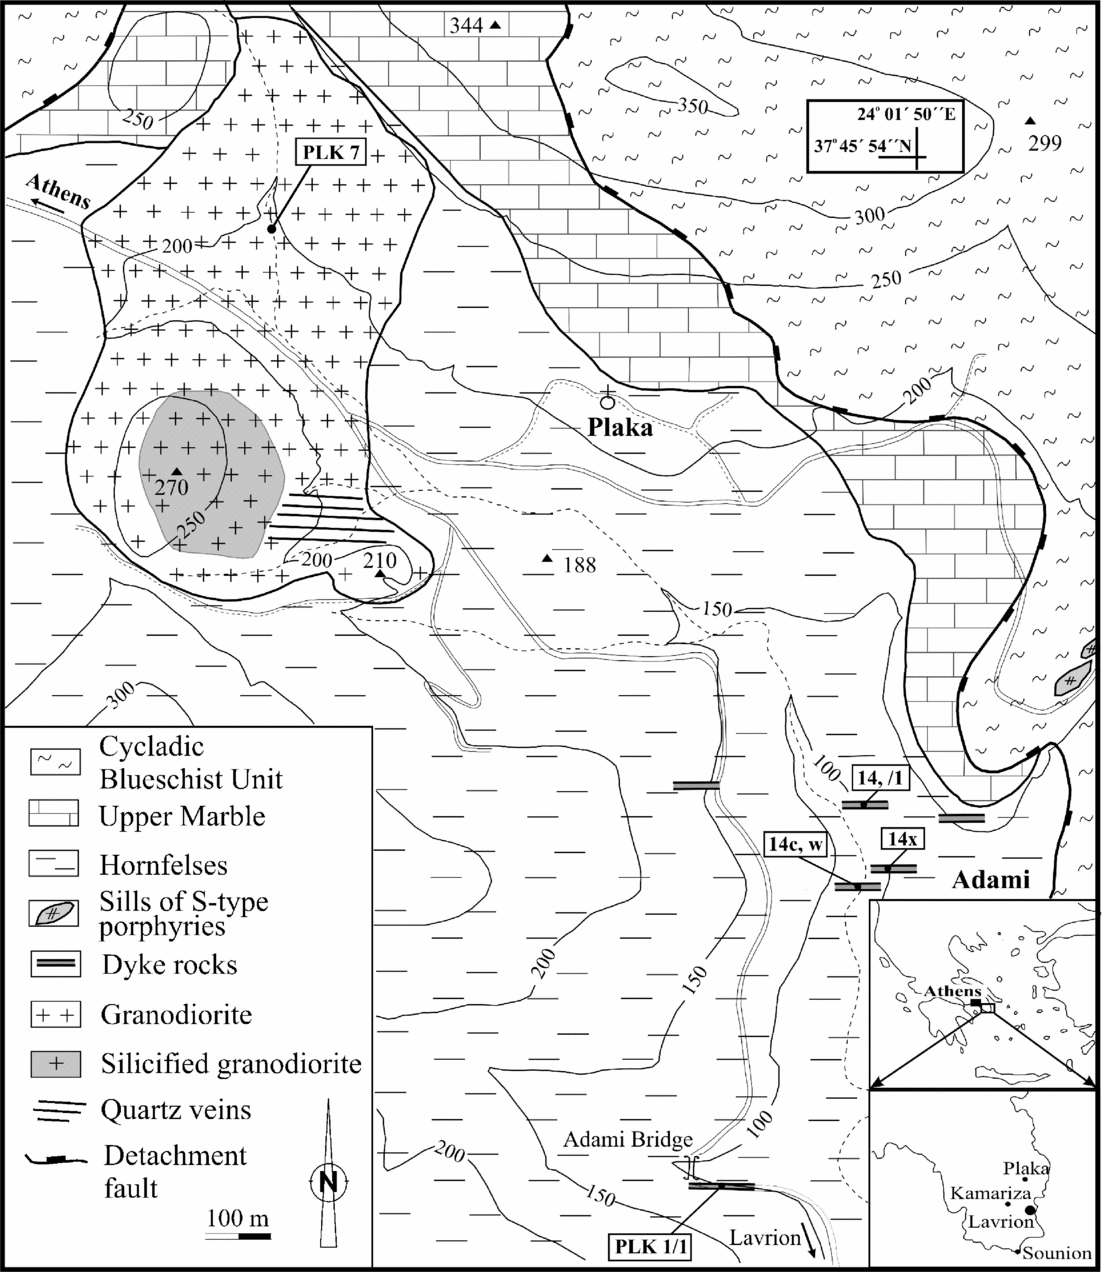
Geological map of Plaka area (thickness and length of dykes not to scale).
Schematic, roughly NNW–SSE-oriented, tectonostratigraphic section showing the setting of the Miocene intrusive rocks in the Basal Unit and the sills of S-type porphyries (west Plaka area).
The ‘Blueschist Unit’ comprises high-pressure/low-temperature metapelites, metasandstones, marbles, metabasic rocks and minor quartzite. Sills of hydrothermally altered S-type porphyritic granitoid rock occur within metapelites along or close to the detachment fault. Research on the petrology of these rocks is in progress. An Eocene age for the peak of the high-pressure/low-temperature metamorphism was postulated (Altherr et al. Reference Altherr, Kreuzer, Wendt, Lenz, Wagner, Keller, Harre and Hohndorf1982; Ring & Layer, Reference Ring and Layer2003). The mineralogy, petrochemistry and P–T path of the metabasic rocks were studied by Baltatzis (Reference Baltatzis1996). He concluded that they had experienced a progressive transformation of possibly eclogite-facies rocks through epidote blueschists into greenschists. Late Cretaceous limestones (Leleu & Neumann, Reference Leleu and Neumann1969) tectonically overlie the Blueschist Unit and are possibly equivalent to Late Cretaceous carbonates of the Upper Cycladic Unit.
Middle Miocene sediments, tectonically overlying the Blueschist Unit, comprise lacustrine and brackish deposits (Marinos & Petrascheck, Reference Marinos and Petrascheck1956).
4. Geological setting of the granitoid rocks
4.a. The granodiorite stock
An almost undeformed but variably altered granodiorite stock crops out in the Plaka area (Fig. 3), intruding the ‘Basal Unit’. The granodioritic stock is considered to be an apophysis of a granitic batholith, existing at depth in the eastern part of Attica, detected by geophysical measurements (Marinos & Makris, Reference Marinos and Makris1975). A weak pre-full-crystallization subhorizontal mineral fabric is observed. An age of 8.27 ± 0.11 Ma by K–Ar on biotite was reported by Altherr et al. (Reference Altherr, Kreuzer, Wendt, Lenz, Wagner, Keller, Harre and Hohndorf1982), whereas Marinos (Reference Marinos1971) obtained a K–Ar whole rock age of 8.8 ± 0.5 Ma. It is worth mentioning that elsewhere in the Cyclades, K–Ar and 39Ar–40Ar biotite ages are typically several million years younger than hornblende ages (Altherr et al. Reference Altherr, Kreuzer, Wendt, Lenz, Wagner, Keller, Harre and Hohndorf1982), even in relatively high-level stocks such as in Samos (Mezger et al. Reference Mezger, Altherr, Okrusch, Henjes-Kunst and Kreuzer1985; Pe-Piper & Piper, Reference Pe-Piper and Piper2004). A fission track age of 7.3 Ma on apatite (G. Wagner in Altherr et al. Reference Altherr, Kreuzer, Wendt, Lenz, Wagner, Keller, Harre and Hohndorf1982) indicates rapid cooling of the plutonite. Intrusion of the granodiorite was accompanied by contact metamorphism of the surrounding ‘Kaesariani schists’ (Baltatzis, Reference Baltatzis1981).
4.b. Dykes
Undeformed subvertical dykes of porphyry rocks occur throughout the ‘Basal Unit’ in the Lavrion area (Fig. 3). They strike WNW–ESE to WSW–ENE and range in composition from quartz-syenite through quartz-monzonite to granodiorite. The width of the known dykes at Plaka and Kamariza varies between 2 and 4 m. Chilled margins are observed in one dyke exposed close to the Adami bridge (Fig. 3). More than five dykes were reported to occur, mainly underground, in the Kamariza area (Campresy, Reference Campresy1889). These dykes range in length from 300 to 900 m. They experienced intense supergene alteration, thus limiting our petrological study to dykes that crop out in the area of Plaka.
5. Petrography
5.a. The granodiorite stock
The fresh granodiorite comprises K-feldspar, plagioclase and biotite. Magnetite, apatite and zircon are accessories. The rock exhibits hydrothermal alteration features along joints fringed by bleached zones containing chlorite, actinolite, epidote and quartz. The major part of the granodiorite stock, including the peripheral portion, is hydrothermally altered. Sericitic alteration and silicification are recognized. The deeper part of the altered portion of the granodiorite stock is cross-cut by a swarm of WNW–ESE-trending quartz veins, whereas the upper part is pervasively silicified.
5.b. Dykes
Two texturally different types of dyke rocks were observed. The first type (sampled from outcrops along the Adami valley) shows a typical porphyritic texture with phenocrysts of plagioclase, quartz, hornblende and minor ilmenite. The plagioclase is optically zoned. Quartz crystals contain rutile inclusions. Zircon and titanite occur as accessory phases. Primary, green hornblende forms subhedral porphyrocrystals. The groundmass is fine grained and consists of K-feldspar, quartz and plagioclase. Fluidic texture is common. The modal composition of the dykes shows that they range from granodiorite to quartz-monzonite and quartz-syenite. K/Ar dating on a K-feldspar separate yielded an age of 9.4 ± 0.3 Ma (Table 1). Patchy actinolite crystals have formed after primary hornblende. Chlorite, sericite and Fe-oxides are also present.
K–Ar dating on K-feldspar separate

The second type, cropping out at Adami bridge, displays poikilitic texture. K-feldspar, quartz and poikilitic plagioclase are the main constituents, with ilmenite as the opaque phase. Patchy amphibole crystals (both hornblende and actinolite) are dispersed throughout the groundmass. Accessories are zircon, apatite and titanite. Other secondary phases are chlorite, calcite and minor epidote, occurring either dispersed in the matrix or as thin veinlets. On the basis of modal mineralogy, these samples classify as granites and granodiorites.
6. Mineral chemistry
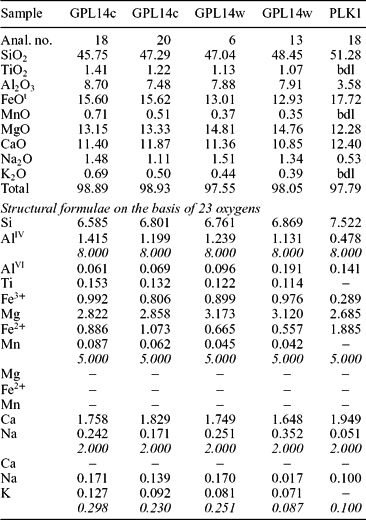
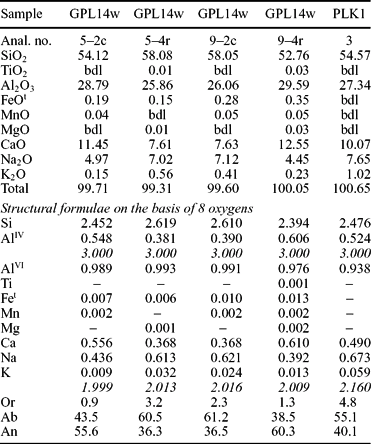
Representative amphibole and plagioclase analyses are listed in Tables 2 and 3. Analytical methods are described in Appendix 1. Stoichiometric calculations for amphiboles were done on the basis of 23(O) and of 13 cations excluding Ca, Na and K. Igneous amphiboles from the dyke rocks are magnesiohornblendes (nomenclature after Leake et al. Reference Leake, Wooley, Arps, Birch, Gilbert, Grice, Hawthorne, Kato, Kisch, Krivovichev, Linthout, Laird, Mandarino, Maresch, Nickel, Rock, Schumacher, Smith, Stephenson, Ungaretti, Whittaker and Youzhi1997), whereas their alteration products are mainly actinolites, showing a clear distinction from the primary magnesiohornblendes. The igneous magnesiohornblendes from the dykes differ from the secondary amphiboles in having lower abundances of Si and Ca and higher Ti contents. Primary plagioclases from the dyke rocks are normally zoned, with cores ranging from An40 to An69 and more sodic rims, ranging from An26 to An48 (Table 3). Some plagioclase crystals show reverse zoning, with cores ranging from An27 to An39 and rims whose compositions range from An43 to An60 (e.g. analyses 9–2c and 9–4r, in Table 3). The orthoclase content is generally low and does not exceed 4.8 wt %. The K-feldspars have orthoclase content from 86.4 to 93.8 wt %.
Representative microprobe analyses of amphiboles of the dyke rocks

bdl – below detection limit.
Representative microprobe analyses of plagioclases of dyke rocks
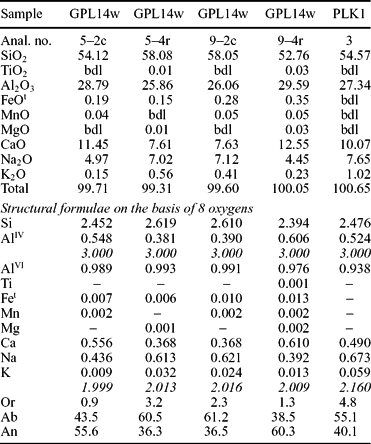
bdl – below detection limit; c – core, r – rim.
Pressure estimates for the dyke rocks were made using the Al-in-hornblende geobarometer of Anderson & Smith (Reference Anderson and Smith1995), but the estimates are imprecise because biotite is absent from the primary assemblage and the analysed plagioclases fall mostly outside the range of An25–35 suggested by these authors. Unaltered magnesiohornblende rim compositions from the dyke rocks probably formed at pressures between 3 and 4 kbar.
7. Whole rock chemistry
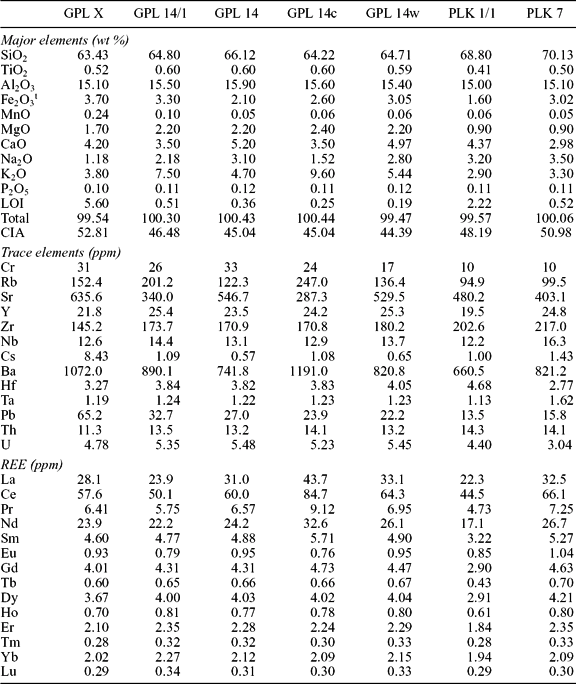
Chemical analyses of samples from dykes are given in Table 4, along with a single analysis of the Plaka granodiorite stock. We also use the analyses given by Altherr & Siebel (Reference Altherr and Siebel2002) for the same granodiorite stock. Only samples with limited hydrothermal alteration or weathering were analysed. The analysed dyke rocks have experienced weak hydrothermal alteration as evidenced by petrographic observations and the low loss on ignition (LOI) values. The values of the chemical index of alteration, CIA (= molecular (100*Al2O3/(Al2O3+CaO*+ Na2O+K2O)), where CaO* = molecular (CaO–3P2O5)), are constant (44.4–52.8; Table 4) and mostly within the range of fresh granites (45–55: Nesbitt & Young, Reference Nesbitt and Young1982). SiO2 content ranges between 63.4 and 68.8 % in the dyke rocks and between 66.8 and 70.1 % in the granodiorite stock, while normative corundum lies below 1 % (except sample GPL X with normative corundum = 1.75). The dyke rocks display K2O/Na2O > 1 (except PLK 1/1 with K2O/Na2O = 0.9) while the granodiorite stock samples have K2O/Na2O < 1.
Whole-rock chemical analyses of dyke rocks
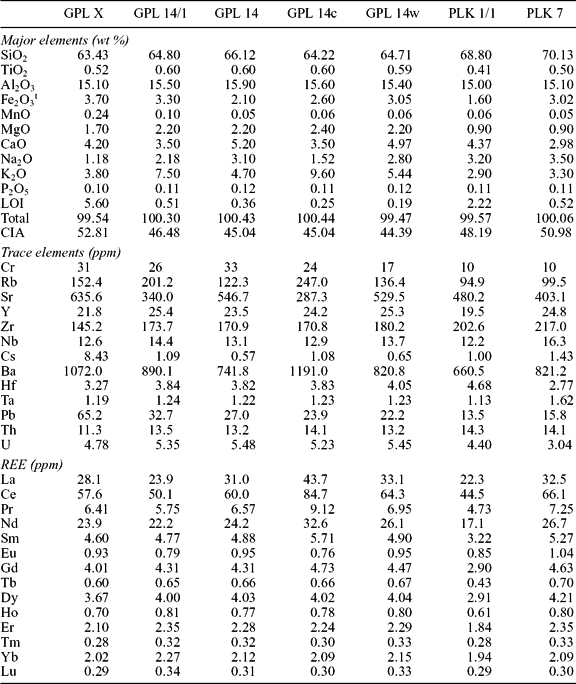
Analysis PLK 7 – sample from the granodiorite stock.
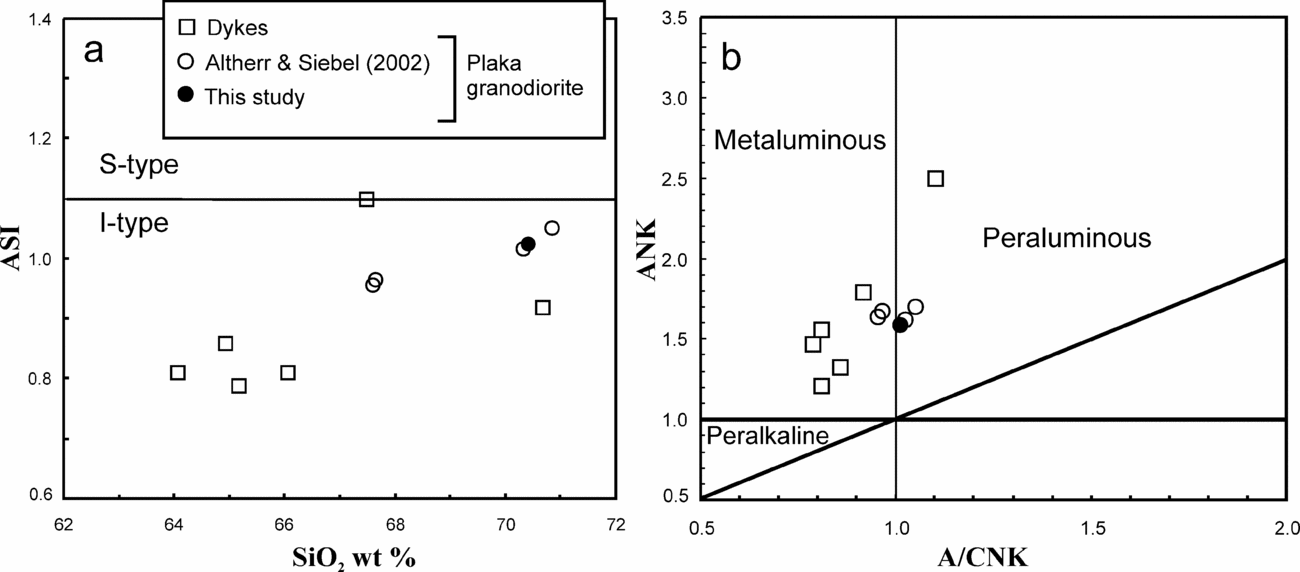
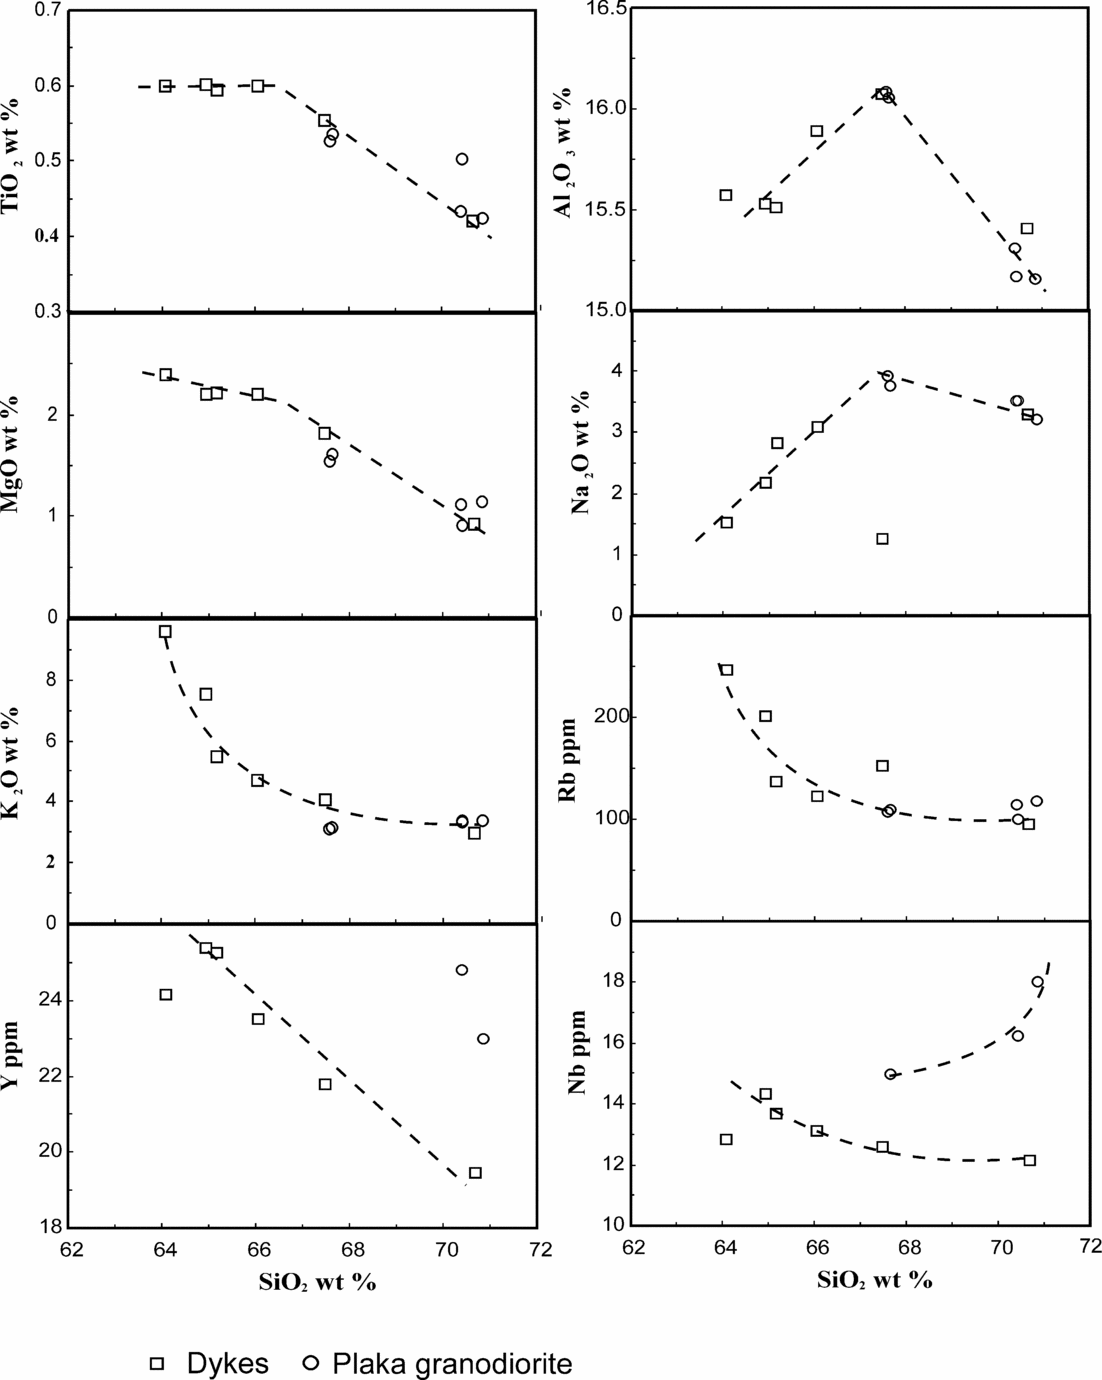
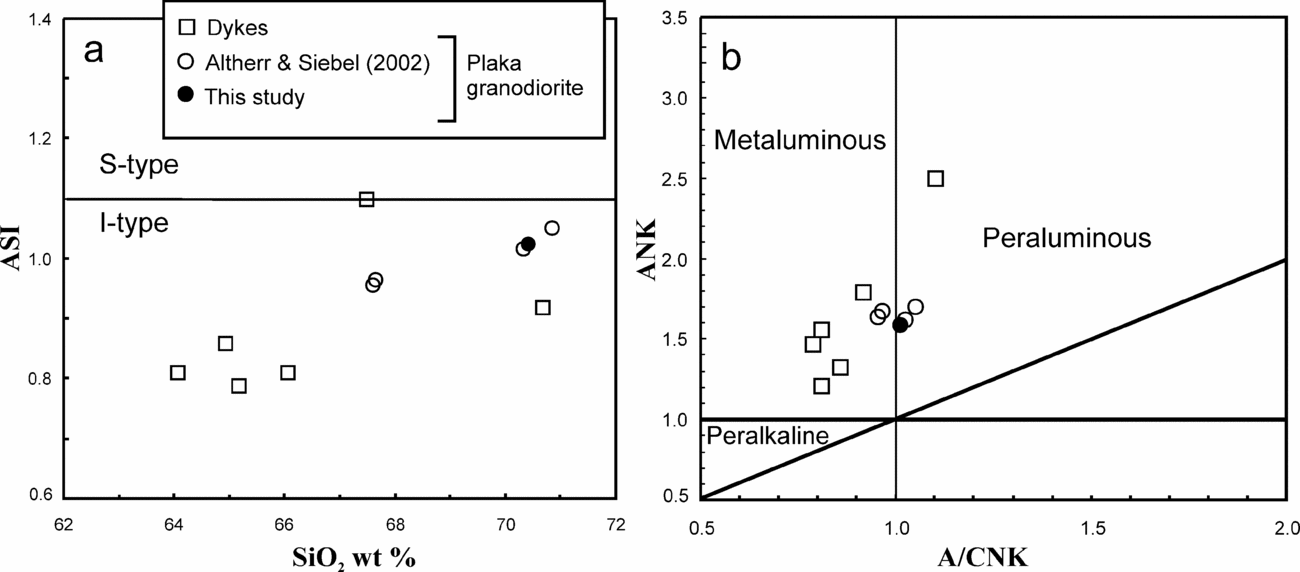
The aluminium saturation index (ASI: molecular Al2O3/(Na2O+K2O+CaO)), remains below 1.1, which is the upper limit for I-type granites and increases with increasing SiO2 in samples from the dykes and the granodiorite stock (fig. 5a). The dyke rocks are metaluminous, whereas the Plaka granodiorite stock is metaluminous to slightly peraluminous (fig. 5b). The peraluminous character shown by the sample GPL X appears to be a consequence of alteration. Figure 6 illustrates selected Harker diagrams for the analysed dyke rocks from Lavrion along with the granodiorite stock on a volatile-free basis. Successive trends are ob-served from the dykes to the Plaka granodiorite stock. TiO2, Al2O3, MgO and Na2O show distinctive inflections at around 67 wt % SiO2. K2O, Rb, Y and Nb show a continuous decrease with increasing SiO2, whereas CaO is nearly constant (not shown). Nb and Y contents in the granodiorite stock do not follow the variation defined by the dykes displaying higher values with increasing SiO2 (Fig. 6).
(a) Plot of aluminium saturation index (ASI) ratio v. SiO2 for the analysed rocks, on a volatile-free basis. (b) Plot of Shand's index (ANK: molar Al2O3/(Na2O+K2O) v. A/CNK: molar Al2O3/(CaO+Na2O+K2O)) for the analysed dyke rocks and the granodiorite stock (on a volatile-free basis).
Selected Harker variation diagrams of elements v. SiO2 for the analysed rocks (on a volatile-free basis).

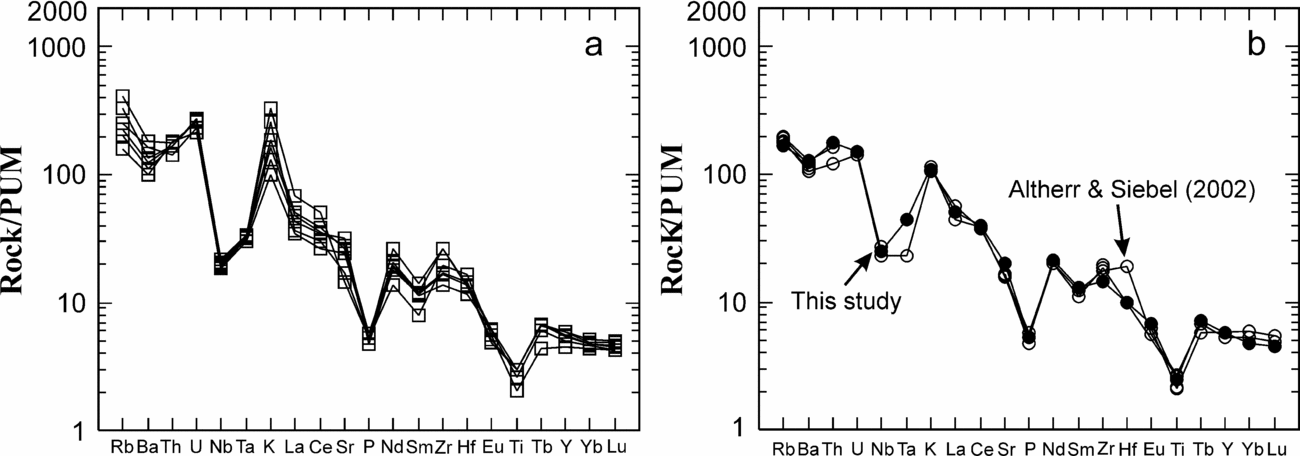
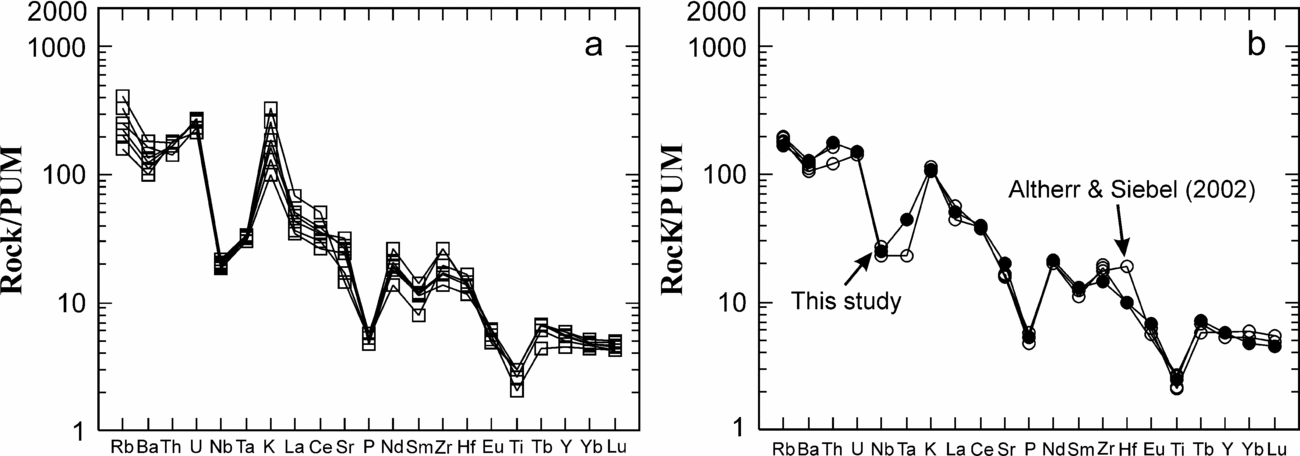
Spider diagrams of elements normalized to primitive upper mantle (PUM) for the dykes and the granodiorite stock display significant similarities, with marked negative Nb–Ta, P and Ti anomalies while Ba has weak negative anomalies (Fig. 7). The dyke rocks as well as the granodiorite have similar Ocean Ridge Granite (ORG)-normalized patterns, characteristic of volcanic arc granitic rocks (VAG: Pearce, Harris & Tindle, Reference Pearce, Harris and Tindle1984) with low Ta and Nb contents, as well as negative Hf and weak Ba anomalies (not shown).
Primitive Upper Mantle-normalized spider diagrams for: (a) the dyke rocks (this study) and (b) the granodiorite stock (data from Altherr & Siebel, Reference Altherr and Siebel2002 and this study). Normalizing values after Sun & McDonough (Reference Sun, McDonough, Saunders and Norry1989).
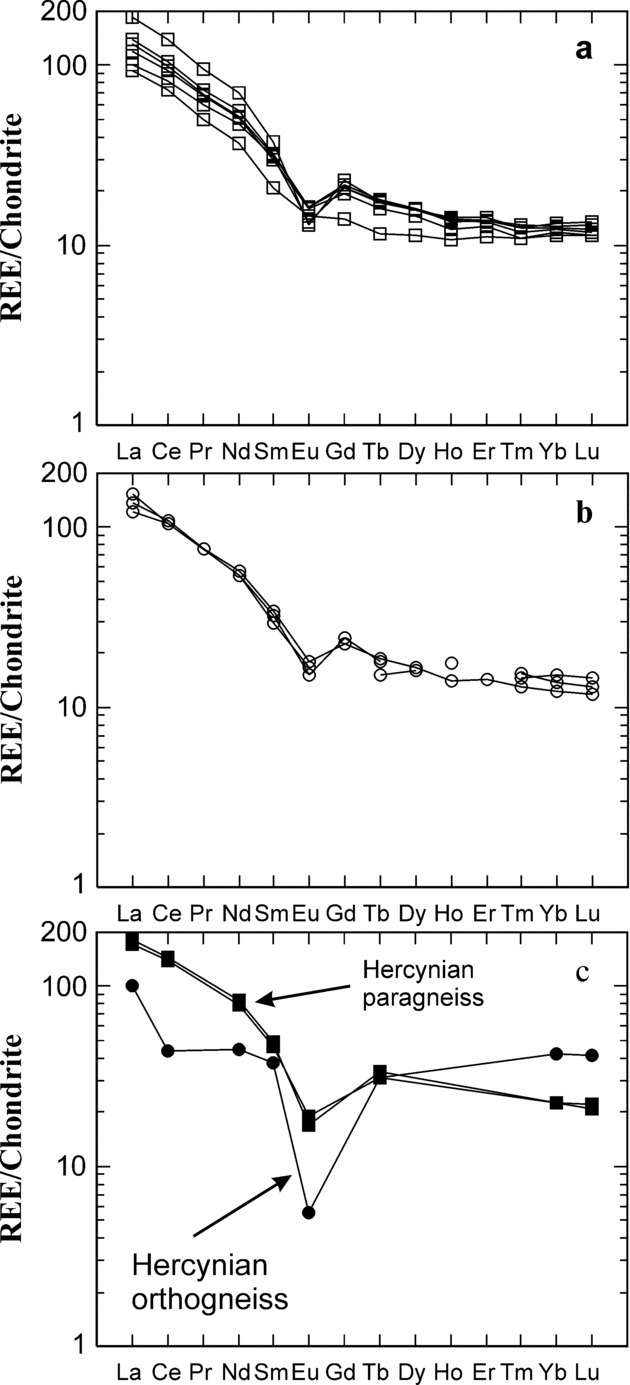
Chondrite normalized rare earth element (REE) patterns for the dyke rocks and the granodiorite stock are illustrated in Figure 8. All the analysed samples are similar with strongly fractionated REE ((La/Yb)n = 7.55–15.00). The LREE are most fractionated, whereas the HREE are essentially flat ((Tb/Lu)n = 1.00–1.58), and all samples show distinct negative Eu anomalies (Eu/Eu* = 0.45–0.67), except one dyke (PLK 1/1) with negligible negative Eu anomaly (Eu/Eu* = 0.86).
Chondrite-normalized REE patterns for: (a) the dyke rocks (this study), (b) the granodiorite stock (data from Altherr & Siebel, Reference Altherr and Siebel2002 and this study) and (c) the Hercynian, Naxos paragneiss and orthogneiss for comparison (after Pe-Piper, Reference Pe-Piper2000).
8. Sm and Nd isotopes
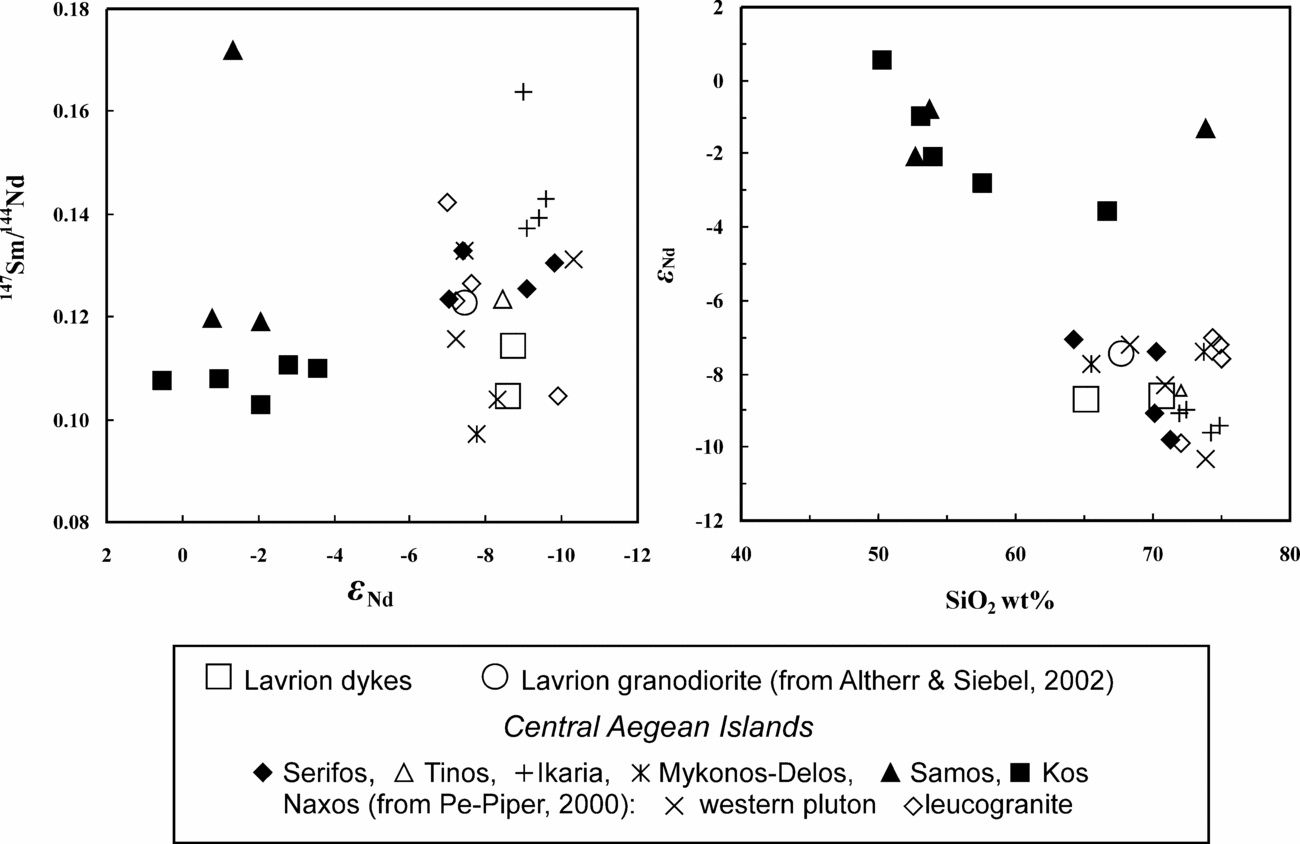
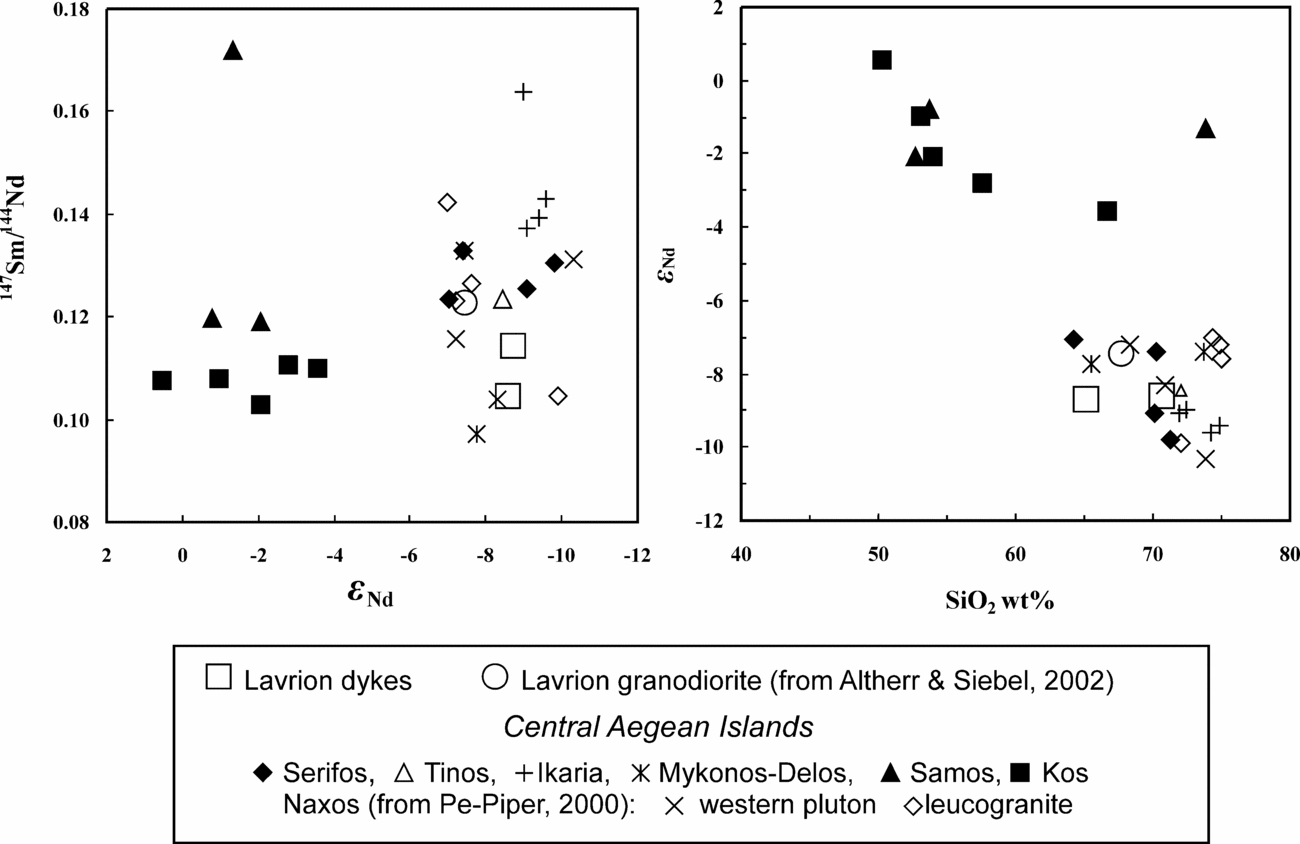
Sm and Nd isotope determinations were made on two samples of dykes (Table 5). The two εNd determinations are identical to within analytical error (−8.6 to −8.7), over a range of SiO2 contents (on an anhydrous basis) from 65 % to 71 % (Fig. 9). Values of εNd are similar to those from plutons in Serifos, Tinos, Mykonos and Ikaria given by Altherr & Siebel (Reference Altherr and Siebel2002). They are slightly more negative than the Western pluton of Naxos, but not as negative as the type II leucogranites of Naxos (Pe-Piper, Reference Pe-Piper2000), suggesting a lesser influence by a crustal component for the Lavrion dykes relative to the leucogranites. The Plaka granodiorite has less strongly negative εNd (−7.9 and −7.46) (Juteau, Michard & Albarède, Reference Juteau, Michard and Albarède1986; Altherr & Siebel, Reference Altherr and Siebel2002) and falls on the same trend of εNd v. 87Sr/86Sr as the plutonic rocks of Naxos, Mykonos, Tinos and Serifos shown by Pe-Piper (Reference Pe-Piper2000) and Altherr & Siebel (Reference Altherr and Siebel2002). The εNd of the Plaka granodiorite stock is significantly different from the dyke rocks of Lavrion, however, model ages (based on a depleted mantle model) are identical to within analytical error (1.2 to 1.3 Ga) for all samples, including the Plaka granodiorite.
Sm and Nd isotope data for the igneous rocks

For TDM ages determinations the equation used is that of Faure (Reference Faure1986). For εNd determinations we used the constants: 143Nd/144Nd = 0.512638 and 147Sm/144Nd = 0.1967. Errors for Nd isotopic compositions represent 2 sigma of the mean based on in-run statistics.
*Data from Altherr & Siebel (Reference Altherr and Siebel2002).
+The ages (Ma) used for εNd (I) calculations are as those in Altherr & Siebel (Reference Altherr and Siebel2002): 9 Ma for Serifos, 10 Ma for Lavrion and Kos, 11 Ma for Mykonos and Delos, 12 Ma for Naxos, Ikaria and Samos and 15 Ma for Tinos.
Plots of 147Sm/144Nd v. εNd and εNd v. SiO2 for the Lavrion igneous rocks, the Central Aegean plutons (after Altherr & Siebel, Reference Altherr and Siebel2002), and the western pluton and the leucogranite of Naxos (after Pe-Piper, Reference Pe-Piper2000).
9. Discussion
9.a. Petrology, geochemistry
Previous petrological studies have shown that the Cycladic I-type plutons were derived from mixing of two principal sources: a mantle source of mafic and a crustal source of felsic magma. Subsequent evolution of these plutons was dominated by assimilation and fractional crystallization (Altherr et al. Reference Altherr, Henjes-Kunst, Matthews, Friedrichsen and Hansen1988; Tarney et al. Reference Tarney, Barr, Mitropoulos, Sideris, Katerinopoulos, Stouraiti, Casale, Fytikas, Sigvaldasson and Vougioukalakis1998; Altherr & Siebel, Reference Altherr and Siebel2002; Pe-Piper, Reference Pe-Piper2000; Pe-Piper, Piper & Matarangas, 2002).
The dyke rocks and the granodiorite stock from Lavrion show many features of calc-alkaline I-type granitoids: they contain hornblende and titanite, have ASI ≤ 1.1, are generally metaluminous, have normative diopside and low (generally < 1 wt %) normative corundum. In addition, due to their relatively low Nb, Y and Rb contents, on the discrimination diagrams of Pearce, Harris & Tindle (Reference Pearce, Harris and Tindle1984) these samples plot in the field of Volcanic Arc Granite (not shown). The negative Ta–Nb anomalies on spider diagrams are typical of I-type granites and of many crustal rocks. Many of these features are characteristic of a subduction-related source, which is also supported by the high-K, calc-alkaline nature of the Lavrion dykes and granodiorite (e.g. Rogers & Hawkesworth, Reference Rogers and Hawkesworth1989).
The generation of high-K granodioritic to granitic magmas in continental arc settings has been attributed to parent mantle melts that were enriched in subducted-slab-derived fluids and contaminated with crustal material during ascent (e.g. De Paolo, Reference De Paolo1981; Hildreth & Moorbath, Reference Hildreth and Moorbath1988). Reverse mineral zonation, like that observed in the plagioclases from the dykes, is usually associated with crystal growth in an open system, either a hydrothermal system or a melt after a period of magma mixing or degassing and indicates variations in the conditions local to the crystal (Holten, Jamtveit & Meakin, Reference Holten, Jamtveit and Meakin2000), compatible with mixing of a mafic and a crustal component during the evolution of the dykes. The small difference in Nd isotopes between the Plaka granodiorite stock and the dykes might be because there was a significant mafic mantle-derived magma component within the stock, whereas the dykes were derived from magma where the contribution of dehydration melting of a crustal component was more important.
The abundance of compatible elements such as Cr in the most mafic dyke rocks is comparable with that of Hercynian paragneisses from Naxos reported by Pe-Piper (Reference Pe-Piper2000). These dyke rocks are also clearly enriched in K2O and Rb, thus indicating that crustal material played an important role in their genesis. Moreover, their REE patterns are remarkably similar to those of the Naxos paragneisses (Fig. 8), suggesting that similar rocks may have been an important source to the magma. Notably, the somewhat peculiar humped pattern among the LREE, which is portrayed by the Naxos paragneisses, appears present in both the dykes and the granodiorite stock.
The investigated rocks show essentially unfractionated HREE patterns, with high (La/Yb)n and low (Tb/Yb)n ratios (Fig. 8), as well as high Y and Sr/Y ratios, thus precluding the involvement of substantial amounts of garnet either in the residue during partial melting and final re-equilibration or as part of the fractionating assemblage in the deep crust, consistent with rather low-pressure melting (< 8 kbar). The evolution of the Lavrion dykes and granodiorite into the plagioclase (and K-feldspar) stability field, that is, under crustal conditions, is supported by the negative Ba, Eu and P anomalies on primitive upper mantle-normalized plots (Fig. 7).
The systematic variation on the Harker diagrams for the dykes and the granodiorite stock may be the result of mixing, as discussed above, and of fractional crystallization. The Na2O and Al2O3 distributions (Fig. 6), as well as the negative Eu anomalies (Fig. 8), suggest that sodic plagioclase fractionation became important during the late stages of evolution of the dykes and the formation of the granodiorite. The small Eu anomaly in sample PLK 1/1 is interpreted to be due to the strong contribution of hornblende fractionation that minimizes the Eu anomaly (Henderson, Reference Henderson1984). The continuous decreases of MgO, Y and Nb are compatible with hornblende separation during the evolution of the dyke rocks. The TiO2 inflection at around 67 wt % silica is likely to indicate the onset of fractionation of titanite. The influence of hornblende and titanite fractionation is moreover indicated by the negative anomalies in Nb and Ti, respectively, on spider diagrams, whereas the P negative anomaly should result from apatite (and possibly hornblende) separation. K2O and Rb show a continuous decrease, indicating that possibly K-feldspar and biotite were significant crystallizing phases in these rocks; the observed negative Ba anomalies on the spider diagrams are consistent with this interpretation. The higher Nb and Y values in the granodiorite stock relative to that expected from the trend defined by the dykes may be a consequence of mixing with a mantle derived magma, discussed earlier.
9.b. Geodynamic implications
The igneous rocks of the Lavrion area represent the northwesternmost outcrop of Miocene intrusions in the Attic–Cycladic belt. Previous authors have regarded the Late Miocene motion on the old thrust fault separating the Blueschist and Basal units as compressive (renewed thrusting). However, regionally, extensional (detachment) faulting predominated at this time. The metamorphic grade in the Basal Unit, where there is a widespread thermal aureole produced by a rather small intrusion, appears to be substantially higher than in the Blueschist Unit, which escaped contact metamorphism. Final emplacement of the Blueschist over the Basal unit took place at rather shallow depths, post-dating contact metamorphism of the rocks of the Basal Unit, and this abrupt decrease in metamorphic grade is consistent with the regional presence of extensional detachment faulting.
The general E–W orientation of the dykes (WNW–ESE to WSW–ENE) indicates a regional extensional stress field with a roughly N–S direction. The exact mode of occurrence of the granodioritic body at depth is unknown, while the poor exposure of intrusive contacts renders the study of the mode of emplacement difficult. Based on measurement of orientation of the long axis of plagioclase crystals, a N–S direction of magma flow was concluded by Theodoropoulos & Fytrolakis (Reference Theodoropoulos and Fytrolakis1974), implying some form of structural control on the intrusion. By analogy with observations in Delos (Pe-Piper, Piper & Matarangas, 2002) and Naxos (Koukouvelas & Kokkalas, Reference Koukouvelas and Kokkalas2003), where early stages of pluton emplacement took place along wrench faults parallel to the extension direction of a major mid-crustal detachment fault, the Plaka stock may have been emplaced along a wrench fault within a regional N–S extensional setting. The numerous wide WNW–ESE-oriented quartz veins (tension gashes) cutting the hydrothermally altered granodiorite further indicate substantial extension in the footwall after granodiorite emplacement. The lack of dykes in the granodiorite suggests that they are older that the granodiorite. It seems that extension and the exhumation of the metamorphic units was accompanied at a late stage by the intrusion first of the dykes, following WNW–SSE-trending high-angle normal faults, and then the granodiorite.
The 9.4 ± 0.3 Ma K–Ar age on feldspar for the dyke rock in the footwall is probably the isotopic age determination closest to the emplacement age and provides a minimum age for igneous activity, whereas the progressively younger ages of 8.27 ± 0.11 Ma obtained from biotite and of 7.3 Ma on apatite by fission track (Altherr et al. Reference Altherr, Kreuzer, Wendt, Lenz, Wagner, Keller, Harre and Hohndorf1982) are cooling ages. This progressive cooling points to unroofing that is most easily achieved by extensional detachment faulting. In this case there was the same extension direction before granodiorite emplacement (to produce the dykes) and after granodiorite emplacement (to produce the widespread quartz veins).
The NNE–SSW orientation of the Late Miocene extensional stress field is further confirmed by the orientation of WNW–ESE-trending mineralized tension gashes, explored underground at Plaka. These are filled with banded hydrothermal Pb–Ag–Zn sulphide mineralization steeply SSW dipping, cutting hornfelses that were pervasively hydrothermally altered (Skarpelis, Reference Skarpelis2002). They form a set of fractures probably associated with continued extension, cooling of the granodiorite and generation of hydrothermal fluids post-dating skarn formation.
Regional considerations suggest that this extension was regional rather than being local or related to the structural evolution of the Basal Unit in the Lavrion area. Structural analysis of Miocene to Pliocene sedimentary sequences in Attica and Beotia suggests they were deposited in basins bounded mainly by E–W-trending faults (A. Mettos, unpub. Ph.D. thesis, Univ. Athens, 1992) formed as a result of N–S extension.
The geodynamic evolution of the Lavrion area has many features in common with that of NE Attica, the central Aegean islands and southern Evia. An extension direction of NNE inferred from dyke orientations and the fold axes of Blueschist Unit rocks in Lavrion is parallel to the regional ductile shear directions from NE Attica, southern Evia, Andros and Kea in greenschist facies (St. Lozios, unpub. Ph.D. thesis, Univ. Athens, 1993; P. Gautier, unpub. Ph.D. thesis, Univ. Rennes I, 1995; Walcott, Reference Walcott1998). This observation does not demonstrate extension rather than thrusting, but does place Lavrion within a regional context.
Late granitic to dioritic dykes trending roughly E–W cut through the granodiorite and country rocks in Serifos island, where earlier ductile structures trend NE–SW (Salemink, Reference Salemink1985; Petrakakis et al. Reference Petrakakis, Grasemann, Iglseder, Rambousek and Zamolyi2004). A zircon fission track age of 8.6 ± 1.6 Ma, obtained on a sample of a dyke within the metamorphic aureole, was interpreted as cooling age (St. Brichau, unpub. Ph.D. thesis, Univ. Mainz & Univ. Montpellier II, 2004). Based on age and style of emplacement, these dykes seem to correlate with the dyke rocks of the Lavrion area.
Emplacement of the Blueschist Unit over the Basal Unit at Lavrion by extensional detachment likely took place in Late Miocene times, on the basis of the cooling ages for the igneous rocks (8.3 Ma on biotite, 7.3 Ma on apatite: Altherr et al. Reference Altherr, Kreuzer, Wendt, Lenz, Wagner, Keller, Harre and Hohndorf1982). By comparison, in Naxos, unroofing of the footwall is dated at 8.2 Ma on apatite (e.g. Altherr et al. Reference Altherr, Kreuzer, Wendt, Lenz, Wagner, Keller, Harre and Hohndorf1982), and in Paros, Ikaria, Mykonos and Serifos the detachment faults started to operate at c. 13 Ma (e.g. Kumerics et al. Reference Kumerics, Ring, Brichau, Glodny and Monie2005, Brichau et al. Reference Brichau, Ring, Ketcham, Carter, Stockli and Brunel2006), suggesting that the timing of the extensional fault system of Lavrion was similar to that in the central Cyclades and therefore evolved before, during and after the intrusion of the dykes and the granodiorite stock.
10. Conclusions
The igneous rocks of the Lavrion area represent the northwesternmost outcrop of Miocene intrusions in the Attic–Cycladic belt. The 9.4 ± 0.3 Ma age on feldspar for the dyke rock provides a minimum age for the igneous activity in the Lavrion area. The orientation, both of the dykes of porphyry rocks and the quartz veins (tension gashes) cutting the hydrothermally altered granodiorite stock, indicates a regional extensional stress field with roughly N–S direction. Extension, emplacement of the granitoid rocks, and the exhumation of the metamorphic units were the result of regional extension and detachment faulting continuous with the well-known extension of the Cyclades. Final emplacement of the Blueschist Unit over the Basal Unit took place at rather shallow depths, post-dating contact metamorphism of the rocks of the Basal Unit.
Various geochemical and mineralogical criteria indicate that the main geochemical features of the granitoid rocks evolved under crustal pressure conditions. Small differences in Sm–Nd isotope systematics suggest that the granodiorite stock may have a greater component of mantle source material than the dykes, but that both had an important felsic component of crustal origin. In detail, the LILE in the dykes resemble those of Hercynian paragneisses which have been interpreted as an important component of granitoid dykes on Naxos. Continuous geochemical trends from the dykes to the Plaka granodiorite stock are interpreted principally in terms of fractional crystallization of sodic plagioclase, hornblende, titanite and possibly K-feldspar and biotite.
Acknowledgements
This work was supported in part by the ‘Special Account for Research Grants, National and Kapodistrian University of Athens’ (grant 4/6424 to N.S.). The work on mineral chemistry was carried out during a stay by N.S. with the Department of Earth and Environmental Sciences, Ludwig Maximilians University of Munich. Professor Rudolf Höll is thanked for helpful discussions and hospitality when in Munich. Thanks are due to Professors Robert Marschik and Thomas Fehr for making available laboratory facilities. We also thank Dr D. J. W. Piper for his valuable comments on the paper. Reviews by Professor R. Altherr and an anonymous referee resulted in substantial improvements to this manuscript and are greatly appreciated. Thanks are due to Dr Sofia Karipi for help with drawing Figures 1 through 4.
Appendix 1. Analytical methods
The principal outcrops of granitoid rocks were studied in the field and representative samples were collected. Microprobe analyses of minerals were performed on a CAMECA SX50 microprobe equipped with an energy dispersive and four wavelength dispersive spectrometers at the Department of Earth and Environmental Sciences, Ludwig Maximilians University of Munich. Accelerating voltage was 15 kV and the beam current 40 nA. The beam diameter was 2 μm and the analytical software was the Xmas 4.5 from SAMx enterprise run under Windows NT. The data were reduced with the aid of the PAP algorithm.
Rock samples were analysed by OMAC Laboratories Ltd (Ireland), applying ICP Optical Emission Spectrometry. REE were analysed by Induced Neutron Activation Analysis. Detection limit for major elements is 0.01 wt %, except for TiO2 and MnO which is 0.001 wt %. The analytical precision, calculated from replicate analyses, is better than 2 % for most major elements and better than 5 % for most trace elements and REE.
The isotopic analyses were carried out by Geospec Consultants of Edmonton, Alberta, Canada. Rock powders were weighed and totally spiked with a mixed 150Nd–149Sm tracer solution. Dissolution was carried out in 24N HF + 16N HNO3 in sealed PFA Teflon® vessels at 160 °C for five days. The fluoride residue was converted to chloride with HCl, and Nd and Sm were separated by conventional cation and HDEHP-based chromatography. Chemical processing blanks were < 40 picograms of either Sm or Nd, and are insignificant relative to the amount of Sm or Nd analysed for any rock sample. The isotopic composition of Nd was determined in static mode by Multi-Collector ICP-Mass Spectrometry. All isotope ratios were normalized for variable mass fractionation to a value of 146Nd/144Nd = 0.7219 using the exponential fractionation law. The 143Nd/144Nd ratio of samples is presented relative to a value of 0.511850 for the La Jolla Nd isotopic standard, monitored by use of an Alfa Nd inhouse laboratory isotopic standard for each analytical session. Sm isotopic abundances were measured in static mode by Thermal Ionization Mass Spectrometry, and are normalized for variable mass fractionation to a value of 1.17537 for 152Sm/154Sm also using the exponential law. The mixed 150Nd–159Sm tracer solution used was calibrated directly against the Caltech mixed Sm/Nd normal described by Wasserburg et al. (Reference Wasserburg, Jacobsen, De Paolo, McCulloch and Wen1981). Using this mixed tracer, the measured 147Sm/144Nd ratios for the international rock standard BCR-1 range from 0.1380 to 0.1382, suggesting a reproducibility for 147Sm/144Nd of about ± 0.1 % for real rock powders. The value of 147Sm/144Nd determined for BCR-1 is within the range of reported literature values by isotope dilution methods.
K–Ar dating was done at the Geochronology and Isotopic Geochemistry Department of Actlabs, Canada. The separate contained mainly K-feldspar with very small amounts of epidote and minor iron oxide. The K concentration was determined by Thermal Ionization Mass Spectrometry (TIMS). The argon analysis was performed using the isotope dilution procedure on a noble gas mass spectrometer in duplicate.