


Introduction
In the framework of the International Trans-Antarctic Scientific Expedition (ITASE) project (Reference MayewskiMayewski and Goodwin, 1999), France and Italy carried out a traverse along one west–east (D66–GV5) and two north–south (D59–D85 and GV7–Talos Dome–M4) transects from November 2001 to January 2002 (Fig. 1). The research aimed to better explain latitudinal and longitudinal environmental and climatic gradients, as well as documenting climatic and atmospheric surface conditions during the last 200–1000 years in the Dome C drainage area and in northern Victoria Land (NVL; Reference FrezzottiFrezzotti and others, 2003). The west–east transect follows the 2150m contour line, about 400 km from the Adélie, George V and Oates coasts; the first north–south transect (D85–D59) follows the central part of the previous French traverse from Dumont d’Urville to Dome C; the second north–south transect (GV7–Talos Dome–M4) follows the ice divide extending from the Oates Coast to Talos Dome, and then continues along the 2000m contour line in the direction of Taylor Dome (Fig. 1).
Schematic map of northern and eastern Dome C drainage area, core site and main ice divide.
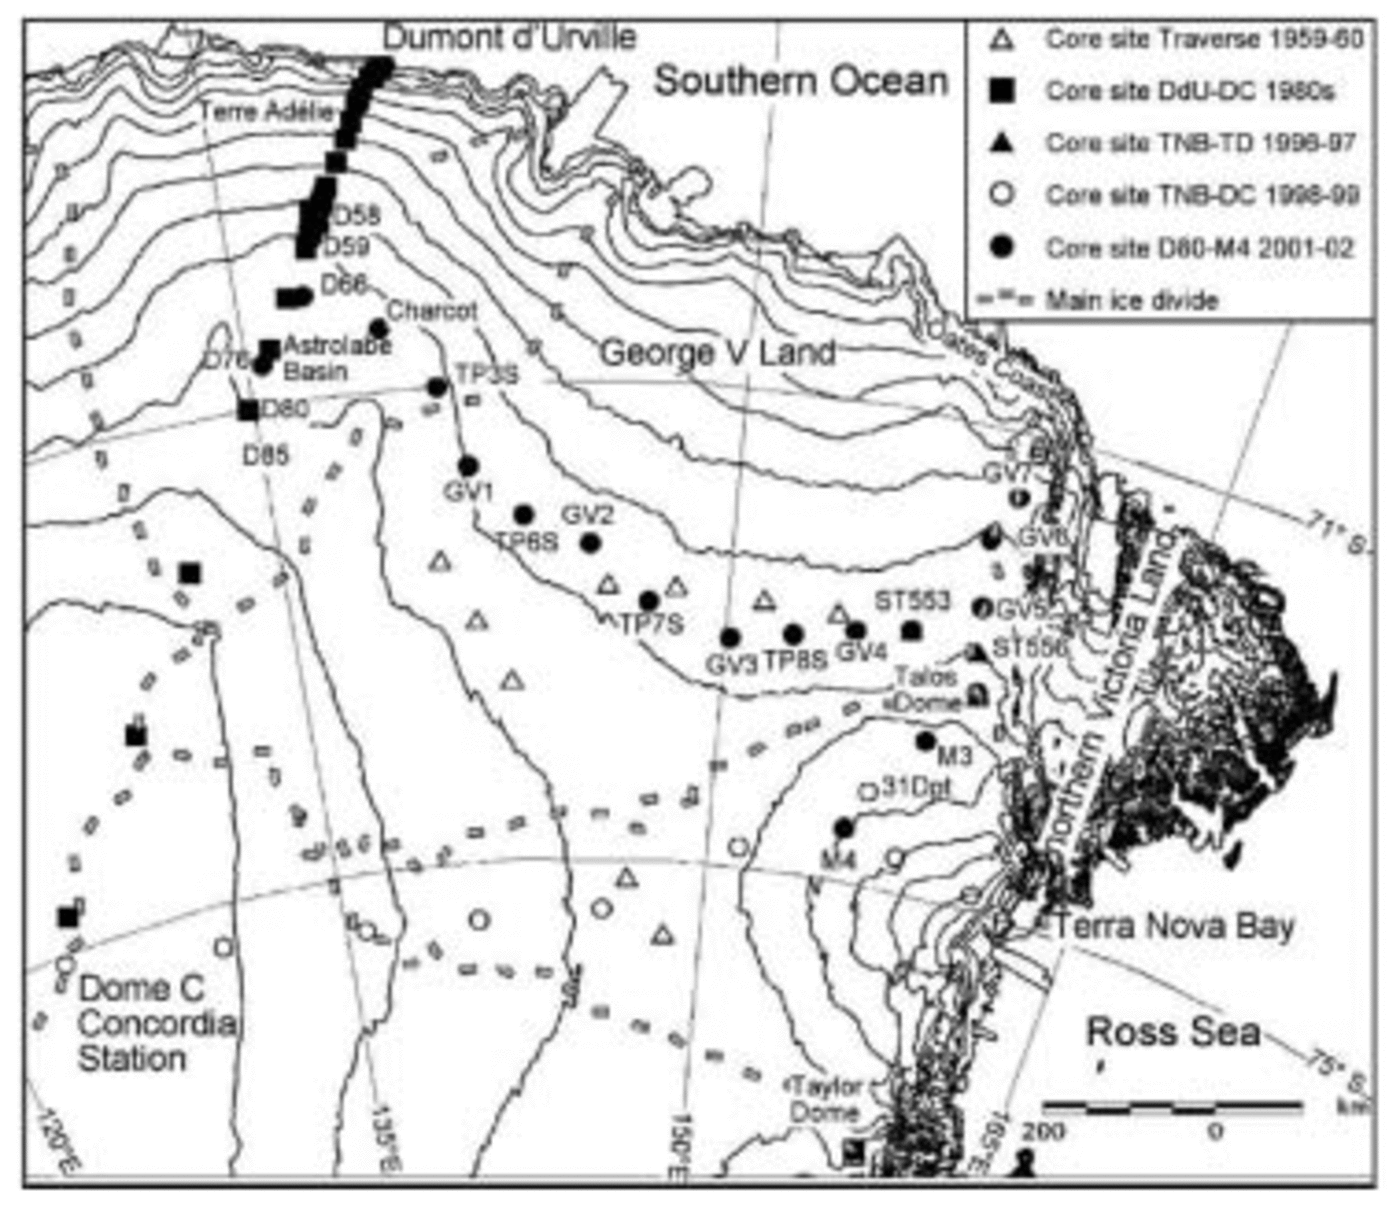
The party performed several tasks (drilling, glaciological and geophysical exploration, etc.) during the traverse. Every 160km an ice core (down to 55 m) was drilled in a flat area (slope <0.2%); an intermediate ice core (down to 25 m) was drilled at 80 km distance in between deeper cores. Oxygen-isotope and β-radioactivity measurements were carried out on the samples to provide information on accumulation rates, climatic conditions and deposition processes. In this paper, we present accumulation, temperature and stable-isotope data obtained from snow analysis and stake-farm measurements.
Materials and Methods
Previous research conducted along the traverse between Terra Nova Bay and Dome C demonstrated that wind-driven sublimation processes, controlled by surface slope in the wind direction, have a huge impact on snow accumulation (Reference FrezzottiFrezzotti and others, 2004b). In order to reduce the impact of wind-driven processes, the main core sites (D66, GV1, GV2, GV3, GV4, GV5, GV7, TDC) were selected in sectors where the action and strength of katabatic wind is reduced. Selection of such areas was based on integration and interpretation of slopes, surface conditions and wind direction data. A digital elevation model (DEM), obtained from satellite altimetry, was used to calculate the slope in the study area, with a ground resolution of 1 km (Rémy and others, 1999). Surface conditions and wind direction data have been surveyed by satellite Landsat images (Reference Mancini and FrezzottiMancini and Frezzotti, 2003). Satellite images were analyzed to survey the location of aeolian macro-relief features such as glazed surfaces or sastrugi, and their direction and extension. Several secondary cores (D76, Charcot, TP3S, TP6S, TP7S, TP8S, ST553, GV6, M3, M4) were drilled at intermediate sites between the main cores.
An electromechanical drilling system (100mm in diameter) was used. The snow–firn density was determined immediately after retrieval by measuring and weighing core sections. Cores were packed in plastic bags and stored in insulated boxes before being transported by Twin Otter aircraft to a freezer at Terra Nova station. They were later shipped to France and Italy. The cores were dated using the known time horizons from the nuclear bomb tests. Between 1956 and 1964, many atmospheric nuclear tests caused an approximately ten-fold increase in radioactivity with respect to the background level. We adopted the level most often used as a chronological base, i.e. the January 1965 radioactive reference layers, to estimate accumulation rates. In the present study, the method developed by Reference Delmas and PourchetDelmas and Pourchet (1977) was applied. After melting, snow samples were filtered on ion-exchange resin paper having a surface density of 13 mg cm–1, which allows measurement of artificial radio-isotopes with maximum energies. Fission products (mainly 90Sr, 90Y and 137Cs) were detected with a low-level β counter, constituted by a surface-barrier silicon detector (Schlumberger type BEC 200-300 A) connected in anti-coincidence with a gas-flow guard counter (proportional mode-parallel wires: Intertechnique type S30 A). The nuclear-detection characteristics for global β radioactivity are described by Reference Pinglot and PourchetPinglot and Pourchet (1979). Calibrated radioactive sources (90Sr, 137Cs, 147Pm and 36Cl) derived from liquid solutions (CEA/LMRI and Hamersham), were used for efficiency measurements. A known solution (activity close to samples activity) was dropped on the same holder and ion-exchange resin paper used during the filtration of melted snow. The firn core was continuously divided into a large number of 15 cm samples to ensure an accurate temporal resolution. Each sample was counted for a mean time of 10 hours, and the analytical error (±2σ e) due to β procedure is estimated to be 10–15%. The experimental error (±σ e) for the estimation of the snow accumulation rate, for the 37 year period, is estimated to be of the order of 5%; this value takes into account the different sources of error concerning the density determination and the sampling procedure.
The stake farms were installed at main core sites, and about 40 stakes, each at 100 m spacing, were placed on four orthogonal arms centred on a snow stratigraphy pit. The height of the stakes was measured during December 2001 and January 2002. The snow accumulation at the stakes was multiplied by the snow density measured in a pit down to 2.5m to obtain water equivalents. Snow compaction was disregarded when calculating snow accumulation; it has previously been found to be negligible (Reference Lorius and RobinLorius, 1983).
Reference Richardson and HolmlundRichardson and Holmlund (1999) demonstrate the importance of determining the spatial representativeness of cores and making radar surveys prior to drilling. Snow radar (ground-penetrating radar (GPR)) and global positioning system (GPS) surveys were performed over a distance of 3245 km in order to link core sites, and to provide detailed information on the spatial variability of snow accumulation. GPR–GPS data treatment is being processed. Only snow accumulation data from stake farms and core analysis are presented in this paper.
Firn temperatures were measured in situ using ten ‘Pt 100 ohm at 0˚C’ probes after a 15–24 hour stabilization, at different depths (1, 3, 5, 7, 10, 13, 15, 20, 25 and 30 m) for boreholes deeper than 30 m, and at the bottom of 12–15m boreholes. The boreholes were carefully sealed with a foam rubber stopper to prevent air from flowing down the hole. Elevation at each site was measured using the DEM derived from the European Remote-sensing Satellite-1 (ERS-1) radar altimeter (Rémy and others, 1999); elevation was measured with respect to absolute ellipsoidal height (World Geodetic System 1984 (WGS84)).
The δ18O (where

measurements were carried out on 361 surface snow samples (1m cores) collected along the traverse every 5 km using the CO2 water equilibration technique by means
1966–96 (Reference StenniStenni and others, 2002). †1996–98 (Reference FrezzottiFrezzotti and others, 2004b).
Results and Discussion
Firn temperatures
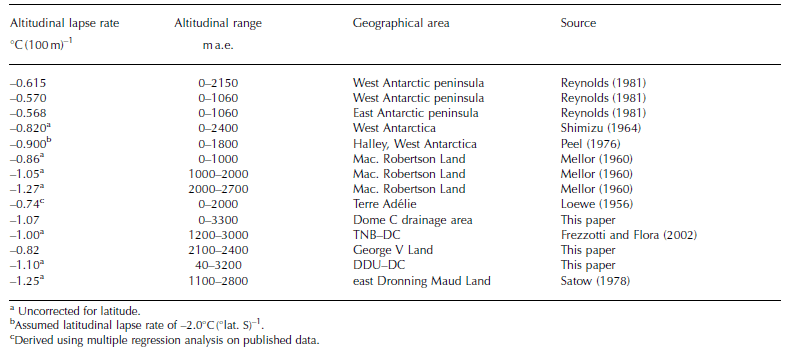
The snow temperature measured at 10 or 15 m depth gives a fairly close approximation to the mean annual ‘surface temperature’ in the dry snow, and is also close to the mean annual ‘screen air temperature’ (Reference LoeweLoewe, 1970). This assumption is acceptable in areas where maximum temperature is <0˚C during summertime, as is the case at the sampling sites. Indeed, in areas where melting occurs, the refreezing of meltwater produces heat which could warm the firn to a temperature greater than the mean annual air temperature (Reference LoeweLoewe, 1956; Reference PatersonPaterson, 1969; Müller, 1976; Reference Martin and PeelMartin and Peel, 1978; Reference ReynoldsReynolds, 1981). At 10–15m depth, the amplitude of the annual temperature wave at the snow surface is reduced to approximately 5% of its surface value, i.e. typically 0.75˚C for coastal stations and 1.75˚C on the plateau (Reference Van den BroekeVan den Broeke and others, 1999). The firn temperatures at 10–15m depth collected during this traverse and previous ones (Reference Stuart and HeineStuart and Heine, 1961; Reference PourchetPourchet and others, 1997; Reference Frezzotti and FloraFrezzotti and Flora, 2002; Reference StenniStenni and others, 2002) were plotted against elevation (Fig. 2). The correlation of temperature with surface elevation appears to be strong in the same traverse or sector (Terra Nova Bay–Dome C (TNB– DC); Dumont d’Urville–Dome C, (DdU–DC); D66–GV5; GV7–TD; M4–GV3). Reference Frezzotti and FloraFrezzotti and Flora (2002) pointed out that the decrease in temperature with elevation shows a near-dry-adiabatic lapse rate, with good correlation along the traverse from the Ross Sea and Southern Ocean to Dome C (TNB–DC: 1.0˚C (100 m)–1, R 2 = 0.98; DdU–DC: 1.1˚C (100 m)–1, R 2 = 0.96). Despite a poor correlation, the altitudinal lapse rate was estimated for George V Land data by multiple regression analysis (D66–GV5: 0.82˚C (100 m)–1, R 2 = 0.48). The gradient is slightly lower than the previous lapse rates and is also in satisfactory agreement with a light sub-adiabatic lapse rate found by Reference LoeweLoewe (1956) in Terre Adélie (0.74˚C(100 m)–1). These data are quite different from the sub-adiabatic lapse rate (0.5˚C(100 m)–1) calculated by Reference StenniStenni and others (2000) using 10m core temperatures for the mountain areas of NVL.
(a) Firn temperature at 10–15m depth vs elevation data collected during this traverse and previous ones. The lines show linear regressions for transects (Hm is height above WGS84 ellipsoid (ma.e.). (b) Firn temperature at 10–15m depth vs longitude along the George V Land transect for core sites at 2100–2200ma.e.
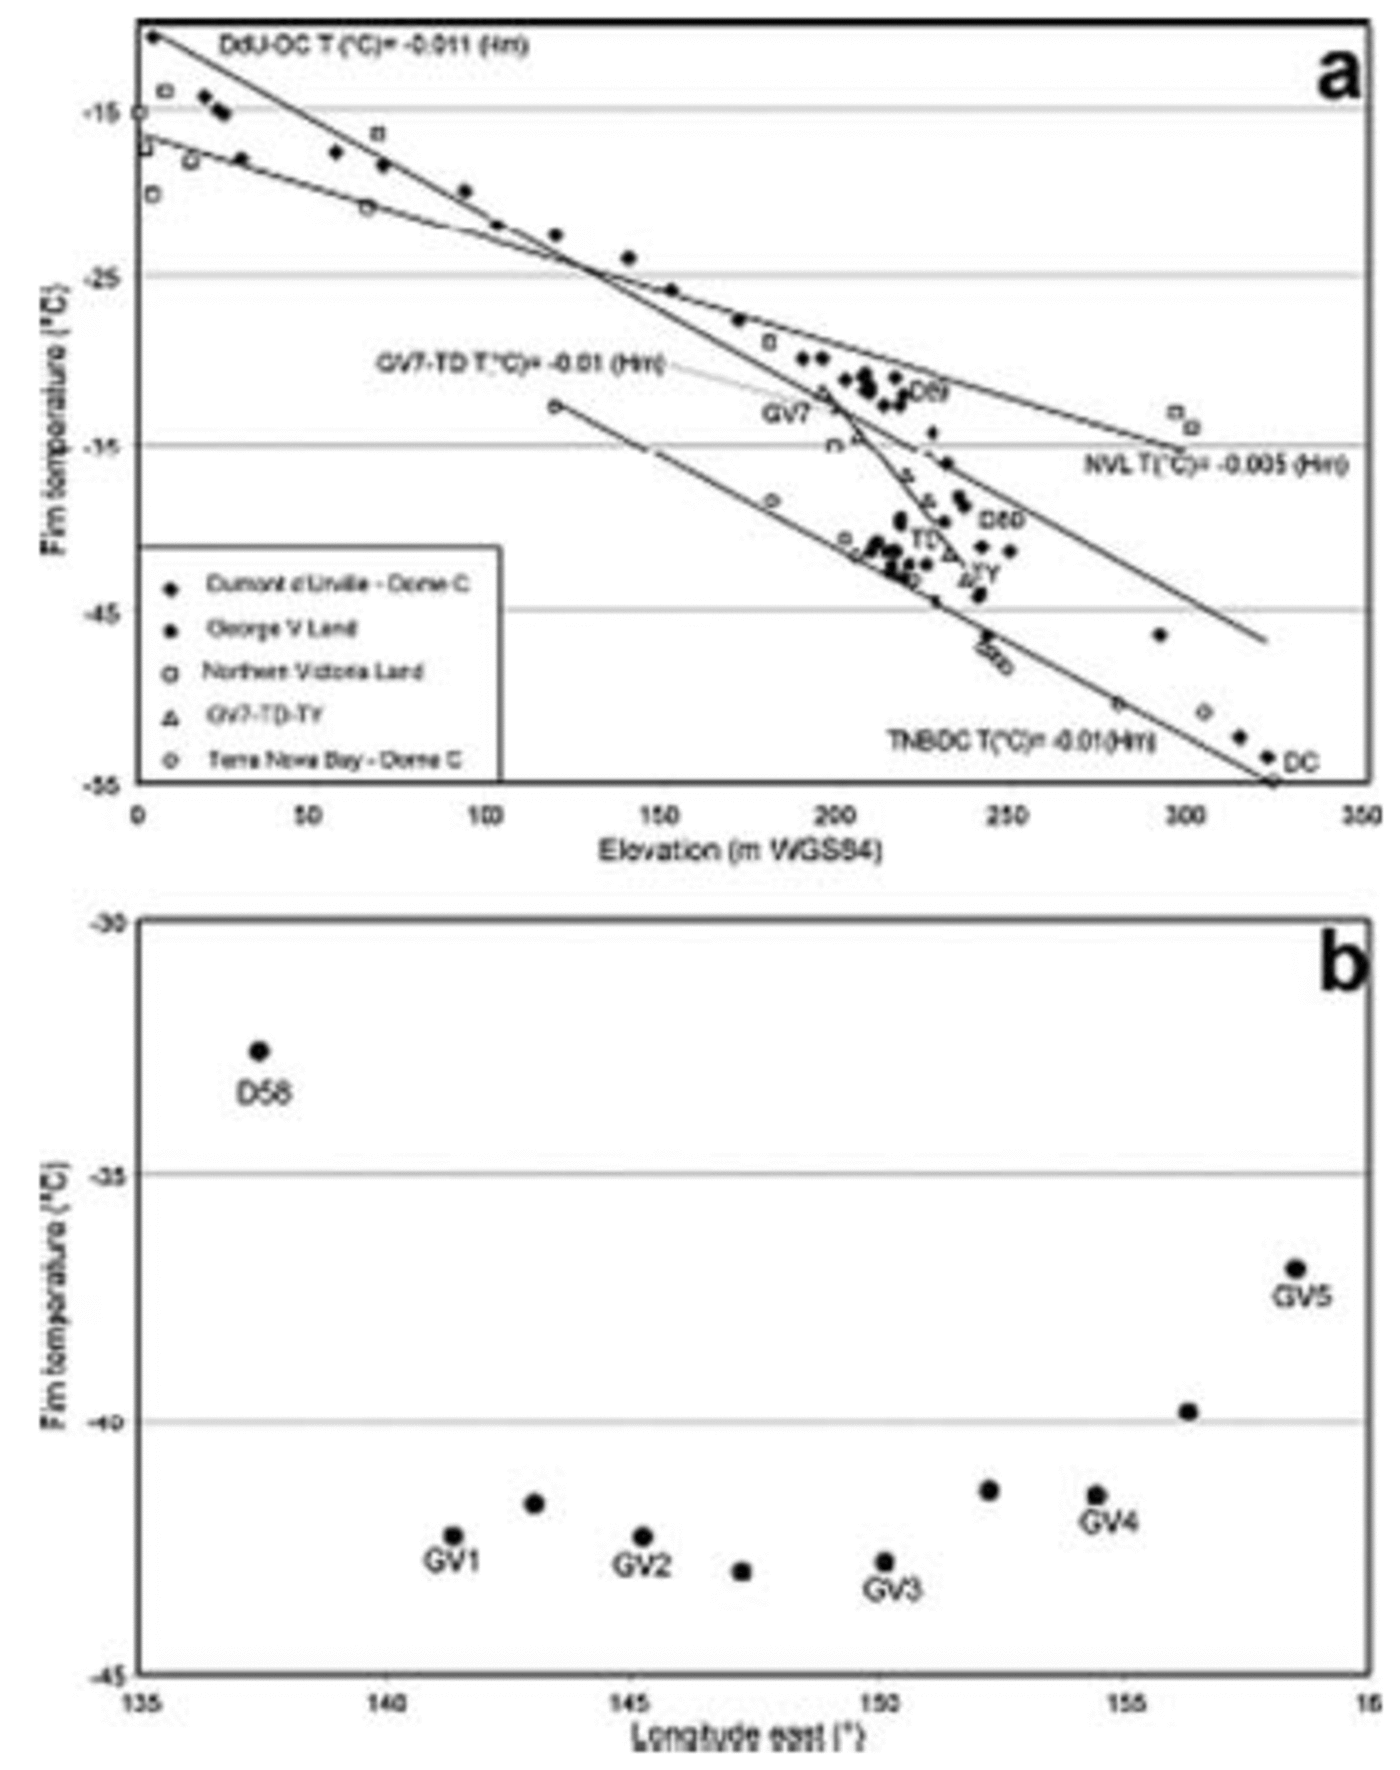
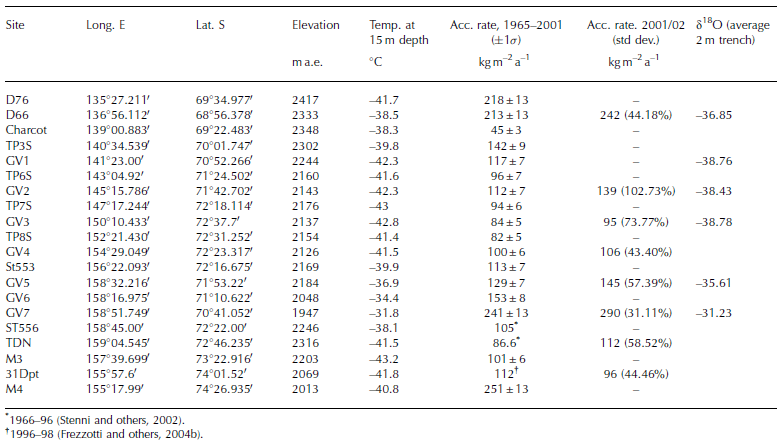
The GV7–TD profile shows (Table 1; Fig. 2a) a super-adiabatic lapse rate (R 2 = 0.97; 2.58˚C(100 m)–1). An analogous super-adiabatic lapse rate is also observed along the DdU–DC transect between D80 and D59 (Reference Frezzotti and FloraFrezzotti and Flora, 2002). We observed that Taylor Dome (TY, –43.0˚C; Reference MorseMorse and others, 1999) is along the regression line of the north–south GV7–TD transect (R 2 = 0.97), but the site between TD and TY (M3, 31Dpt and M4; Fig. 1) presents cooler conditions with adiabatic lapse rate.
Location of coring sites and compilation of accumulation rates, oxygen-isotope and temperature data of an automatic equilibration device on line with the mass spectrometer, with an analytical precision better than 0.07‰.
Analysis of firn temperature vs longitude, along the west– east transect D58–GV5 (Fig. 2b), at elevations of 2100– 2200 m (WGS84), shows higher temperatures at 135˚E and 157˚ E and lower temperatures in the central area of the traverse.
The principal determinants of annual surface temperature are elevation and latitude (Reference Fortuin and OerlemansFortuin and Oerlemans, 1990). Latitude influences the temperature by controlling the input of solar radiation and also by defining the distance from the South Pole (Reference Martin and PeelMartin and Peel, 1978). In the same way, the oceanic influence on regional climate, which is linked to the distance from open water, is seasonally dependent on the extent of sea-ice coverage, and thus latitudinally dependent (Reference Martin and PeelMartin and Peel, 1978). It seems appropriate, then, to consider the influence of both parameters on the firn temperatures. Moreover, it is thought that latitudinal lapse rates reflect the effect of continentality (Reference ReynoldsReynolds, 1981).
a Uncorrected for latitude.
bAssumed latitudinal lapse rate of –2.0˚C (˚lat. S)–1.
cDerived using multiple regression analysis on published data.
A multiple regression analysis is applied on all data from the studied area (Reference Stuart and HeineStuart and Heine, 1961; Reference PourchetPourchet and others, 1997; Reference Frezzotti and FloraFrezzotti and Flora, 2002; Reference StenniStenni and others, 2002). The resulting average altitudinal gradient for this sector of East Antarctica (67–76\˚ S, 120–165˚ E) is:

where T s is the surface temperature (˚C), elevation is in metres above WGS84 ellipsoid (m a.e.) and latitude is in degrees south. The regression coefficients with their standard deviation (R 2 = 0.89) are:
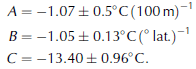
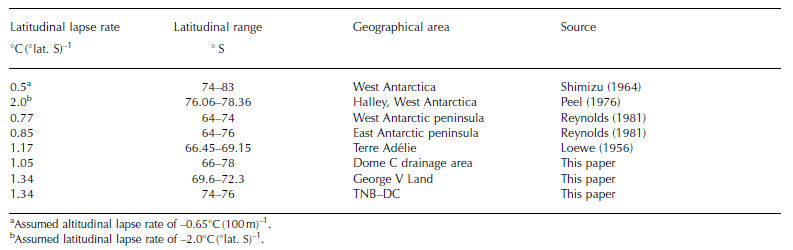
The temperature decrease vs elevation shows a near-dry-adiabatic lapse rate, of 1.07˚C(100 m)–1. The latitudinal gradient is close to those estimated by Reference LoeweLoewe (1956) in Terre Adélie (1.17˚C (˚ lat)–1), and corrected by Reference ReynoldsReynolds (1981). Reynolds normalized Loewe’s data to sea level using a dry adiabatic lapse rate of –0.986˚C (100 m)–1. The comparison with lower latitudinal lapse rates from West Antarctica (corrected and normalized data; Table 2 and 3) confirms the
postulated climatic continental regime of inland Antarctica (>200km from the coast).
Altitudinal lapse rates observed in West and East Antarctica
Latitudinal lapse rates observed in West and East Antarctica
Snow accumulation
As shown by stake measurements in other studies (Reference Koerner and CraryKoerner, 1971; Reference Petit, Jouzel, Pourchet and MerlivatPetit and others, 1982), the removal processes in the surface snow layers, due to wind transport and deposition, are very important at the 1 year scale. Reference Koerner and CraryKoerner (1971) considered that it can reasonably be assumed that the probability of no snow accumulation at any one point of a study area, during a given period, is similar to the probability of observing no accumulation in this area during the same period. Reference Petit, Jouzel, Pourchet and MerlivatPetit and others (1982) considered it necessary to collect data at a single stake for at least 4–10 years to obtain representative information (lower spatial variability) concerning the real evolution of snow accumulated in the area. Although the snow-stakes method for surface mass balance is easy to carry out, it does not take into account spatial and temporal variability.
On the slopes of the ice sheet, where katabatic wind blows, the snow accumulation is strongly influenced by wind-driven processes, and rough surfaces of sastrugi and dunes are formed. Changes in slope in the wind direction
appear to be the most important parameter between surface mass balance and topography (Reference FrezzottiFrezzotti and others, 2004b). The relation between local mass balance and topography has been reported in several inland areas of Antarctica (Reference SchyttSchytt, 1955; Reference SwithinbankSwithinbank, 1959; Reference Black and BuddBlack and Budd, 1964; Reference Gow, de Blander, Crozaz and PicciottoGow and others, 1972; Reference WhillansWhillans, 1975; NIPR, 1997). Stake farms have been installed in order to reduce the local spatial variability. The annual average value of accumulation at the stake farms appears quite consistent with β-snow accumulation for all sites (Table 1). Data from stake farms (2001–02) and β-snow accumulation (1965–2001) indicate an increase of about 15% for accumulation (Table 1). Analysis of local-scale snow accumulation variability using stake farms reveals that the sites with high accumulation (D66 and GV7) show a low standard deviation. Conversely, some sites are characterized by low accumulation rates and relatively high relative errors (up to 103% at GV2). In the case of GV2 data, some of the stakes present ‘negative’ values, i.e. an ablation process (Table 1). Consequently, the accumulation/ablation pattern resulting from the stake-farm measurements shows large standard deviations, and largely reflects the snow surface roughness (sastrugi) at all sites. High standard deviations and hiatuses in accumulation are determined by wind conditions (Reference FrezzottiFrezzotti and others, 2004b). The highest accumulation value was found at the lowest elevation and closest to the Southern Ocean (GV7) site, whereas the lowest value was found at the Charcot site. An anomalously high value of 251 ±13kgm–2 a–1 was found at the southern site M4, where an unknown surface morphology was observed on the field; this morphology is probably related to the ice dynamics of David Glacier ice stream which may have distorted the accumulation series.
aAssumed altitudinal lapse rate of –0.65˚C (100 m)–1.
bAssumed latitudinal lapse rate of –2.0˚C (˚lat. S)–1.
Analysis of the β-snow accumulation data vs firn-core temperatures along the north–south GV7–Talos Dome transect shows a good correlation (R 2 = 0.86) (Fig. 3a). The sites south of Talos Dome (M3 and 31Dpt) show higher values than the dome site. Snow radar data from Talos Dome (Reference FrezzottiFrezzotti and others, 2004a) confirm the higher accumulation in the southern sector of the dome, in the Ross Sea drainage area.
(a) Snow accumulation rates vs firn temperature along the George V Land and GV7–TD transects; the line shows the linear regression for GV7–TD. (b) Snow accumulation rates vs longitude along the George V Land transect (GV1–GV5) for core sites at 2100–2200ma.e.
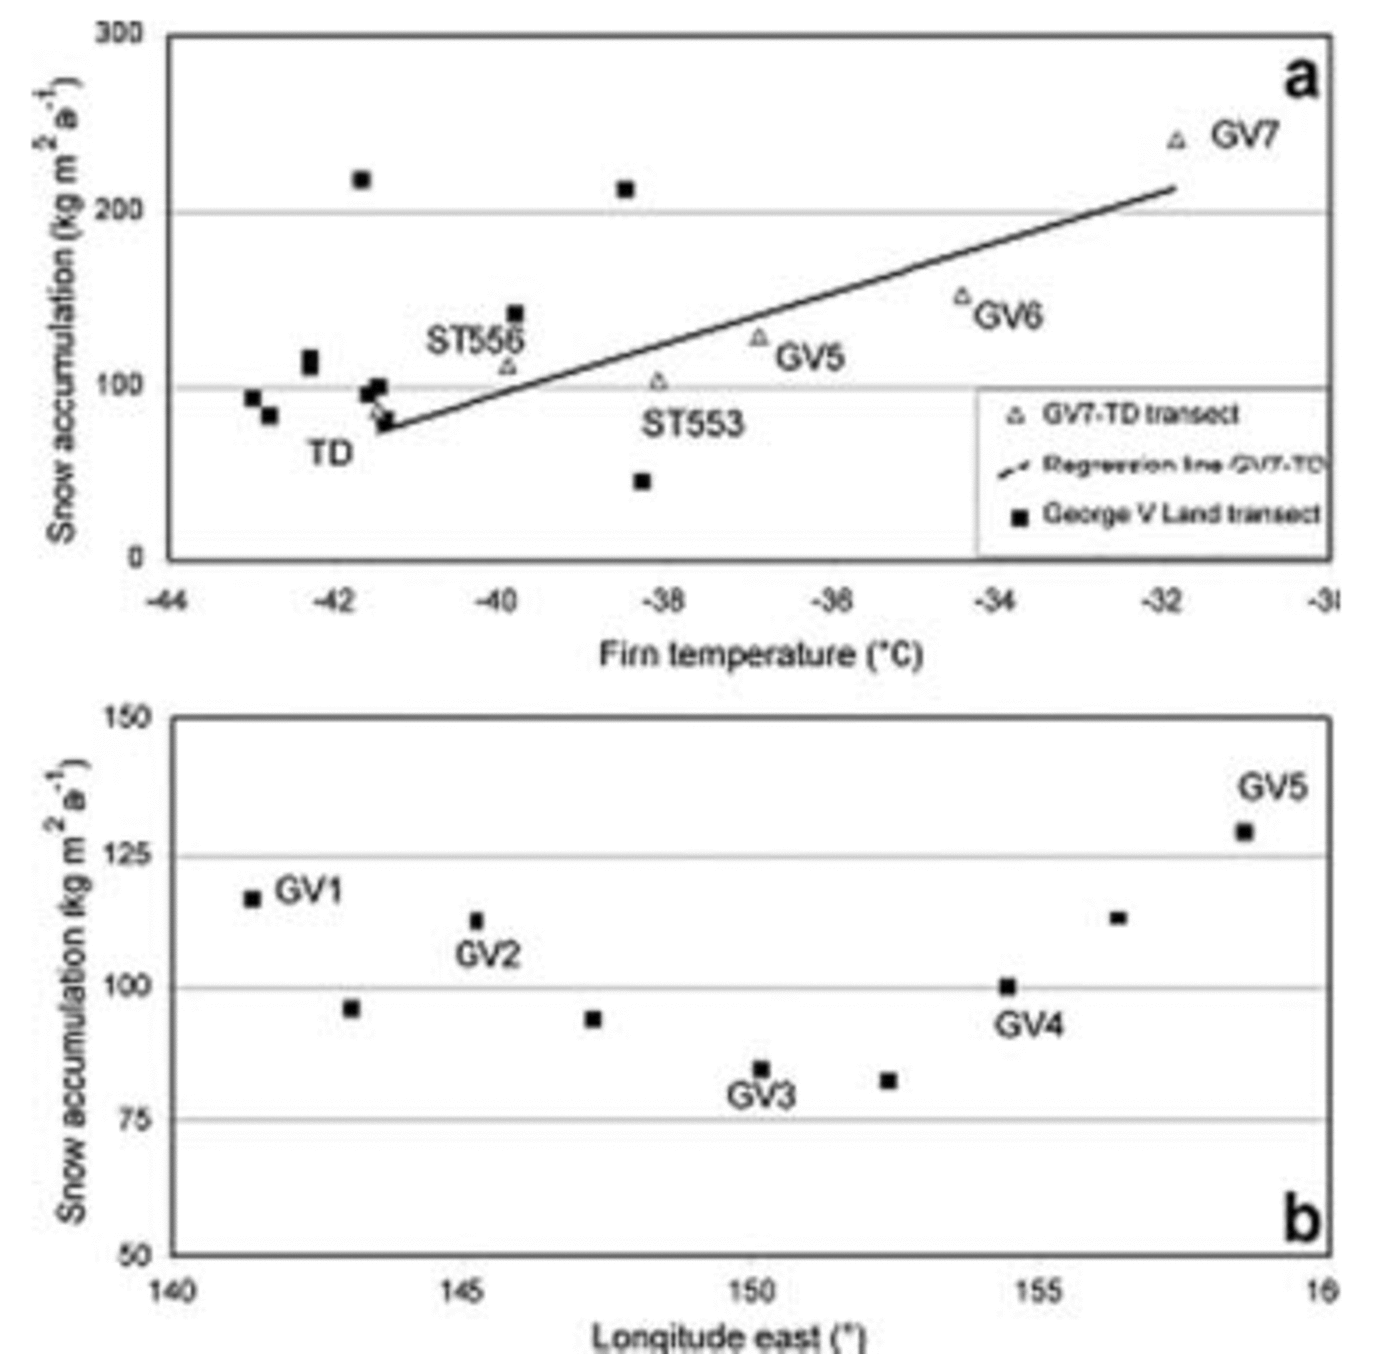
Comparison between β-snow accumulation rates and firn-core temperatures along the west–east transect (D66–GV5) shows a general trend, but with very scattered data (Fig. 3a). Analysis of β-snow accumulation vs longitude, along the west–east GV1–GV5 transect, at 2100–2200ma.e., reveals higher temperatures at 135˚ E and 157˚ E and lower temperatures in the central part of the traverse (GV3–TP8S).
The β-snow accumulation values were compared with previous surface mass-balance map compilations (Reference Vaughan, Bamber, Giovinetto, Russell and CooperVaughan and others, 1999; Reference Giovinetto and ZwallyGiovinetto and Zwally, 2000), revealing a general overestimation of the surface mass balance, with an average of about 33%. Reference FrezzottiFrezzotti and others (2004b) pointed out analogous overestimation for the transects that arrive in Dome C, from Dumont d’Urville and Terra Nova Bay. This large difference is due to large gaps in the observation coverage of East Antarctica: prior to our study the only accumulation data available in the D66–GV5 area were acquired by the 1959/60 US traverse using snow-pit stratigraphy (Reference Stuart and HeineStuart and Heine, 1961). Snow accumulation rates determined in a nearby area through the use of snow-pit stratigraphy have been found to overestimate true values (Reference StenniStenni and others, 2002; Reference FrezzottiFrezzotti and others, 2004b).
Oxygen Isotopes
Linear relationships between δ18O and firn temperatures (T) at sampling sites have been reported for different Antarctic regions (e.g. Reference Lorius and MerlivatLorius and Merlivat, 1977; Qin and others, 1994; Reference StenniStenni and others, 2000; Reference PropositoProposito and others, 2002). The geographical dependence of this spatially derived relationship relies mainly on differences in the regional climate conditions and in moisture-source regions supplying precipitation to different parts of Antarctica.
The spatial δ18O/T relationships for the two north–south transects are shown in Figure 4. The surface temperatures used to reconstruct the least-squares regressions were computed by interpolating the available firn temperatures at the main core sites, taking into account the elevation. Figure 4 also reports other linear regressions from previous studies of this sector of East Antarctica:
Least-squares regression lines for surface snow δ18O vs temperature along the two north–south transects of the 2001/02 ITASE traverse; grey lines show the TNB–DC regressions (Reference PropositoProposito and others, 2002); black line shows the NVL regression (Reference StenniStenni and others, 2000); dashed line shows the Terre Adélie regression (Reference Lorius and MerlivatLorius and Merlivat, 1977). See text for details.
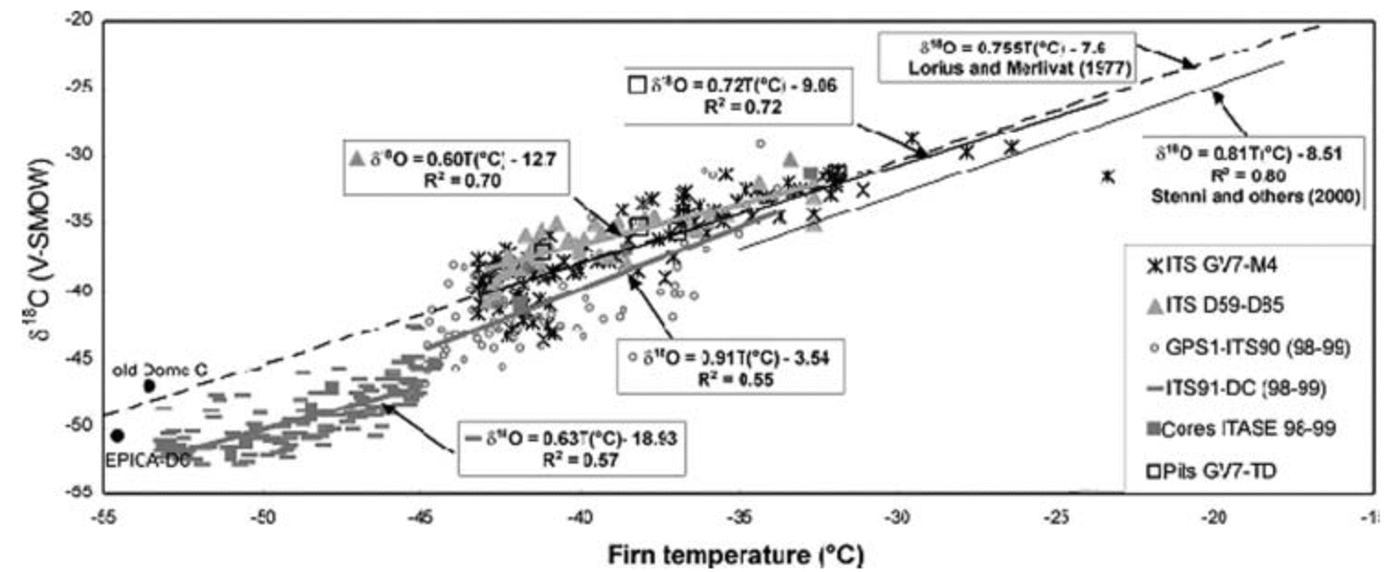
the Reference Lorius and MerlivatLorius and Merlivat (1977) equation obtained from the Dumont d’Urville–Dome C traverse data (T < –20˚C) with a δ/T gradient of 0.755‰˚C–1;
the Reference StenniStenni and others (2000) equation obtained in NVL for coastal core sites with a δ/T gradient of 0.81‰˚C–1;
the Reference PropositoProposito and others (2002) data obtained from surface snow samples (1m cores) collected along the TNB–DC traverse. This dataset was split into two groups with surface temperatures below or above –45˚C (currently between sites M2 and MdPt). The data seem to be aligned along two regression lines with δ/T gradients of 0.91‰˚C–1 and 0.63‰˚C–1 for T > –45˚C and T < –45˚C respectively; the latter is in contrast to the δ/T gradient of 0.99‰˚C–1 calculated for the whole dataset, while the former is in agreement with the data of NVL. This could be due to different moisture-source regions, with the NVL and T > –45˚C region probably more influenced by precipitation coming from the Ross Sea. The sites with T < –45˚C probably receive moisture from the Indian Ocean through the western Dome C area (Reference Delaygue, Masson, Jouzel, Koster and HealyDelaygue and others, 2000; Reference Reijmer, van den Broeke and ScheeleReijmer and others, 2002). The δ18O values for these sites are more negative than those for Dome C, probably due to isotope depletion induced by a ‘rain-shadow’ effect on the eastern Dome C area.
In the case of the new data collected along the two north– south transects (GV7–M4 and D59–D85), both the data and the δ/T gradients are in quite good agreement with the Dumont d’Urville–Dome C traverse (Reference Lorius and MerlivatLorius and Merlivat, 1977), probably suggesting common moisture sources. Through a general atmospheric circulation model which tags the origin of water, Reference Delaygue, Masson, Jouzel, Koster and HealyDelaygue and others (2000) showed that the Dome C region is mainly influenced by the Indian Ocean.
The R 2 value of all regression lines calculated using the surface snow samples is not high due to the large scattering of the data. Indeed, surface snow-samples data have some limitations:
the snow deposited in the top metre may represent different years depending on the accumulation rate;
the seasonal distribution of accumulation, and its inter-annual variability may affect the mean δ18O values (Reference SchlosserSchlosser, 1999);
wind-driven phenomena may also introduce a bias in the δ values. In the case of transect GV7–M4, the R 2 increases from 0.72 to 0.95 (not shown in Fig. 4) considering only the data obtained from the snow-pit averages (Reference BecagliBecagli and others, 2004; see Table 1 for the mean δ18O). Unfortunately, due to the low number of data available at the moment for the snow pits (and cores), we cannot consider the calculated regression lines presented in this paper to be definitive.
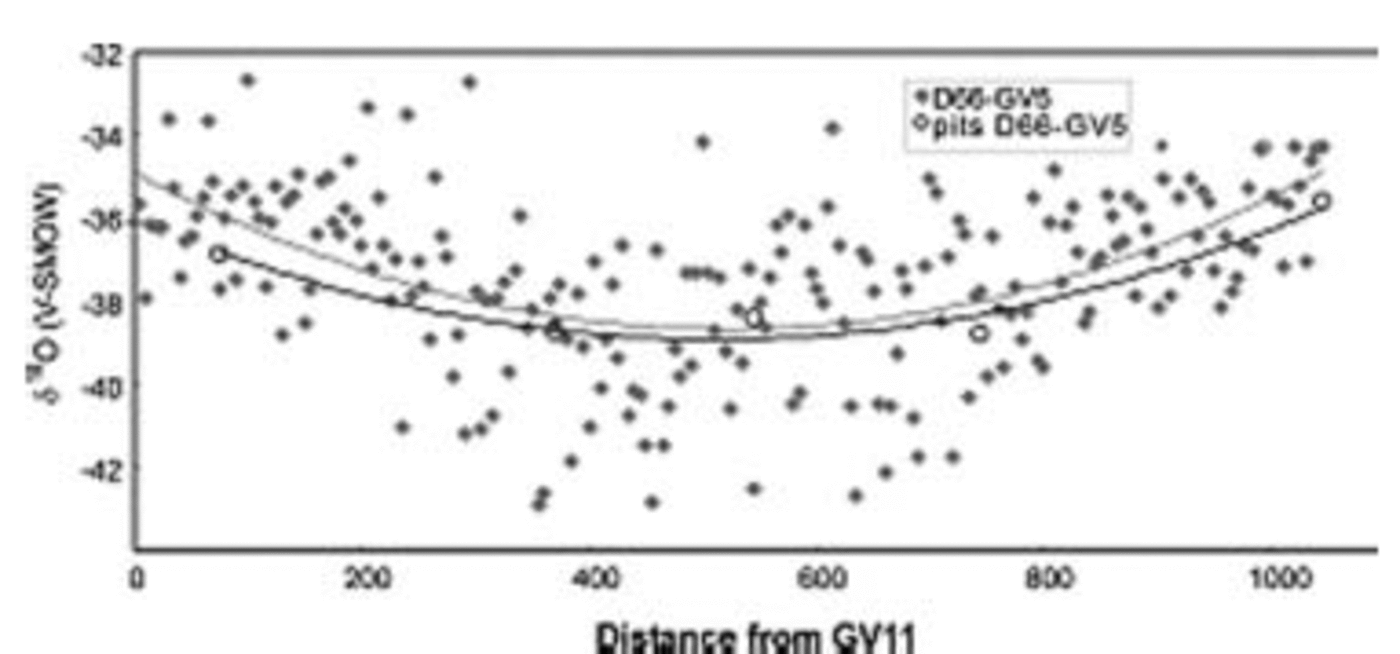
The δ18O data obtained from the 1m cores collected along the west–east (D66–GV5) transect are reported as a function of the distance (Fig. 5) from the GV11 site (near D66). In spite of the high scatter encountered along this transect, the data seem to follow a pattern already found in the case of both temperature and accumulation rates: higher δ18O values at both sides of the transect and lower and more scattered values in the central part. This is also confirmed by the mean δ18O values obtained from the snow pits (Fig. 5).
δ18O values vs distance from site D66 along the west–east (D66–GV5) transect; full diamonds refer to 1m core samples; open circles refer to average snow-pit values.
Conclusion
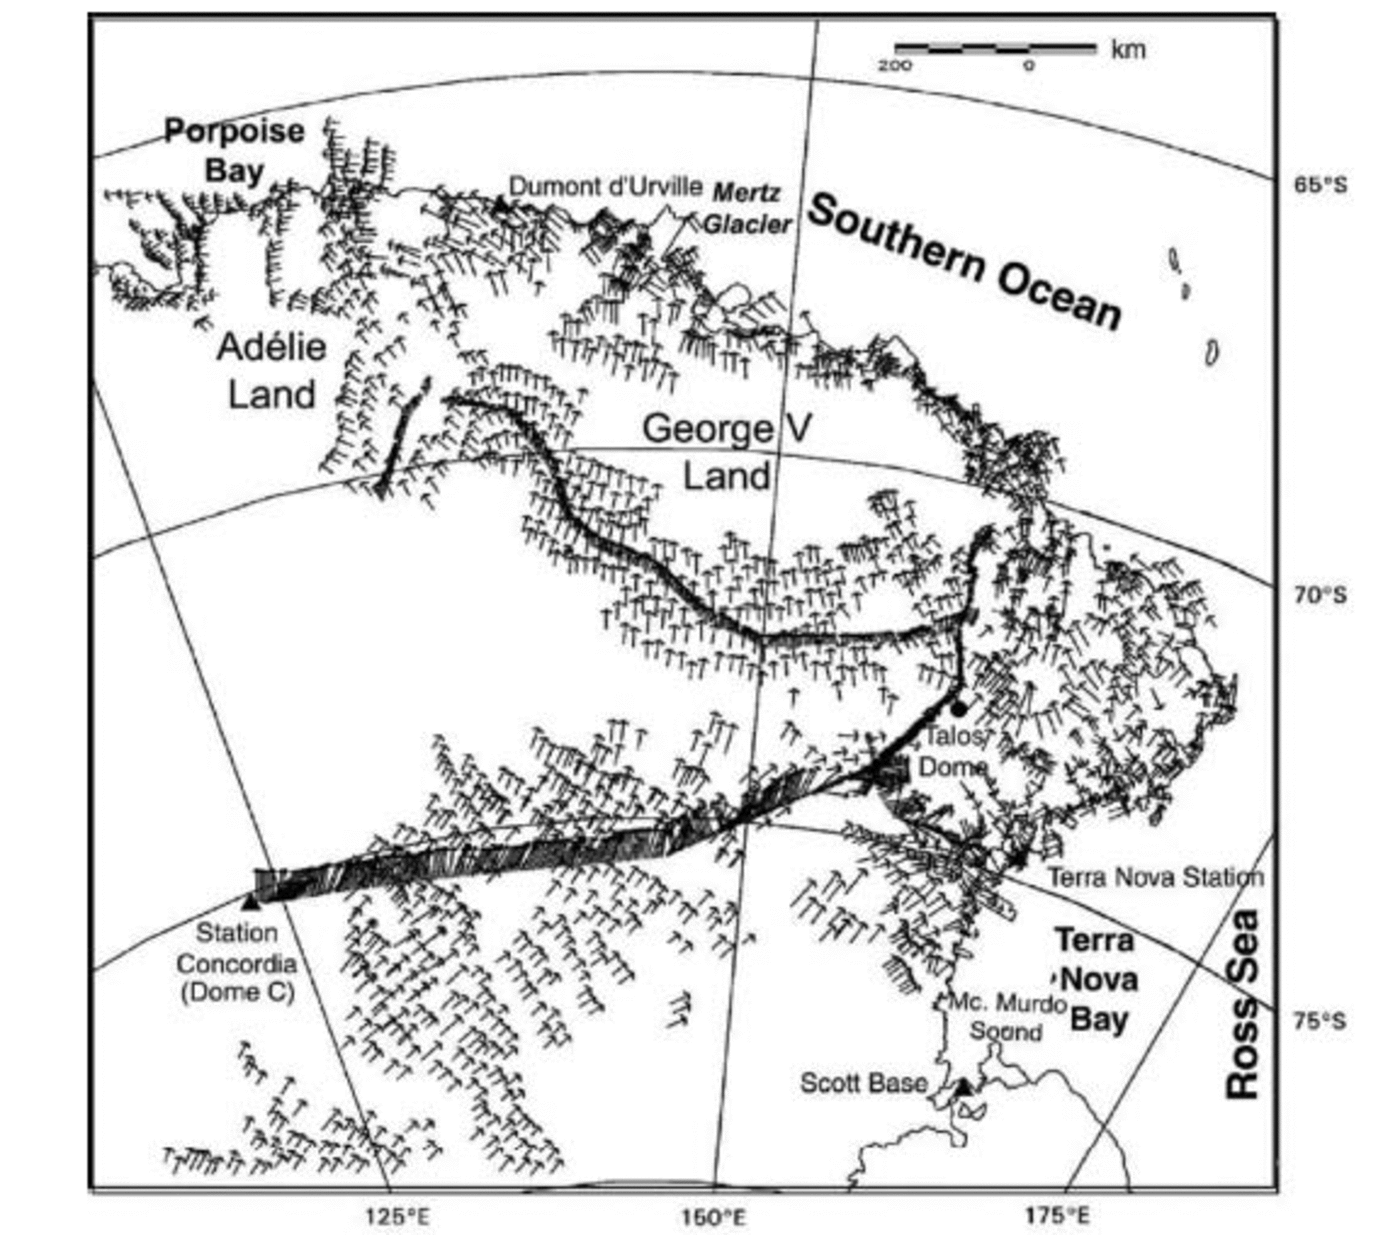
Analysis of firn temperature and snow accumulation rates using both β and stake farms and oxygen isotopes, show lower accumulation and cooler conditions in the central part of the west–east transect (GV1–GV5). We observe high accumulation rates and warmer conditions at the beginning and at the end of this transect (GV1–GV5). Analysis of aeolian morphology surveyed by satellite image and along the traverse (Reference Mancini and FrezzottiMancini and Frezzotti, 2003) shows that the katabatic wind coming from the eastern sector of Dome C is channelled in the central part of the transect (Fig. 1 and 6). Wind turns to the left under the action of the Coriolis force in the western part of the transect (G1–D66). The wind in this area presents direction with low angle with respect to the contour line. The lower accumulation, cooler temperature and the lower δ18O values suggest more continental conditions. The intrusion of atmospheric moisture and the penetration of synoptic cyclonic systems are not as intense in this area as along the eastern (TD–GV7) and western sectors (D66). The lower intrusion could be correlated with the persistence of higher atmospheric pressure in the central area of the west–east transect (GV2–GV4) due to the channelling of katabatic wind in this area. The higher variability of snow accumulation measured with the stake farm and represented by high sastrugi and hiatus in accumulation also gives evidence of the persistence of katabatic wind in this area (GV2 and GV3). The Charcot site shows a very low accumulation value (45 ± 3 kg m–2 a–1). Meteorological observations (during 1958) at the Charcot site show that for that year, there was a total of 326 days of blowing snow, with a monthly mean wind speed of 9.2 ms–1 (Pettré and others, 1986). Charcot low accumulation could be correlated to a wind-driven sublimation process (Reference FrezzottiFrezzotti and others, 2004b). Temperature, isotope and snow accumulation present good correlation (R 2 > 0.8), and the spatial pattern is correlated with the katabatic-wind-source basin and the moisture-source region. The pattern and flow direction of katabatic winds are good proxies of air-mass flow coming from the plateau and of storm tracks.
Wind-field direction from satellite and field aeolian morphology (after Reference Mancini and FrezzottiMancini and Frezzotti, 2003).
Acknowledgements
Research was carried out in the framework of the Project on Glaciology of the PNRA–MIUR and financially supported by PNRA Consortium through collaboration with ENEA Roma, and is also supported by the French Polar Institute (IPEV). This work is a French–Italian contribution to the ITASE project. This work is a contribution to the ‘European Project for Ice Coring in Antarctica’ (EPICA), a joint European Science Foundation (ESF)/European Commission (EC) scientific programme, funded by the EC and by national contributions from Belgium, Denmark, France, Germany, Italy, the Netherlands, Norway, Sweden, Switzerland and the United Kingdom. The authors wish to thank members of the PNRA 2001/02 expedition who provided assistance at Terra Nova Bay station, and everyone in Italy who helped prepare the traverse. Thanks are due to M. Giovinetto and D. Vaughan, who provided surface mass-balance compilations.



