Introduction
Osteopontin (OPN) is a secreted glycosylated phosphoprotein firstly identified in the matrix of bone (Oldberg et al., Reference Oldberg, Franzen and Heinegard1986), which is one of the molecules constructing the micro-environment in oviduct. Recent studies have confirmed OPN expression in various tissues and cells, including kidney (Lorenzen et al., Reference Lorenzen, Martino, Scheffner, Bröcker, Leitolf, Haller and Gwinner2012), vascular tissue (Hag et al., Reference Hag, Pedersen, Christoffersen, Binderup, Jensen, Jørgensen, Skovgaard, Ripa and Kjaer2012), immune cells (Wang & Denhardt, Reference Wang and Denhardt2008), and tumour cells (Yamaguchi et al., Reference Yamaguchi, Shao, Sharif, Du, Myles, Merchant, Harsh, Glantz, Recht, Morser and Leung2013). As a key member of the extracellular cell matrix (ECM) and a secreted cytokine in body fluid (Erikson et al., Reference Erikson, Way, Chapman and Killian2007; Yamaga et al., Reference Yamaga, Tsuji, Miyatake, Yamada, Abula, Ju, Sekiya and Muneta2012), OPN manifests multifunction in regulating cell–cell interaction, cell adhesion, invasion, differentiation and migration. As an important regulator for many physiological and pathological processes, OPN is involved in inflammatory responses, immune cell function, tissue reconstruction, vascular remodeling, and biomineralization through interaction with specific receptors (Chabas et al., Reference Chabas, Baranzini, Mitchell, Bernard, Rittling, Denhardt, Sobel, Lock, Karpuj, Pedotti, Heller, Oksenberg and Steinman2001; Denhardt et al., Reference Denhardt, Noda, O’Regan, Pavlin and Berman2001; Qi et al., Reference Qi, Huang, Pan, Li, Zhang, Fang, Liu, Meng, Zhang and Liu2010).
In the reproductive system, OPN expression is investigated widely in oviducts (Makrigiannakis et al., Reference Makrigiannakis, Karamouti, Petsas, Makris, Nikas and Antsaklis2009), uteri (Hao et al., Reference Hao, Murphy, Spate, Wax, Zhong, Samuel, Mathialagan, Schatten and Prather2008), placenta (Briese et al., Reference Briese, Oberndorfer, Patschenik, Schulte, Makrigiannakis, Löning and Bamberger2005), testis, epididymis, sperm and accessory sex gland fluid (Hao et al., Reference Hao, Mathialagan, Walters, Mao, Lai, Becker, Li, Critser and Prather2006; Erikson et al., Reference Erikson, Way, Chapman and Killian2007) of human, bovine, pig and so on, involved with pregnancy recognition, embryo implantation, invasion of trophoblastic cells and development of conceptuses (Bazer et al., Reference Bazer, Song, Kim, Erikson, Johnson, Burghardt, Gao, Carey Satterfield, Spencer and Wu2012). Especially in behaviours of gametes and embryos, our previous results have shown that OPN expression regulated by estrogen may play an important role during embryo implantation by activating blastocyst competence and facilitating the endometrium to be acceptable for the active blastocyst (Xie et al., Reference Xie, Qi, Chen, Xu, Liu and Yang2013).
Furthermore, OPN has been found in oviduct fluids of a wide range of species. In bovine, the oviduct was proved to be a source of OPN and several integrins, the differential expression pattern throughout the estrous cycle indicated that OPN–integrin interaction has an indispensable function in normal oviduct physiology, which may potentially influence the interaction between gametes or embryo and epithelium (Gabler et al., Reference Gabler, Chapman and Killian2003). But in humans, the evidence for change of OPN or integrins expression throughout the menstrual cycle is limited (Brown et al., Reference Brown, Shaw, Critchley and Horne2012). Thus, the characteristics of OPN expression in oviduct is controversial for different species. Expression of OPN in mouse oviducts and its function in mouse fertilization and preimplantation embryo development remain unclear.
This study aimed to characterize the expression pattern of OPN in mouse oviducts during the estrous cycle and early pregnancy (days 1–5) by reverse transcription polymerase chain reaction (RT-PCR) and immunohistochemistry methods, and to assess the function of OPN in mouse fertilization, cleavage and preimplantation embryo development in vitro.
Materials and methods
Ethics statement
All the animal experiments were performed in the Center for Animal Experiment of Renmin Hospital of Wuhan University, China. Housing standards, protocols, as well as all procedures involving animals were in accordance with the guidelines of Animal Use and Care Committee of Wuhan University.
Animals and care
Unmated female (6–12 weeks old, weighing 18–30 g) and male (8–12 weeks old, weighing 25–35 g) specific pathogen-free Kunming-white mice were purchased from Tongji Medical College, Huazhong University of Science and Technology Laboratory Animal Center. All mice were housed under normal conditions, with a rodent diet and water available freely, keeping a 12 h light–dark regimen.
Collection of oviduct tissue samples
Oviducts from unmated mice at every stage of the estrous cycle or the pregnant and pseudopregnant mice on days 1–5 (day 1 = day of plug detection) were collected after the animals were killed by cervical dislocation. The estrous cycle stages were divided into proestrus, estrus, metaestrus and diestrus by vaginal cell smears. To get pregnant and pseudopregnant mice, female mice were treated by intraperitoneal injection of 10 IU pregnant mare serum gonadotropins (PMSG; Ningbo Second Hormone Factory, Ningbo, China) followed by 10 IU human chorionic gonadotropin (HCG; 10 IU for each mouse; Livzon Pharmaceutical Group Inc., Zhuhai, China) 48 h later for superovulation, then mated with male mice whose vas deferens were ligated or not by being caged together at the ratio of 1:1. Mice post coitum were selected by checking vaginal plugs on the next day 8:00 a.m., the oviducts from female mice with vaginal plugs were used to detect the expression of OPN on pregnant or pseudopregnant days 1–5. The oviduct tissues were immediately fixed with 4% paraformaldehyde (Sigma Company, St. Louis, USA) for immunochemistry or frozen at –70°C for RT-PCR with three biological replicates (n = 3/stage).
Sperm and oocyte collection
At 14–16 h after superovulation as mentioned above, the female mice were killed by cervical dislocation. Oviducts were dissected and matured oocytes were released by tearing the tubal ampulla. Oocytes were then transferred into single step medium (SSM) (Irvine Scientific, CA, USA) pre-warmed to 37°C. Male mice were also killed by cervical dislocation, and cauda epididymides were obtained at slaughter and removed into eppendorf (EP) tubes filled with SSM pre-warmed to 37°C, the surrounding fat was carefully removed. Sperm were recovered by cutting the cauda epididymides into pieces to cultivate. After 20 min incubation at 37°C and 5% CO2, the grinded epididymal tissue was separated from the released spermatozoa.
In vitro fertilization
The oocytes obtained after superovulation were pre-incubated in SSM medium containing 0, 0.01, 0.1 and 1.00 mg/l anti-OPN antibody (Santa Cruz, CA, USA) in vitro for 1 h. Subsequently, every 6–8 oocytes were distributed in 30 μl fertilization droplets and inseminated with untreated sperm at the concentration of 1 × 10⁶/ml. Spermatozoa and oocytes were co-incubated for 12 h at 37°C in an atmosphere of 5% CO2 in air with the surface covered by liquid paraffin for external fertilization, the procaryon and second polar body were observed as the fertilization index. Similarly, in another experiment, the sperm were incubated in SSM supplemented with 0, 0.01, 0.1 and 1.00 mg/l in vitro for 1 h. Afterwards, the treated sperm were co-incubated with untreated oocytes in the same way.
In vitro embryo culture
For in vitro embryo culture, pregnant mice with vaginal plugs were killed after injection of HCG 14–16 h or 38–40 h, embryos at pronuclear stage or 2-cell stage were collected by flushing the oviducts with phosphate-buffered saline (PBS), and transferred into SSM under mineral oil (Sigma), supplemented with anti-OPN antibody at concentrations of 0, 0.01, 0.1 or 1.00 mg/l respectively. These embryos were incubated at 37°C under 5% CO2 in air in vitro. Embryos at the pronuclear stage were incubated for 24 h to calculate cleavage rate. Two-cell embryos were incubated for 4 days to record the number of 4-cell and 8-cell embryos and blastocysts respectively. Thus the influence of anti-OPN antibody on preimplantation embryo development could be evaluated.
RT-PCR
Total RNA was isolated from frozen oviducts using Trizol reagent (Invitrogen, California, USA) according to the manufacturer's instruction. The quantity of total RNA was determined by spectrometry. RNA was reverse transcribed and PCR was performed using PrimeScript RT-PCR kits (Fermatas, UT, USA). Analysis of glyceraldehyde-3-phosphate dehydrogenase (GAPDH) mRNA was used for normalization to verified RNA integrity and accuracy of loading.
Specific primers used for RT-PCR of OPN were designed using selected gene sequences and were confirmed in previous experiments. Primer sequences are as follows: sense 5′-GCAGACACTTT-CACTCCAATCG-3′ and antisense 5′-GCCCTTTCCG-TTGTTGTTCTG-3′; RT-PCR primers for GAPDH mRNA are sense 5′-ACCACAGTCCATGCCATCAC-3′ and antisense 5′-TCCACCACCCTGTTGCTGTA-3′. The expected sizes of these RT-PCR products were 238 bp and 496 bp respectively. Partial cDNA for mouse OPN was amplified as follows: (1) denaturation step, 94°C for 3 min; (2) amplification step, 94°C for 30 s, 50°C for 45 s, and 72°C for 1 min for 40 cycles; and (3) elongating step, 72°C for 10 min. GAPDH was amplified simultaneously under the same conditions, with a cycle number of 30. The amplified products were examined using electrophoresis on 1.5% agarose gels. DNA bands were photographed under ultraviolet (UV) light, and the ratio of band intensity between OPN and GAPDH was estimated by Gel-pro Analysis software for semi-quantitative analysis.
Immunohistochemistry
Oviduct tissues fixed by 4% paraformaldehyde were embedded in paraffin after sequential ethanol dehydration and sliced into 3–5-μm sections. The sections were treated with 3% hydrogen peroxide solution for 10 min to block endogenous peroxidase activity and 5% bovine serum albumin (BSA; Amresco, OH, USA) for 20 min to suppress non-specific activity. Then, primary mouse anti-OPN monoclonal antibody (1:100 dilution in PBS; Santa Cruz, CA, USA) was incubated on sections overnight at 4°C. PBS was used to replace the primary antibody for the control. The colour was developed with common two-step immunohistochemical staining method (DAKO, Glostrup Kommune, Denmark); specifically, tissue sections were incubated with the biotinylated secondary antibody and avidin–biotin peroxidase complex, reacted with DAB colourant for colour developing, and counterstained with hematoxylin. The positive signal was visualized as brown granules. The US Sample PCI image analysis system was applied for the semi-quantitative study. For each section, the value of the incident light of the blank space was calculated for calibration, five visual sights were randomly selected, and absorbance value of each sight was measured to calculate an average, which was the mean optical density (OD) value of the section.
Statistical analysis
Data were presented as mean ± standard deviation (SD) and percentage. The differences in the expression of OPN among groups were assessed by one-way analysis of variance (ANOVA) followed by least significant difference (LSD) test. The rate of fertilization and the proportion of mice embryos at different stages were determined using chi-squared test analysis. Data were analyzed by the statistical analysis software SPSS version 13.0 (SPSS Inc., Chicago, USA). A P-value < 0.05 was considered to be statistically significant.
Results
OPN mRNA and protein expression levels in mouse oviducts at different estrous stages
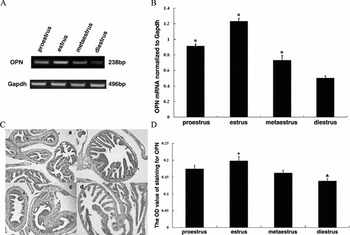
The expression of specific OPN transcripts in the oviduct during the estrous cycle was confirmed by RT-PCR (Fig. 1A), and the electrophoresis results showed a single band at the expected sizes for both OPN (238 bp) and GAPDH (496 bp), respectively. The OPN mRNA level fluctuated markedly at the different stage of estrous cycle (Fig. 1B), which was highest in estrus, followed by proestrus, then metestrus and lastly diestrus (P < 0.01).
Expression pattern of osteopontin (OPN) mRNA and protein in mouse oviducts during the estrous cycle (n = 3 samples per stage). (A) RT-PCR analysis for OPN in total RNA from oviducts, cross-sectional gels of amplicons produced for OPN and GAPDH are presented. (B) The semi-quantification of OPN transcriptional level (mean ± standard deviation (SD)). *P < 0.01, compared with other groups. (C) Immunohistochemical staining (×200 magnification) of OPN on the mouse oviduct during the estrous cycle. a: proestrus stage, b: estrus stage, c: metaestrus stage, d: diestrus stage. In the oviduct, positive immunolabelling for OPN occurs mainly in the ciliated and non-ciliated epithelium (arrows), as well as serosa casually (arrowheads). No reaction was seen in the submucosa and muscularis (asterisks). (D) Mean optical density (OD) value of OPN by immunohistochemistry in different estrous staged group. *P < 0.01, ▲P < 0.05, compared with other groups. The data shown are three biological replicates and are illustrated as mean ± standard deviation (SD).

The immunohistochemistry for mouse oviducts demonstrated that OPN protein is localized mainly in epithelium at all stages of estrous cycle, including ciliated and non-ciliated epithelial cells. The positive signal was also found occasionally in serosa, while negative in submucosa and muscularis (Fig. 1C). To compare the OPN protein expression levels at different stages of estrous cycle, the OD value of immunostaining signal for OPN was evaluated by the US Sample PCI image analysis system (Fig. 1D). In accordance with the results of RT-PCR, the OPN protein expression was highest in estrus (0.198 ± 0.013) and lowest in diestrus (0.138 ± 0.008) (P < 0.01), but no significant difference was detected between proestrus (0.174± 0.011) and metestrus (0.162 ± 0.008).
OPN mRNA and protein expression levels in mouse oviduct during normal pregnancy and pseudopregnancy
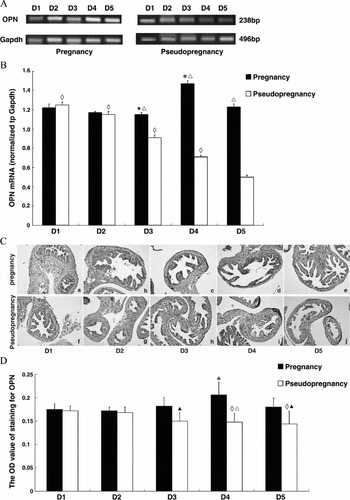
Compared with days 1–3 of pregnancy, the OPN mRNA expression level was significantly increased in mouse oviducts on day 4 (P < 0.01). Besides, the level of OPN transcripts on day 5 were also significantly higher than that on day 3 (P < 0.05), while the differences among other groups had no statistical significance. With respect to pseudopregnant mice, the level of OPN mRNA decreased significantly as pseudopregnant time extended (P < 0.05). Compared with normal pregnancy, OPN mRNA expression levels on days 3–5 of pseudopregnancy were significantly lower (P < 0.01) (Fig. 2A, B).
Expression pattern of osteopontin (OPN) mRNA and protein in the oviducts of pregnant and pseudopregnant mice (n = 3 samples per stage). (A) Representative amplified bands of RT-PCR for OPN and GAPDH mRNA. (B) Semi-quantitative analysis of RT-PCR results (mean ± standard deviation (SD)). *P < 0.01, compared with the other days of pregnancy; ★P < 0.05, compared with the day 5 of pregnant; ◇P < 0.01, compared with the other days of pseudopregnancy; □P < 0.01, compared with the corresponding day of pseudopregnancy. (C) Immunohistochemical staining (×200 magnification) of OPN on the days 1–5 of pregnant and pseudopregnant mice oviducts. a–e: pregnant groups, f–j: pseudopregnant groups. (D) Mean OD value of OPN by immunohistochemistry in pregnant and pseudopregnant groups. *P < 0.01, compared with the other days of pregnancy; ◇P < 0.01, compared with the day 1 of pseudopregnancy;▲P < 0.05, △P < 0.01, compared with the corresponding day of pregnancy. The data shown are three biological replicates and are illustrated as mean ± SD.

Immunohistochemistry displayed the differential expression pattern of OPN protein in oviducts from normal pregnant and pseudopregnant mice, which was correspond to the results of RT-PCR. The OPN immunostaining was positive in the epithelium of oviducts at different stages (Fig. 2C). In normal pregnant mice, the OD value on day 4 was visibly higher than days 1–3 and day 5 (P < 0.01), while there was no significant difference between days 1–3 and day 5. In pseudopregnant mice, the OD values on days 4 and 5 were obviously lower than that of day 1 (P < 0.05). Differences between normal pregnancy and pseudopregnancy in the same period were also analyzed. On days 1 and 2 of normal pregnancy and pseudopregnancy, the OD values of OPN immunostaining showed no evident change (P < 0.05). While on days 3–5, OPN OD values of normal pregnancy was obviously higher than that of pseudopregnancy (P < 0.05, P < 0.01, P < 0.05) (Fig. 2D).
Effect of anti-OPN antibody on in vitro fertilization
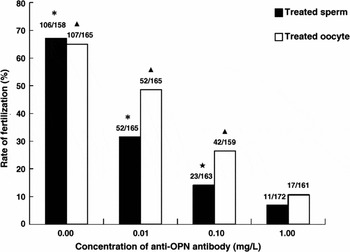
As the OPN expression level in mouse oviducts had a cyclic change during estrus cycle, we hypothesized that OPN could affect mouse embryo fertilization. Oocytes or semen were treated with different concentrations of anti-OPN antibody (0.01 mg/l, 0.1 mg/l or 1.00 mg/l) respectively as elucidated before, the results showed that the fertilization rates of oocytes were significantly decreased compared with the control group (P < 0.01) in a concentration- dependent manner (Fig. 3).
Percentage of fertilized eggs following exposure of sperm or oocytes to anti-OPN antibody treatments. Numbers of fertilized oocytes versus total number of oocytes studied are listed on the top of each column. *P < 0.01/▲P < 0.01, compared with other groups of treated sperm/oocytes; ★P < 0.05, compared with the group of sperm exposed to 1.00 mg/l anti-OPN antibody.

Effect of anti-OPN antibody on cleavage and preimplantation embryo development
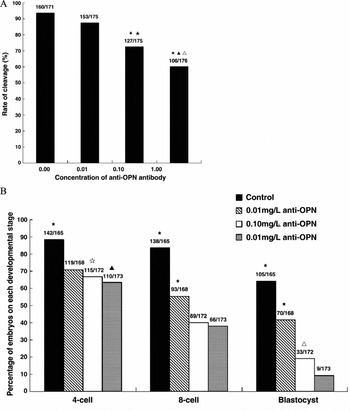
The embryos at pronuclear stage and 2-cell stage were treated with different concentrations of anti-OPN antibody (0.01 mg/l, 0.1 mg/l or 1.00 mg/l). Compared with the control group, the rate of cleavage decreased in the group of 0.01 mg/l, but no significant difference was found between these two groups. However, with the concentration of anti-OPN antibody increased, the rate of cleavage decreased significantly (P < 0.01). The cleavage rate at the concentration of 1.00 mg/l was significantly lower than it at 0.10 mg/l (P < 0.01) (Fig. 4A). The 4-cell, 8-cell and blastocyst forming efficiencies were obviously attenuated in all anti-OPN antibody-treated groups when compared with the control group (P < 0.01) (Fig. 4B).
Effect of anti-OPN antibody on cleavage and preimplantation embryo development. (A) Changes in the rate of cleavage with the action of anti-OPN antibody. Numbers of cleaved embryos versus total numbers of embryos studied are listed on the top of each column. *P < 0.01, compared with control group; ▲P < 0.01, compared with 0.01 mg/l group; △P < 0.05, compared with 0.10 mg/l group; ★P < 0.01, compared with 0.01 mg/l group. (B) Inhibition of 2-cell-stage embryonic development by anti-OPN antibody. Numbers of embryos developed to specific stages versus total numbers of 2-cell-stage embryos studied are listed on the top of each column. *P < 0.01, compared with other groups on corresponding stage; ☆P < 0.05, compared with 0.01 mg/l group on 4-cell stage; ▲P < 0.01, compared with 0.01 mg/l group on 4-cell stage; △P < 0.05, compared with 1.00 mg/l group on blastocyst stage.

Discussion
The oviduct is a critical organ in reproduction biology, its epithelial cells synthesize and secret a variety of histotrophic components, which contribute to optimize the micro-environment for fertilization and early cleavage-stage embryonic development. In mouse oviduct, some histotrophic components have been identified, such as natriuretic peptide precursor A (NPPA) (Bian et al., Reference Bian, Mao, Guo, Mao, Wang, Li, Han, Chen, Zhang and Xia2012), and parotid protein (Lee et al., Reference Lee, Xu, Lee and Yeung2006).
To the best of our knowledge, this is the first study to detect OPN expression in mouse oviduct. In the present study, OPN was found to be consecutively expressed in mouse oviduct during the natural estrus cycle, and OPN protein was mainly localized in the epithelium of oviduct. Interestingly, the expression level of OPN in mouse oviduct was fluctuant depending on the estrous cycle. Mouse estrogen level fluctuates throughout the estrous cycle, which increases obviously before ovulation, and then decreases rapidly when the corpus luteum regresses. Our results showed that the level of OPN was highest in estrus and lowest in diestrus, which was consistent with the change in estrogen expression, indicating that oviductal OPN expression may be regulated by estrogen. But in other kinds of mammals, such a situation seems to be conflicting. In the bovine oviduct, OPN mRNA expression was not correlated to the estrous cycle phases, although the expression tended to be higher during the early luteal phase and lower before ovulation (Gabler et al., Reference Gabler, Chapman and Killian2003). A recent study has reported that SPP1 is novel in that its expression is down-regulated by estrogen in epithelial cells of the chicken oviduct and that it is up-regulated in chicken ovarian endometrioid tumour (Lim et al., Reference Lim, Jeong, Kim, Ka, Bazer, Han and Song2012). To further illustrate the regulation of estrogen on OPN expression in oviduct, more experiments are needed.
Fertilized ovum undergoes many cleavages before implantation, blastocyst forms lastly throughout the 2-cell, 4-cell, and 8-cell, stages and so on, and the entire process carries on in oviduct. Lee's group (Lee et al., Reference Lee, Yao, Kwok, Xu and Yeung2002) firstly reported that the preimplantation embryo would upregulate expression of some genes in the oviduct found by the suppression subtractive hybridization (SSH) method. To investigate whether OPN expression in the oviduct is regulated by the embryo, we adopted the pseudopregnant mice as control, because their hormone levels are the same as those of normal pregnant mice. Hence, the influence of hormone on OPN expression could be excluded. Our results showed that OPN expression on days 3–5 in the pregnancy and pseudopregnancy groups was different, and the former was obviously higher than in the latter. On day 3 of pregnancy, the mouse embryo develops from the 8-cell stage to the morula, but it still stays in the oviduct until day 4 afternoon when embryo transfers to uterus. We speculated that the 8-cell embryo and morula on days 3–4 may upregulate OPN expression in oviducts. Conversely, the pregnant corpus luteum formed on day 4 of pregnancy and secreted amounts of the estrogen and progesterone, while the corpus luteum of pseudopregnancy started to degenerate at the same time, accompanied with the decrease in estrogen and progesterone concentrations. Therefore, although the embryo has left the oviduct on day 5 of pregnancy, OPN expressed in the normal pregnant mouse was still higher compared with pseudopregnancy owing to the higher levels of estrogen. Furthermore, we observed a significant decrease in OPN expression on days 4–5 of pseudopregnancy, while OPN expression on day 4 of pregnancy was the highest, it may be also attributed to alteration in the estrogen level on day 4 (Wang and Dey, Reference Wang and Dey2006).
The expression and distribution characteristics of OPN during the estrous cycle and preimplantation period in the mouse oviduct suggested that OPN may be involved in the activities of mouse gametes and embryo. To confirm this, in the present study, mouse sperm, ovum, and embryos in pronucleus stage and 2-cell stage were treated with anti-OPN antibody at different concentrations, respectively, and the fertilization rate and early embryo development were observed. The results showed that the rate of fertilization decreased with the increased concentration of anti-OPN antibody given to sperms or oocytes, and additional antibody also reduced the percentage of cleavage and blastula formation rate in a dose-dependent manner. Our results are consistent with Gonçalves's study (Goncalves et al., Reference Goncalves, Staros and Killian2008), in which OPN was described as an oviductal fluid protein that associated with bovine zona pellucida (ZP), and positively affected sperm binding, fertilization and early embryo development.
OPN have been confirmed to be expressed by bovine oocyte (Gabler et al., Reference Gabler, Chapman and Killian2003), dog sperm (Souza et al., Reference Souza, Chirinéa, Martins and Lopes2009) and bull sperm (Erikson et al., Reference Erikson, Way, Chapman and Killian2007), and preimplantation mouse embryo (Botquin et al., Reference Botquin, Hess, Fuhrmann, Anastassiadis, Gross, Vriend and Schöler1998), or other study also demonstrated that mouse sperm expressed OPN. Therefore, we propose that anti-OPN may inhibit the function of OPN expressed by oocyte, sperm or embryo, so that it affects fertilization and preimplantation embryo development. Notably, no significant decrease in cleavage rate was observed under a low concentration of anti-OPN antibody in our study. This may be because low dose of antibody only partly counteracts the function of OPN expressed by embryo, which is not enough to affect embryonic development. This finding prompts us to speculate that OPN secreted by oviducts may also be involved in the process of fertilization and preimplantation embryo development; further study is needed.
In summary, our results suggested that OPN expression in mouse oviduct epithelium is persistent during estrus cycle and early pregnancy, and may be regulated by estrogen and the embryo. The addition of anti-OPN antibody negatively influenced mouse fertilization and preimplantation embryo development by blocking the paracrine or autocrine OPN, which means that endogenous OPN is required for mouse fertilization and embryo development. The molecular mechanisms underlying these actions remain to be investigated.
Financial support
This work was supported by the Nature Science Foundation of China (30670233 and 81471456) and the Nature Science Foundation of Hubei Province of China (2012FKB04447).
Conflict of interest
None.