INTRODUCTION
Biological invasion has been identified as a threat to local and global biodiversity, being a serious and potential source of stress to marine systems (Carlton & Geller, Reference Carlton and Geller1993; Logde, Reference Lodge1993; Crooks, Reference Crooks, Koike, Clout, Kawamichi, De Poorter and Iwatsuki2006), which can also have economic and social impacts (Bax et al., Reference Bax, Williamson, Aguero, Gonzalez and Geeves2003). The introduction of invasive species may be accidental or intentional, and the four main sources of introduction are via aquaculture, in ballast water, attachment to ships' hulls, and when canals create new connections between oceans (Branch & Steffani, Reference Branch and Steffani2004). One of the species properties that predispose them to become invasive is the capacity to aggressively compete for space (Lodge, Reference Lodge1993; Carlton, Reference Carlton1996). In this way, the invasive species has the potential to occupy the space of other organisms and their high population density may cause the disappearance of native species (Breves-Ramos et al., Reference Breves-Ramos, Junqueira, Lavrado, Silva and Ferreira-Silva2010).
The rocky shores of Brazil were invaded by the bivalve Isognomon bicolor (C.B. Adams, 1845) during the decade 1970–1980, and their population spread in the 1990s (Domaneschi & Martins, Reference Domaneschi and Martins2002). This bivalve was accidentally introduced to the Brazilian coast, most probably on oil platforms (Oliveira & Creed, Reference Oliveira and Creed2008; Breves-Ramos et al., Reference Breves-Ramos, Junqueira, Lavrado, Silva and Ferreira-Silva2010) from different regions or from ballast water due to the heavy traffic of foreign and national ships through local ports (Breves-Ramos et al., Reference Breves-Ramos, Junqueira, Lavrado, Silva and Ferreira-Silva2010).
Currently, I. bicolor is found from the Rio Grande do Norte State to the Santa Catarina State (Domaneschi & Martins, Reference Domaneschi and Martins2002), but little is known about its distribution patterns and the processes that influence it. Isognomon bicolor has been registered in the supralittoral zone (into tide pools), midlittoral zone and sublittoral zone down to 7 m deep (Domaneschi & Martins, Reference Domaneschi and Martins2002; Fernandes et al., Reference Fernandes, Rapagnã, Bueno, Silva and Souza2004).
Some interactions have been noted between I. bicolor and native species. The invasive bivalve has been observed in the intertidal zone at the same level where the mussels Brachidontes solisianus (Orbigny, 1846), Perna perna (Linnaeus, 1758), the oyster Crassostrea rizophorae (Guilding, 1828), and the barnacle Tetraclita stalactifera (Lamarck, 1818) occur, and a decrease in the density of native bivalves was observed after the invasion of I. bicolor (Domaneschi & Martins, Reference Domaneschi and Martins2002; Fernandes et al., Reference Fernandes, Rapagnã, Bueno, Silva and Souza2004). In addition, positive interactions were observed between I. bicolor and the barnacle T. stalactifera (Fernandes et al., Reference Fernandes, Rapagnã, Bueno, Silva and Souza2004), filamentous macroalgae (Rocha, Reference Rocha2002) and the macroalga Sargassum sp. (López & Coutinho, Reference López and Coutinho2010).
In relation to the process of recruitment in rocky shores, I. bicolor was not a pioneer species during ecological succession (Rocha, Reference Rocha2002; Fernandes et al., Reference Fernandes, Rapagnã, Bueno, Silva and Souza2004). Isognomon bicolor can colonize substrata in an aggregated way and in low cover in small depressions or holes in the rock (Moysés et al., Reference Moysés, Junqueira, Lavrado and Silva2007). Moreover, I. bicolor could dominate space through the permanence of settled population on the rocky shore, longevity of the adults with a low and regular recruitment associated with low mortality and morphological plasticity (Rocha, Reference Rocha2002).
A few studies describe the distribution of I. bicolor in relation to the wave exposure (Domaneschi & Martins, Reference Domaneschi and Martins2002; Rocha, Reference Rocha2002; Fernandes et al., Reference Fernandes, Rapagnã, Bueno, Silva and Souza2004)—one of the most important controlling agents that determine the structure of communities on rocky shores. Domaneschi & Martins (Reference Domaneschi and Martins2002) registered high densities of I. bicolor on sheltered rocky shores and low densities in crevices, substratum depression, cavities abandoned by other species and rocky boulders sheltered from direct wave action. López & Coutinho (Reference López and Coutinho2010) registered high densities of the invasive bivalve on sheltered shores associated with high canopy of Sargassum sp. However, Fernandes et al. (Reference Fernandes, Rapagnã, Bueno, Silva and Souza2004) did not find differences in I. bicolor density between wave exposures.
Ecological studies about bioinvasions may be essential for the understanding of how habitat and environmental characteristics, and species–community interactions determine invasion success (Lodge, Reference Lodge1993). Hence, the objective of the present study is to verify the vertical distribution of the benthic community on the rocky shores of Arvoredo Island, to compare the distribution and density of I. bicolor on the rocky shores and to verify possible associations with other taxa that could contribute to the success of this invasive bivalve.
Study area
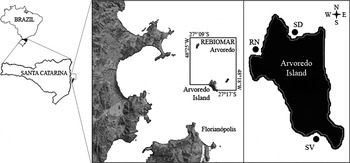
Arvoredo Island (48°21′W–27°17′S) belongs to the Arvoredo Marine Biological Reserve and is located 32 km north-east of Florianópolis, Santa Catarina (Brazil) (Figure 1). The local temperature ranges from 15°C to 18°C during the winter and 24°C to 26°C during the summer (Cunha & Guerra, Reference Cunha and Guerra2001). The mean tide level is +0.4 m and ranges from –0.2 to +1.2 m (DHN/Brazil Navy). Southerly swells have the highest frequency of occurrence for the region of Santa Catarina, with heights varying from 1 to 2.75 m. South-easterly and easterly swells are frequent, and their heights range from 1 to 2.5 m. The north-easterly swells are less frequent than the others described above, and their heights reach 1.25 m (Araújo et al., Reference Araújo, Franco, Melo and Pimenta2003).
Location of the study area and the sampling sites in Arvoredo Island. SV, Saco do Vidal; RN, Rancho Norte; SD, Saco D'Água.

The present study was performed on rocky shores with three different wave exposures at Arvoredo Island (Figure 1): Saco do Vidal (SV)—this site is located at the south region of the island and is the exposed shore, which is exposed to southern, south-easterly and easterly waves; Saco D'água (SD)—this site is located at the north region of the island and is the moderately exposed shore, which is exposed to north-easterly waves; and Rancho Norte (RN)—this site is located at the north-west region of the island and is the shore that is sheltered from waves.
MATERIALS AND METHODS
Field sampling
Sampling was conducted during the summer (January and February) of 2005. In each site, the macrofauna and macroalgae were sampled in three vertical transects by scraping the substrata within a metal framed quadrat of 100 cm2 coupled to a 500 µm net bag. The samples were taken from the intertidal to the sublittoral zones. In the intertidal zone, the number of bands sampled in each site was settled according to the different bands identified by the benthic organisms. Then, 5, 6 and 4 bands per transect were sampled in SV, SD and RN, respectively. There is a description of each band in the results to characterize the benthic zonation on the rocky shores of Arvoredo Island. In the sublittoral zone, the scratching was performed at 1 m per transect through SCUBA diving. The macrofauna and macroalgae retained in the net bag were fixed in a 4% formalin solution.
In the laboratory, each replicate quadrat was washed thoroughly in a 500-µm sieve. The remaining macrofauna in the sieve was identified to the lowest taxonomic group possible and counted using a binocular microscope (× 16 magnification). The empty shells of barnacles that were collected together with the other organisms were also counted. The organisms that live as colonial forms (e.g. sponges, colonial zoanthids, hydrozoans, etc.) were quantified by presence/absence and were not used in statistical analyses. The macroalgae were drained through filter paper for 1 minute and, after that, the algae were weighed to obtain their wet biomass. The macroalgae were separated into four functional groups, according to the classification of Littler & Littler (Reference Littler and Littler1984): filamentous algae (e.g. Giffordia sp., Gelidium sp. and Chaetomorpha sp.); foliose algae (e.g. Petalonia sp.); coarsely branched algae (e.g. Pterocladia sp. and Plocamium sp.); and articulated calcareous algae (e.g. Jania sp., Amphiroa sp. and Arthrocardia sp.).
Statistical analyses
ZONATION OF THE BENTHIC COMMUNITY
Univariate and multivariate analyses were performed in order to evaluate and describe the vertical distribution of benthic community on the rocky shores of Arvoredo Island.
Multivariate analyses were performed using the macrofauna data obtained from the quadrats to determine the patterns of vertical distribution assemblages on the rocky shores of Arvoredo Island. A non-metric multidimensional scaling (nMDS) was used to produce 2-dimensional ordination plots to show relationships among samples of assemblages. Analyses of similarity (ANOSIM) were used to test differences in taxa number of the assemblages sampled and similarity of percentage analyses (SIMPER) were used to verify the taxa contributing most to the dissimilarity among assemblages (Clarke & Warwick, Reference Clarke and Warwick1994). Multivariate analyses were performed using the Bray–Curtis similarity coefficient (Bray & Curtis, Reference Bray and Curtis1957).
One-way analysis of variance (ANOVA) was performed to compare biomass of the macroalgae groups among bands sampled on the rocky shores in each sampled site. The bands 1 and 2 were not included in these analyses due to the absence of algae. The data were transformed (x = √(x + 1); Underwood (Reference Underwood1997)) to obtain homogeneity of variances. The Tukey test was performed a posteriori to verify the significant differences between bands.
Qualitative data and field observations were also used to describe zonation of the benthic community.
DISTRIBUTION OF I. BICOLOR AND RELATIONSHIPS WITH OTHER TAXA
Differences were analysed using data from equivalent bands that occurred at all sites (i.e. bands 3, 4, 5 and sublittoral). Two-way ANOVA was performed in order to compare the density of I. bicolor among sites (random factor, 3 levels) and corresponding bands (fixed factor, orthogonal, 4 levels) and means were compared a posteriori using Student–Newman–Keuls (SNK) tests. The data were transformed (x = √(x + 1); Underwood (Reference Underwood1997)) because variance showed significant heterogeneity.
In order to verify if some biological structures of the habitat could contribute to the success of the invasive bivalve on these rocky shores, Pearson correlations were performed between I. bicolor and the macroalgae groups and the sum of empty shells of the barnacles Tetraclita stalactifera, Megabalanus coccopoma (Darwin, 1854) and Megabalanus tintinnabulum (Linnaeus, 1758).
RESULTS
Zonation of the benthic community on the rocky shores
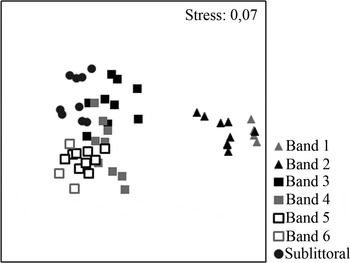
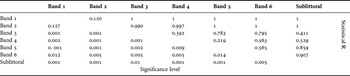
A distribution pattern of the benthic community was observed on the rocky shores sampled in Arvoredo Island (Figure 2). Bands 1 and 2 and bands 3 to 6 corresponded, respectively, to the upper intertidal and midlittoral zones on the rocky shore. There were differences in assemblages among the bands sampled except between band 1 and band 2 (Table 1).
Two-dimensional non-metric multidimensional scaling ordination comparing macrofaunal assemblages among the sampled bands at the intertidal and sublittoral zones on the rocky shores of Arvoredo Island.

Analyses of similarity results comparing macrofaunal assemblages from the bands sampled on the rocky shores of Arvoredo Island. Global R: 0.711, P < 0.01.

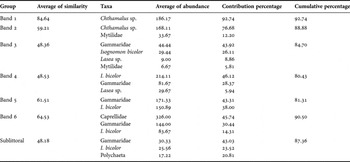
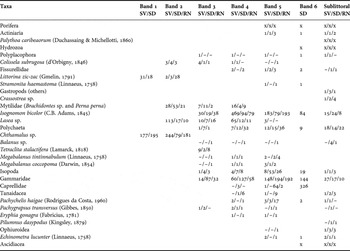
The bands 1 and 2, wherein assemblages did not differ, were characterized by the dominance of the barnacle Chthamalus sp., which represents more than 75% of the total assemblage and a low contribution of mussels (Table 2). Other organisms occurred, like the periwinkle Littorina zic-zac (Gmelin, 1791) and the limpet Collisella subrugosa (d'Orbigny, 1846), but without expressive contribution. Table 3 shows all taxa registered for the rocky shores of Arvoredo Island and it is noted that most of them occurred with low mean densities.
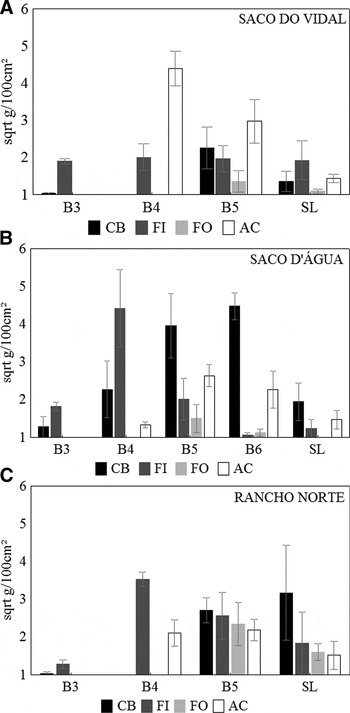
Mean biomass (sqrt x + 1, ±SE) of macroalgae functional form groups on the rocky shores of the Arvoredo Island: (A) Saco do Vidal; (B) Saco D'Água; and (C) Rancho Norte. CB, coarsely branched algae; FI, filamentous algae; FO, foliose algae; AC, articulated coralline algae; B1, band 1; B2, band 2; B3, band 3; B4, band 4; B5, band 5; B6, band 6; SL, sublittoral.

Similarity of percentage results showing the percentage contribution of individual taxa that primarily accounts for observed differences between assemblages sampled on the rocky shores of Arvoredo Island. The seven selected taxa contribute to more than 80% of the assemblages' composition.

Mean density (individuals per 100 cm2) of the macrofauna for each band (bands 1–6 and sublittoral) in the three sampling sites (SV, Saco do Vidal; SD, Saco D'Água; and RN, Rancho Norte) on the rocky shores of Arvoredo Island. ‘x’ represent the organisms counted by presence.

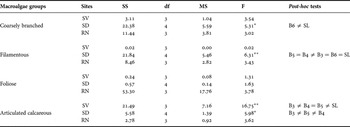
The bands 3, 4, 5 and 6 represented the midlittoral, and the differences in assemblages among these bands were mainly related to variance in densities of 3 taxa (Gammaridae and Caprellidae amphipods and the invasive bivalve I. bicolor) (Table 2). Band 3 showed a great occurrence of Gammaridae amphipods and I. bicolor, with a low contribution of bivalves (Mytilidae and Lasea sp.). This band was also characterized by the recovery of filamentous algae in the three sites (Figure 3) and the occurrence of the cirriped Tetraclita stalactifera (personal observation). Band 4 had high contribution of I. bicolor and low contribution of Gammaridae amphipods, whereas band 5 exhibited the inverse result for these two taxa (Table 2). Both bands were described by the presence of the cirripeds Megabalanus coccopoma and Megabalanus tintinnabulum (personal observation), but a more diverse algae group was observed in band 5 (Figure 3). Filamentous algae had a great occurrence at Rancho Norte (RN) (Figure 3A) and Saco D'Água (SD) (Figure 3B), meanwhile the articulated calcareous algae occurred primarily on the exposed shore (Saco do Vidal) (Figure 3B; Table 4). Foliose and coarsely branched algae occurred from band 5 until the sublittoral. In the SD site (moderately exposed), a sixth band was registered, in which occurred the predominance of Caprellidae and Gammaridae amphipods (Table 2) and great recovery of the coarsely branched algae (Figure 3B; Table 4). Isognomon bicolor also occurred in this band, but with lower contributions. An increase of the fauna was observed in bands 4, 5 and 6 (Table 3), in which were noted the broadest canopies of macroalgae, including molluscs (gastropods, bivalves and chitons), polychaete worms, crustaceans (brachyura and anomura crabs, amphipods, isopods and tainadaceans) and sea urchins, among others.
Results of the one-way analysis of variance on biomasses of macroalgae functional form groups among bands in each sampled site on the rocky shores of Arvoredo Island, with the results of Tukey post-hoc tests for significant differences.

*, P < 0.05; **, P < 0.01; ≠, significant; =, not significant; B3, band 3; B4, band 4; B5, band 5; B6, band 6; SL, sublittoral; SV, Saco do Vidal; SD, Saco D'Água; RN, Rancho Norte.
In the midlittoral zone, the occurrence of some organisms in the empty shells of the cirripeds T. stalactifera and Megabalanus spp. were noted. Polychaetes, little crabs and primarily the exotic bivalve I. bicolor were found. The latter was observed fixed to the inner surface of the cirriped shells. Another feature in the midlittoral zone was the low densities registered for the mussels Brachidontes sp. and P. perna and gastropods, with exception of periwinkles and limpets (Table 3).
The sublittoral zone had a great contribution of Gammaridae amphipods, with the lower contribution of I. bicolor and polychaetes (Table 2). Despite no evident contributions, it was observed that the macrofaunae were more diverse in this zone (see Table 3), with the occurrence of characteristic organisms such as hydrozoans, Palythoa caribeaorum (Duchassaing & Michellotti, 1860), brittle stars and ascidians. The macroalgae presented a patchy distribution and their biomass was lower than in the intertidal zone (Figure 3; Table 4).
Distribution of I. bicolor and relationships with other taxa
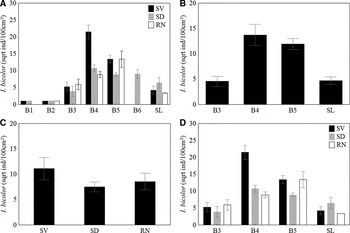
Isognomon bicolor was registered from the midlittoral (bands 3, 4, 5 and 6) to the sublittoral zone in all three sampling sites (Figure 4A). There were differences among sites and bands (Figure 4B, C; Table 2). The largest density was registered in the exposed shore (SV), meanwhile the moderately exposed (SD) and sheltered (RN) shores showed lower and similar densities (Figure 4B). In relation to the vertical distribution, high densities were observed in the bands 4 and 5 (Figure 4C), despite the fact that the result was not significant (P = 0.05; see Table 5). Moreover, the greater density was noted in band 4 of the exposed shore when comparing bands between sites, and bands 4 (SV) and 5 (SV and RN), when comparing bands into sites (Figure 4D; Table 4).
Mean density (sqrt x + 1, ±SE) of Isognomon bicolor on the rocky shores of Arvoredo Island: (A) vertical distribution for each site; variation in I. bicolor densities between: (B) sites; (C) bands and; (D) sites and bands. B1, band 1; B2, band 2; B3, band 3; B4, band 4; B5, band 5; B6, band 6; SL, sublittoral; SV, Saco do Vidal; SD, Saco D'Água; RN, Rancho Norte.

Results of the two-way analysis of variance on Isognomon bicolo r densities between sites (Saco do Vidal, Saco D'Água and Rancho Norte) and bands (bands 3, 4, 5 and sublittoral), with the results of Student–Newman–Keuls post-hoc tests. N = 36

*, P<0.05; **, P < 0.01; ≠, significant; =, not significant; ns, not significant; B3, band 3; B4, band 4; B5, band 5; SL, sublittoral; SV, Saco do Vidal; SD, Saco D'Água; RN, Rancho Norte.
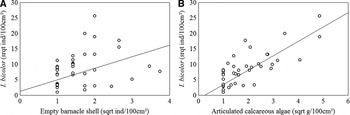
Isognomon bicolor was observed inside the empty shells of the barnacles T. stalactifera, M. coccopoma and M. tintinnabulum, evidencing a positive correlation (R = 0.43; P < 0.01) (Figure 5A). However, an important feature observed was that I. bicolor was mostly found amongst the articulated calcareous algae in all sites. The greater densities of I. bicolor were registered in the same bands (bands 4 and 5) and site (exposed shore—SV) where the higher biomass of the articulated calcareous algae was primarily registered. Therefore, a high correlation between the exotic bivalve and these algae was obtained (R = 0.79; P < 0.01) (Figure 5B).
Scatter plots of the correlation of Isognomon bicolor and: (A) the empty shells of the barnacles Tetraclita stalactifera and Megabalanus spp. (N = 54; R = 0.43; P < 0,01); and (B) the articulated calcareous algae (N = 54; R = 0,79; P < 0.01).

DISCUSSION
The lower number of species and the greater densities of a few species in the upper limit of the midlittoral zone are common characteristics of rocky shores (Connell, Reference Connell1961; Lewis, Reference Lewis1964; Boaventura et al., Reference Boaventura, Ré, Fonseca and Hawkins2002; Coutinho, Reference Coutinho, Pereira and Soares-Gomes2002) as recorded in the rocky shores of Arvoredo Island with the predominance of Chthamalus sp. Furthermore, the occurrence of macroalgae in the midlittoral zone increases the structural complexity of the habitat that alleviates environmental stress for many marine organisms (Thompson et al., Reference Thompson, Wilson, Tobin, Hill and Hawkins1996), providing refuge from desiccation (Nixon et al., Reference Nixon, Oviatt, Rodgers and Taylor1971; Gibbons, Reference Gibbons1988), predation (Coull & Wells, Reference Coull and Wells1983; Dean & Connell, Reference Dean and Connell1987) and wave action (Whorff et al., Reference Whorff, Whorff and Sweet1995). Therefore, an increase of species number and density are observed where a great recovery of macroalgae occurs (Little & Kitching, Reference Little and Kitching1996), as observed in the rocky shores of Arvoredo Island.
The Gammaridae and Caprellidae amphipods observed in different bands of the midlittoral rocky shores of Arvoredo Island may be associated with the variation in macroalgae assemblages (Little & Kitching, Reference Little and Kitching1996). One explanation for the variation in macroalgae groups could be the different periods of exposure during low tides (Lobban & Harrison, Reference Lobban and Harrison1997). Wave exposure can also interfere on macroalgae distribution, where the predominance of resistant algae to wave shock in exposed shores is common (Littler & Littler, Reference Littler and Littler1980; Lobban & Harrison, Reference Lobban and Harrison1997), such as the calcareous algae observed in Saco do Vidal. On the other hand, in rocky shores with lower wave exposure such as Saco D'Água and Rancho Norte, the coarsely branched algae could compete for and occupy more space than the calcareous algae, because they have higher rates of biomass production than the calcareous algae (Littler & Littler Reference Littler and Littler1980; Littler & Arnold, Reference Littler and Arnold1982).
The higher density of I. bicolor was registered in bands 4 and 5, and mainly on the exposed shore. This result contradicts previous observations about the distribution of the bivalve, which were registered in high densities on sheltered rocky shores (Domaneschi & Martins, Reference Domaneschi and Martins2002; Rocha, Reference Rocha2002; López & Coutinho, Reference López and Coutinho2010). Instead, Fernandes et al. (Reference Fernandes, Rapagnã, Bueno, Silva and Souza2004) did not register differences of I. bicolor between exposed and sheltered rocky shores. Another contrast was that López & Coutinho (Reference López and Coutinho2010) observed a negative interaction between I. bicolor and articulated calcareous algae, but their study was conducted in a sheltered area where Sargassum sp. predominates. The result found in the present study was explained by the great correlation between the invasive bivalve and the articulated calcareous algae, which were more abundant on the exposed shore.
The presence of other species is important for the settlement of I. bicolor, according to Rocha (Reference Rocha2002). On sheltered shores, López & Coutinho (Reference López and Coutinho2010) found a positive interaction between the invasive bivalve and the macroalga Sargassum sp. and discussed that this alga could facilitate I. bicolor settlement and recruitment providing shelter from predation of non-benthic predators. Similarly, the articulated calcareous algae, which are more resistant to wave shock than other macroalgae (Lobban & Harrison, Reference Lobban and Harrison1997), could provide a more stable substratum for I. bicolor settlement on exposed shores, once they settle on the stalk basis of these algae. In addition to the benefits of the articulated calcareous algae to I. bicolor, the exposed shore could also favour the high density of I. bicolor by reducing the effect of predation due to wave action (Paine Reference Paine1966, Reference Paine1974). Besides that, the rates of food supply are higher in exposed shores than in sheltered shores, which could favour a higher density of filter feeders on exposed shores (McQuaid & Branch, Reference McQuaid and Branch1985; Bustamante & Branch, Reference Bustamante and Branch1996), such as I. bicolor.
Fernandes et al. (Reference Fernandes, Rapagnã, Bueno, Silva and Souza2004) registered an increase of I. bicolor in the midlittoral rocky shores of Arraial do Cabo and its higher density was observed associated with the cirriped Tetraclita stalactifera. Individuals of I. bicolor were registered in the empty shells of T. stalactifera and also on the ones of Megabalanus coccopoma and Megabalanus tintinnabulum cirripeds in the midlittoral rocky shores of Arvoredo Island, evidencing a cryptic habit of the bivalve. The preference for cavities as a refuge, such as crevices and substrata depression in the rock, including cavities abandoned by other species was described by Domaneshi & Martins (2002). The empty shells of these cirripeds could provide a favourable substratum to the settlement of I. bicolor, since it was shown that I. bicolor could colonize in low cover small depressions or holes in the rock (Moysés et al., Reference Moysés, Junqueira, Lavrado and Silva2007). In addition, barnacle mosaics provide refuge from the dislodgement by wave action and desiccation for small invertebrates (Thompson et al., Reference Thompson, Wilson, Tobin, Hill and Hawkins1996) and it is an important structure for protection from predation and for invertebrates' settlement and fish nesting (Barnes, Reference Barnes2000). In this way, the benefits provided by barnacle shells probably facilitate the settlement of I. bicolor on rocky shores while native species may be prejudiced, since the barnacle structure is an important resource competed for by many species (Barnes, Reference Barnes2000).
The high density of the invasive bivalve can be an indicator of a stable bank, which is an important characteristic for I. bicolor dominance on rocky shores (Rocha, Reference Rocha2002). Thus, the banks of I. bicolor found on the rocky shores of Arvoredo Island are potential threats to the local diversity. It is suggested that I. bicolor could prevent native species settlement, mainly in areas in which the bivalve occurs in high densities, since it has been shown that filter feeders can avoid the settlement of other invertebrate species by consuming settling larvae (Williams, Reference Williams1980; Andre & Rosenberg, Reference Andre and Rosenberg1991).
Furthermore, it is proposed that changes in species abundance and composition within the macrofauna associated with articulated calcareous algae could occur as a consequence of the alteration of physical structure by the high density of I. bicolor. The articulated calcareous algae provide an important habitat for many invertebrate species (Kelaher et al., Reference Kelaher, Chapman and Underwood2001; Kelaher, Reference Kelaher2002), in which the gastropods show great contribution (Kelaher, Reference Kelaher2002). In the present study, a low density of gastropods was found in the coralline algae, while I. bicolor was predominant. Chapman et al. (Reference Chapman, People and Blockley2005) showed that an invasive mussel could not provide the same important habitat for invertebrates as the one provided by articulated calcareous algae. In addition, the physical structure of shells could create resources that are not otherwise available, which have consequences for the species (Gutiérrez et al., Reference Gutiérrez, Jones, Strayer and Iribarne2003). Thus, the high density of I. bicolor has the potential to modify faunal assemblage through many mechanisms such as changing quantity of food, sizes or structure of refuges, among others.
Another important feature observed on the rocky shores were the low densities of mussels that normally dominate a well-defined band in the intertidal zone on exposed rocky shores (Paine, Reference Paine1974) and occupy sheltered shores with a patchy distribution due to predation effect (Peterson, Reference Peterson1979). Probably the low densities of the mussels Brachidontes sp. and P. perna observed in the studied rocky shores were associated with the occurrence of I. bicolor. Studies of the benthic community in intertidal rocky shores of São Paulo (Domaneschi & Martins, Reference Domaneschi and Martins2002) and Rio de Janeiro (Fernandes et al., Reference Fernandes, Rapagnã, Bueno, Silva and Souza2004) showed a decrease in the Brachidontes solicianus and P. perna populations after the invasion of I. bicolor. Therefore, I. bicolor could play an important role as a dominant competitor for space and is probably excluding Brachidontes sp. and P. perna from the rocky shores of Arvoredo Island. However, there is no previous information about the intertidal benthic community of the rocky shores of Arvoredo Island and the competition for space between the invasive bivalve and the mussels still needs further investigation.
In summary, the prominent vertical distribution of the organisms in the intertidal zone, as observed in the present study, is a normal feature in rocky shores (Little & Kitching, Reference Little and Kitching1996), however the great occurrence of I. bicolor on the rocky shores of Arvoredo Island evidences an alteration of the native benthic community. The biological habitat structure provided by some species, such as the articulated calcareous algae and the empty shells of the barnacle Tetraclita stalactifera and Megabalanus spp. contributes to the success of I. bicolor invasion on rocky shores.
Considering the potential impacts of I. bicolor discussed, future investigations are recommended in order to understand the effects of the invasive bivalve on local biodiversity. Moreover, the findings of this study and other studies about I. bicolor distribution indicate that wave exposure could be an important factor that influences the invasive bivalve distribution and, therefore, this topic deserves futures studies with appropriate experimental design to test wave exposure effects.
ACKNOWLEDGEMENTS
I thank the IBAMA (process 02026.000140/04-12/license 082/2004), Brazil Navy (CPSC), Parcel and Seadivers dive centres, for the logistic support in the field, and CNPq for the scientific initiation scholarship granted to me. I would like to thank my advisor Dr Carlos Emílio Bemvenuti for his help during the development of this study. I am also grateful to Dr Maria Augusta Gonçalves F. da Silva (Biology Institute of UFRJ) who identified the species Isognomon bicolor, and Raphael Mathias Pinotti for help in the field and laboratory activities. This work was supported by Project AWARE (grant number P–000588).