





Introduction
Ecological communities comprise multiple interacting species. When these species occupy the same trophic level and use the same limiting resource, theory indicates that they must in some way partition the shared resource to coexist and not competitively exclude one another (Schoener Reference Schoener1983; Holt Reference Holt1987, Reference Holt2001; Griffin and Silliman Reference Griffin and Silliman2011). Flies in the family Tephritidae that live in subtropical or tropical regions generally use fruit from multiple hosts. This can reduce the risk of competitive exclusion when different flies infest different combinations of fruits to varying degrees. In temperate regions, tephritids are usually specialists on one or relatively few species of host plants, perhaps because of the shorter growing season and relatively few host species. In this case, specialising on different primary host plants can restrict interspecific competition between flies. However, there are examples in which more than one temperate tephritid fly species infest the fruit of the same host plant (Bush Reference Bush1966). When more than one fly attacks the same host plant, this raises the question of how these species coexist without one species driving the other to extinction (Holt Reference Holt2001).
The answer to this question is critical not just for illuminating our basic understanding of how biodiversity is maintained in nature but also has important applied economic implications. For example, invasions by exotic fruit fly pests into regions already occupied by other fly species may lead to niche partitioning or extinction, affecting control strategies (e.g., Duyck et al. Reference Duyck, David, Junod, Brunel, Dupont and Quilici2006; Ekesi et al. Reference Ekesi, Billah, Nderitu, Lux and Rwomushana2009; Lopes et al. Reference Lopes, Souza-Filho, Gotelli, Lemos, Godoy and Zucchi2015; Clarke and Measham Reference Clarke and Measham2022; Hassani et al. Reference Hassani, Delatte, Ravaomanarivo, Nouhou and Duyck2022). One example of this in temperate regions is the recent invasion of the European cherry fruit fly, Rhagoletis cerasi (Linnaeus) (Diptera: Tephritidae), into eastern North America (Prengaman Reference Prengaman2017). There, R. cerasi could potentially interact with two native tephritid pests that attack commercially grown cherries as an alternate host: Rhagoletis cingulata (Loew), whose native host is Prunus serotina Ehrhart, black cherry (Rosaceae), and Rhagoletis fausta (Osten-Sacken), whose native host is Prunus pensylvanica Linnaeus filius, pin cherry (Rosaceae). The impact of the introduction of R. cerasi on the community of cherry-infesting Rhagoletis remains to be determined.
Available evidence from North America suggests that infestations of the same host fruit by Rhagoletis can result in several outcomes. In the Pacific Northwest of the United States of America, western cherry fruit fly, Rhagoletis indifferens Curran, and R. fausta both infest bitter cherry, Prunus emarginata (Douglas ex Hooker) Eaton (Rosaceae). Rhagoletis fausta, the rarer of the two species in the region, is active as adults 1–3 weeks earlier than R. indifferens is and generally occurs at higher elevations (Bush Reference Bush1966). These differences may result in temporal and spatial niche partitioning of bitter cherry, allowing R. fausta to coexist with R. indifferens in sympatry. In contrast, there is also evidence of competitive exclusion occurring in Rhagoletis. In Massachusetts and Rhode Island, United States of America, both Rhagoletis basiola (Osten-Sacken) and Rhagoletis pomonella (Walsh) were reported to infest hips of Rosa spp. (Rosaceae) at the same time over two seasons (Prokopy and Berlocher Reference Prokopy and Berlocher1980). Rosa is the primary host of R. basiola and is a secondary host of R. pomonella (whose primary native host is hawthorn, Crataegus spp. (Rosaceae)). However, R. pomonella appears to have subsequently gone extinct in roses, implying competitive exclusion in Rosa by R. basiola. These examples suggest that temporal or spatial partitioning, or both, may allow coexistence, whereas lack of partitioning may lead to exclusion.
Another case of two tephritids inhabiting a shared host fruit involves the flies Euphranta canadensis (Loew) and Rhagoletis ribicola Doane, native to the Pacific Northwest of the United States of America. There, E. canadensis and R. ribicola have been reported to attack native golden currant, Ribes aureum Pursh (Grossulariaceae), as their principal host, as well as introduced currants and gooseberries, since at least 1898 (Piper and Doane Reference Piper and Doane1898). The flies’ life histories appear similar, but many knowledge gaps about these flies remain. Both E. canadensis and R. ribicola are adapted to temperature zones that have cold winters, and both are univoltine. Both reportedly can lay as many as 200 eggs under the epidermis of currants (Jones Reference Jones1937). Puparia of both live in soil for over 10 months and eclose as adults in the spring. Oviposition by E. canadensis begins about 2 weeks after flies emerge from soil, with eggs hatching after about 5–11 days (Paine Reference Paine1912; Jones Reference Jones1937). The larval stage lasts about 13 or 15 days (Mitchener Reference Mitchener1927; Jones Reference Jones1937). Oviposition by R. ribicola probably begins about 7–10 days after eclosion, if its timing is like that of other Rhagoletis (e.g., Neilson et al. Reference Neilson, Knowlton and McRae1981). The larval stage of R. ribicola lasts 3–4 weeks (Piper and Doane Reference Piper and Doane1898). How E. canadensis and R. ribicola ecologically partition golden currant fruit has been poorly studied, but several possible, nonmutually exclusive means can broadly be categorised as spatial, host fruit-related, demographic, and temporal partitioning, as follows.
With respect to spatial partitioning, the two flies may geographically overlap in only part of their respective ranges. As a result, migration from areas outside of their overlap zone, in this case the Pacific Northwest, may allow E. canadensis and R. ribicola to persist in sympatry despite strong interspecific competition between them in golden currant. In this regard, E. canadensis occupies a broader geographic range across North America than R. ribicola does, the latter being restricted to western North America (Foote et al. Reference Foote, Blanc and Norrbom1993). Euphranta canadensis may therefore be more successful than R. ribicola in more diverse habitats and in various other Ribes species besides R. aureum outside of where it co-occurs with R. ribicola, allowing it to persist in sympatry despite potentially being outcompeted on golden currant in the Pacific Northwest. Spatial mechanisms may largely depend on the ability of the two flies to survive in different climates, independent of host fruit-related, demographic, and temporal factors.
Host fruit-related differences refer to the possibility that E. canadensis and R. ribicola larvae feed in different parts of golden currant fruit that vary in their physical or chemical characteristics (e.g., on the seeds or in the core of fruit versus in exterior regions).
Demographic considerations, such as generally low population sizes of E. canadensis and R. ribicola, may also result in larvae of the two flies rarely co-occurring in the same fruit. In this regard, limited collections in June and July of golden currants in central Washington state, United States of America (Yee Reference Yee2008), suggest currants are not heavily infested by either species, thereby relaxing competition and allowing the two flies to share the same host plant.
Finally, E. canadensis and R. ribicola may temporally divide golden currant by attacking the plant at different times of the field season. This can result in larvae of the two species feeding in golden currant in different stages of fruit ripeness (i.e., immature, ripe, decayed). If this is the case, then temporal partitioning of resources can have different consequences for larval success, depending on the stage of fruit ripeness. Euphranta canadensis and R. ribicola larvae may feed in golden currant at different stages of fruit maturation, when fruit may vary in their physical characteristics (e.g., harder versus softer tissues), chemical properties (e.g., greater versus lesser concentration of secondary compounds and toxins), or sugar content, or any combination thereof. Temporally dividing golden currant can also affect the flies’ mating systems and oviposition choices. If E. canadensis and R. ribicola adults are active at different times of the season, they may prefer to mate on and oviposit into golden currant in different stages of fruit development, thereby reducing their chances of encountering one another and lessening reproductive interference between their offspring on shared host fruit.
Here, we focus on the role of seasonal differences in the distributions of E. canadensis and R. ribicola as a mechanism contributing to species coexistence. Little is known about the temporal overlap of the two flies, other than that E. canadensis adults occur earlier in the season than R. ribicola adults do (Piper and Doane Reference Piper and Doane1898; Jones Reference Jones1937), suggesting temporal partitioning of golden currant contributes to the coexistence of the two flies in the Pacific Northwest. We hypothesised that univoltine E. canadensis and R. ribicola adults and larvae partition golden currant fruit seasonally. While acknowledging the possible role of spatial and host fruit mechanisms, we also hypothesised that this, together with demography – specifically low infestation rates – help explain the two species’ coexistence in golden currant. We asked the following questions: (1) How is fruiting phenology related to differences in seasonal catches of E. canadensis and R. ribicola, and do abundances of the two flies differ? (2) Do the two fly species differ in eclosion timings in the laboratory? (3) Do distributions of fly eggs and larvae depend on fruit maturity stages and, related to this, are eggs laid singly? (4) Do the two species tend to infest fruit of different stages and, from answering this question, what are the larval abundances and niche overlaps of larvae of the two species? and (5) Do emergence timings of larvae of the two fly species from fruit following fruit collection differ? For additional information to help interpret the results, we also determined currant bush sizes and fruit loads, seasonal air temperatures, and adult fly capture periods.
Materials and methods
General
The spatial and temporal sampling effort to answer each question and objectives posed in the last paragraph of the Introduction and the variables measured for each are presented in Supplementary material, Table S1. Here, we describe the study sites and the methodologies for each of the questions or objectives outlined in the supplementary table.
Study sites
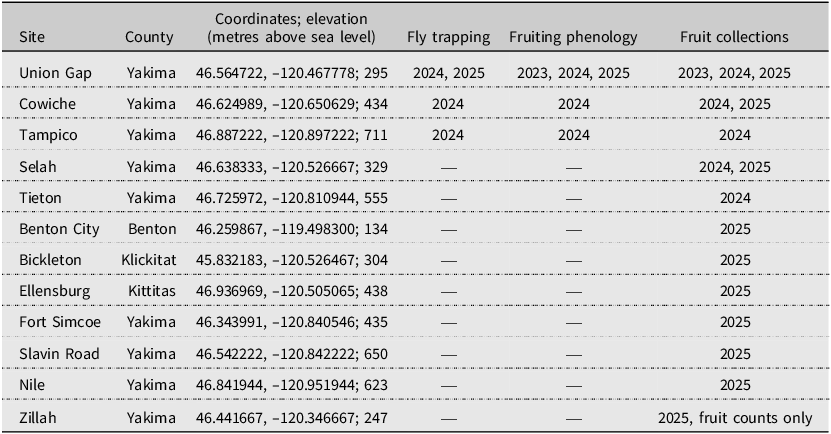
The study was conducted at 12 sites within an approximately 120-km radius of Union Gap in Yakima County, Washington state, United States of America (Table 1). Nine of the sites (Union Gap, Cowiche, Selah, Tieton, Benton City, Ellensburg, Fort Simcoe, Slavin Road, and Zillah) are in or near riparian zones in the sagebrush–bunchgrass ecosystem. The Tampico and Nile sites are located near or in the ponderosa pine ecosystem. The Bickleton site is located in transitional sagebrush–ponderosa pine habitat.
Site information for collections/observations of golden currant (Ribes aureum), flies, and fly eggs and larvae (Euphranta canadensis and Rhagoletis ribicola) from central Washington state, United States of America, in the study. Given are years (2023, 2024, and/or 2025) for fly trapping, fruiting phenology observations, and fruit collections/counts.
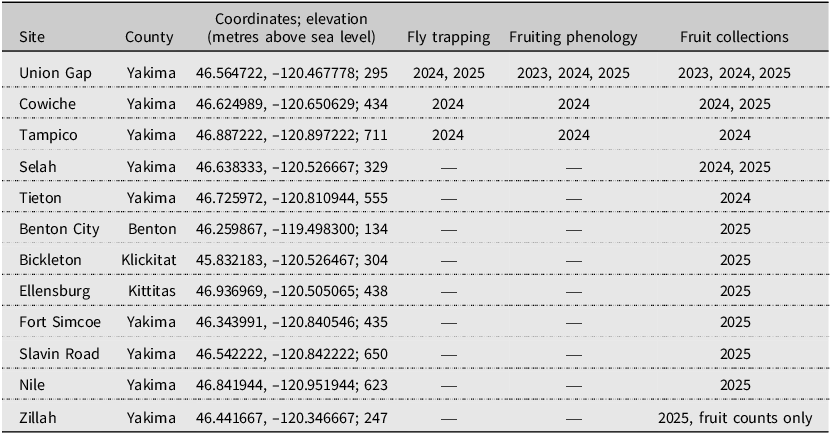
Table 1. Long description
The table presents information about 12 sites within an approximately 120-km radius of Union Gap in Yakima County, Washington state, United States of America. It includes details on the county, coordinates, elevation, and years for fly trapping, fruiting phenology, and fruit collections for each site. The table has 12 rows and 6 columns. The columns are labeled Site, County, Coordinates; elevation (metres above sea level), Fly trapping, Fruiting phenology, and Fruit collections. Each row lists a specific site with its corresponding details. For example, the Union Gap site in Yakima County has coordinates 46.564722, -120.467778, an elevation of 295 meters, and years 2024, 2025 for fly trapping; 2023, 2024, 2025 for fruiting phenology; and 2023, 2024, 2025 for fruit collections. The table provides a comprehensive overview of the study sites and the years of observations and collections.
Currant bush sizes and fruit loads (2025)
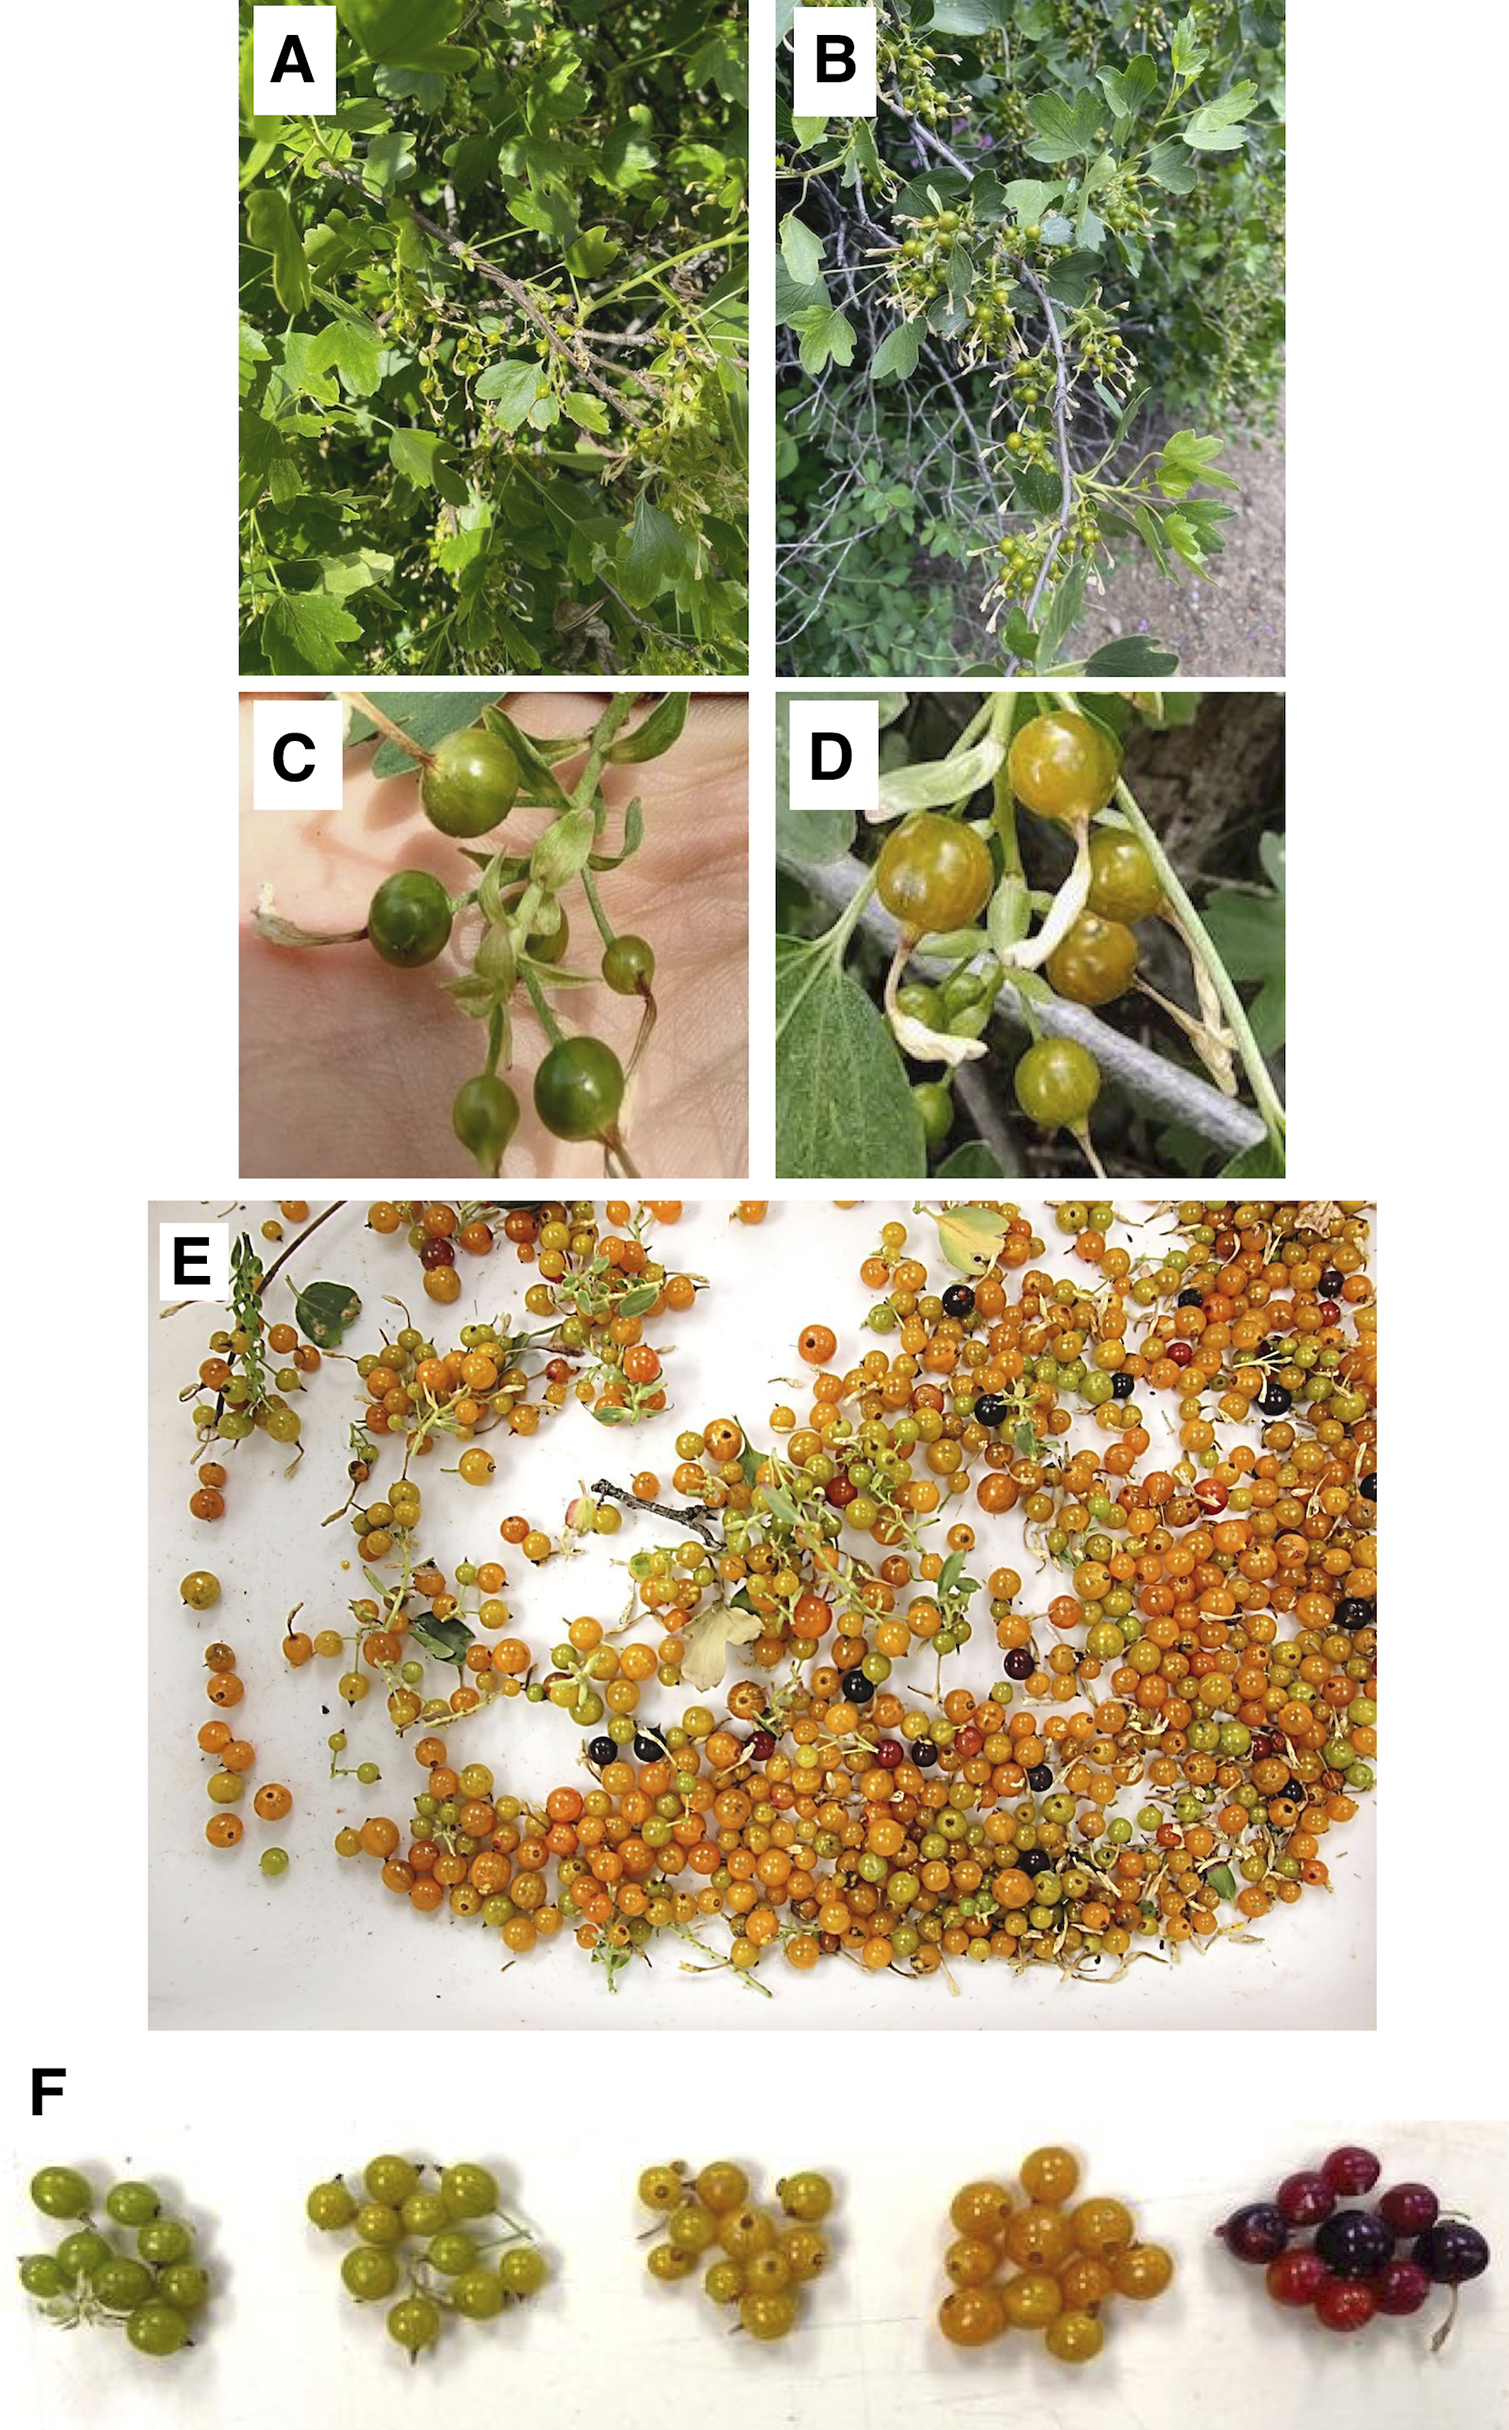
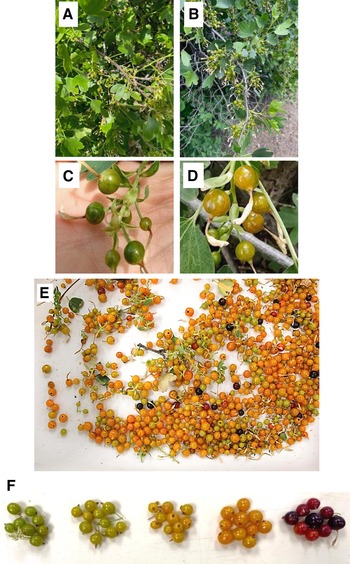
To document key currant plant traits, in 2025, we estimated heights, widths, and fruit loads of currant bushes. A bush refers to an individual currant plant, which is a multi-stemmed shrub, and fruit loads are numbers of fruit per branch portion. Height and width were estimated by standing next to bushes and relating the measures to the observer’s known height and arm span. Fruit on three to five bushes at the Union Gap, Selah, Zillah, Nile, and Slavin Road sites were counted on 30 May and 2, 3, 4, and 5 June, respectively (Fig. 1A, B). For each bush, we took five main branches, looked at the top 30.5 cm of each branch, including all side branches, and counted the currants found on that portion.
A, Lighter and B, heavier golden currant (Ribes aureum) fruit loads on bushes at Union Gap in central Washington state, United States of America, on 27 May 2025. Fruit colour maturation stages recorded in the study: C, green fruit (1 May); D, green–yellow fruit (14 May); and E, mix of yellow, yellow–orange, and orange–red fruit (11 June) when fruit reached peak size at Union Gap site in 2024. F, left to right: comparison of green, green–yellow, yellow, yellow–orange, and orange–red fruit collected from Slavin Road site, Washington state, United States of America, on 19 June 2025.
How is fruiting phenology related to differences in seasonal catches of E. canadensis and R. ribicola, and do abundances of the two flies differ? (2024, 2025)
To determine which currant fruit stages are associated with adult fly presence, we recorded fruit colours and fly catches on traps over the season in 2024 at Union Gap, Cowiche, and Tampico, representing low-, mid-, and high-elevation gradient sites, respectively. Each week from 23 April to 9 July at Union Gap and from 9 May to 9 July at Cowiche and Tampico, 10 fruit were sampled from each of 5–10 randomly chosen bushes spread over an approximately 0.07-km2 area at each of the three sites. The sampled bushes were randomly chosen from week to week, so some bushes were sampled two or three times during the season.
Each fruit was visually categorised (Fig. 1C, D, E) into one of five different colour (fruit maturity) classes: (1) green; (2) yellow–green; (3) yellow; (4) yellow–orange, and (5) orange–red (Fig. 1F). We included dry fruit in the orange–red category. Multiple colour fruit stages occurred on bushes at the same time. Fruit on some bushes never turned red but remained orange, including when dried. Black fruit occurred on about three bushes and were included in the orange–red category.
To further determine seasonality of fruit maturity coinciding with fly catch timing, we measured diameter, weight, firmness, and sugar content of the fruit collected for fruit colour recordings. We measured fruit diameter with a calliper (Fowler High Precision, Canton, Massachusetts, United States of America), weight with a balance (AdventurerTM, OHAUS, Pine Brook, New Jersey, United States of America), firmness via the grams reading in the dial of a fruit firmness penetrometer with a 1-mm diameter probe (QA Supplies, Norfolk, Virginia, United States of America), and percent sugar (total soluble solids) with a Brix refractometer (ATAGO N1, Tokyo, Japan).
To associate fly catch equating to fly flight periods with fruiting phenology in 2024, one 14-cm × 23.5-cm sticky yellow rectangle trap (Multigard AM, Scentry Biologicals, Inc., Billings, Montana, United States of America) baited with an external sachet containing 27 g ammonium carbonate was deployed in each of 20 bushes 0.5–1.5 m above ground, including in the bushes used for fruit maturity recordings. Traps were positioned approximately 3–20 m apart, depending on where the bushes occurred and were spread over the approximately 0.07-km2 sampling area. The traps were removed from bushes in July, after no fly was captured for two consecutive weeks. Flies were removed from traps weekly and transported to the laboratory, where they were counted and morphologically identified according to Foote et al. (Reference Foote, Blanc and Norrbom1993). At Cowiche, we inadvertently combined data for male and female E. canadensis on 19 April 2024.
Currant bushes and flies were monitored at Union Gap in 2025, employing the same methods described above to determine whether the temporal distribution patterns observed in 2024 were consistent across years, using 10 new and 10 previously monitored bushes at the site. Traps were deployed in the bushes on 20 May, missing the earliest flight periods at the site. We monitored fruiting phenology and fly catches weekly by recording fruit colours and counting flies on traps in each of the 20 bushes until 9 July. We did not collect fruit for trait measurements in 2025.
Seasonal air temperatures and adult fly catch periods (2024 and 2025)
We documented air temperatures when adult E. canadensis and R. ribicola were active, as activity or survival (or both) at different temperatures may be a physiological trait correlated with fruiting development that keeps the species apart and contributes to coexistence. In 2024, we deployed two Hobo data loggers (Onset, Bourne, Massachusetts, United States of America) in currant bushes at the Union Gap and Cowiche sites. In 2025, we deployed one data logger at Union Gap. Hourly air temperatures and relative humidity were recorded during the entirety of the fruiting phenology and fly-catch monitoring periods in both years.
Do the two fly species differ in eclosion timings in the laboratory? (2024)
To evaluate the relationship of adult fly activity periods with eclosion timing, we reared E. canadensis and R. ribicola collected as larvae in infested fruit from Union Gap in 2024 to adulthood under controlled conditions (see the section, Do the two fly species tend to infest fruit of different stages? What are the abundances and niche overlaps of larvae of the two flies? (2023, 2024, and 2025), below, for 2024 fruit collection dates and numbers at Union Gap). Fruit were transported to the laboratory and placed in plastic tubs held at approximately 21 °C. Larvae emerging from fruit and pupating in the tubs were collected daily. Puparia were placed in moist white aquarium sand inside 59-mL plastic cups, each cup containing from one to 50 puparia. Puparia in cups were then chilled at a mean temperature of 3.7 °C (range, 2.6–5.3 °C) for 180–186 days. There were 22 and 72 replicate cups for E. canadensis and R. ribicola, respectively. Puparia in cups (100% relative humidity) were then transferred to a mean temperature of 23.8 °C (range, 20.3–26.7 °C) under a 16:8-hour light:dark photoperiod. Cups were monitored for newly eclosing flies on weekdays for 60 days following chilling, with adults collected on Monday assigned the preceding Sunday eclosion date.
Do distributions of fly eggs and larvae depend on fruit maturity stages and, related to this, are eggs laid singly? (2024)
In 2024, we determined (1) the distribution of eggs and larvae present in golden currant fruit at varying stages of maturation, and (2) the proportions of eggs laid singly into fruit. Fruit samples were randomly collected from five bushes in 2024 at Union Gap on 20 May and 10 and 17 June (n = 334–1089 fruit per date). In addition, one sample each was made on 17 June at Cowiche (n = 1107 fruit) and Selah (n = 773 fruit). Four samples were collected from 18 May to 7 June at Tampico (n = 252 total fruit). In the laboratory, currants were divided into the five colour stages (Fig. 1F). Fruit were classified into colour categories within approximately 4 hours of collection because we had found that fruit changed colour within one day of collection. Under a microscope, each fruit was examined and opened using forceps, and the numbers of eggs and larvae present counted. The species identity of fly eggs and larvae feeding within fruit were not determined.
Do the two fly species tend to infest fruit of different stages? What are the abundances and niche overlaps of larvae of the two flies? (2023, 2024, and 2025)
We determined whether larvae of E. canadensis and R. ribicola occur in different maturation stages of golden currant fruit and at different times of the season in 2023, 2024, and 2025 by rearing larvae from each fruit stage. Time and fruit stage maturity are naturally linked because fruit mature as the season progresses. Sampling strategies differed across the three years as we learned how to maximise information from collections. In 2023, collections were made at one site to determine when the two species infest fruit over the season; after we determined this, we incorporated more sites in 2024 to see if the result was repeatable across sites; after that, in 2025, we asked whether infestations by the two species could be divided into the three periods of May, June, and July, adjusting our fruit collections with this in mind. From data on infestation in different fruit stages in 2024 and 2025, we also obtained larval abundance and niche overlap metrics.
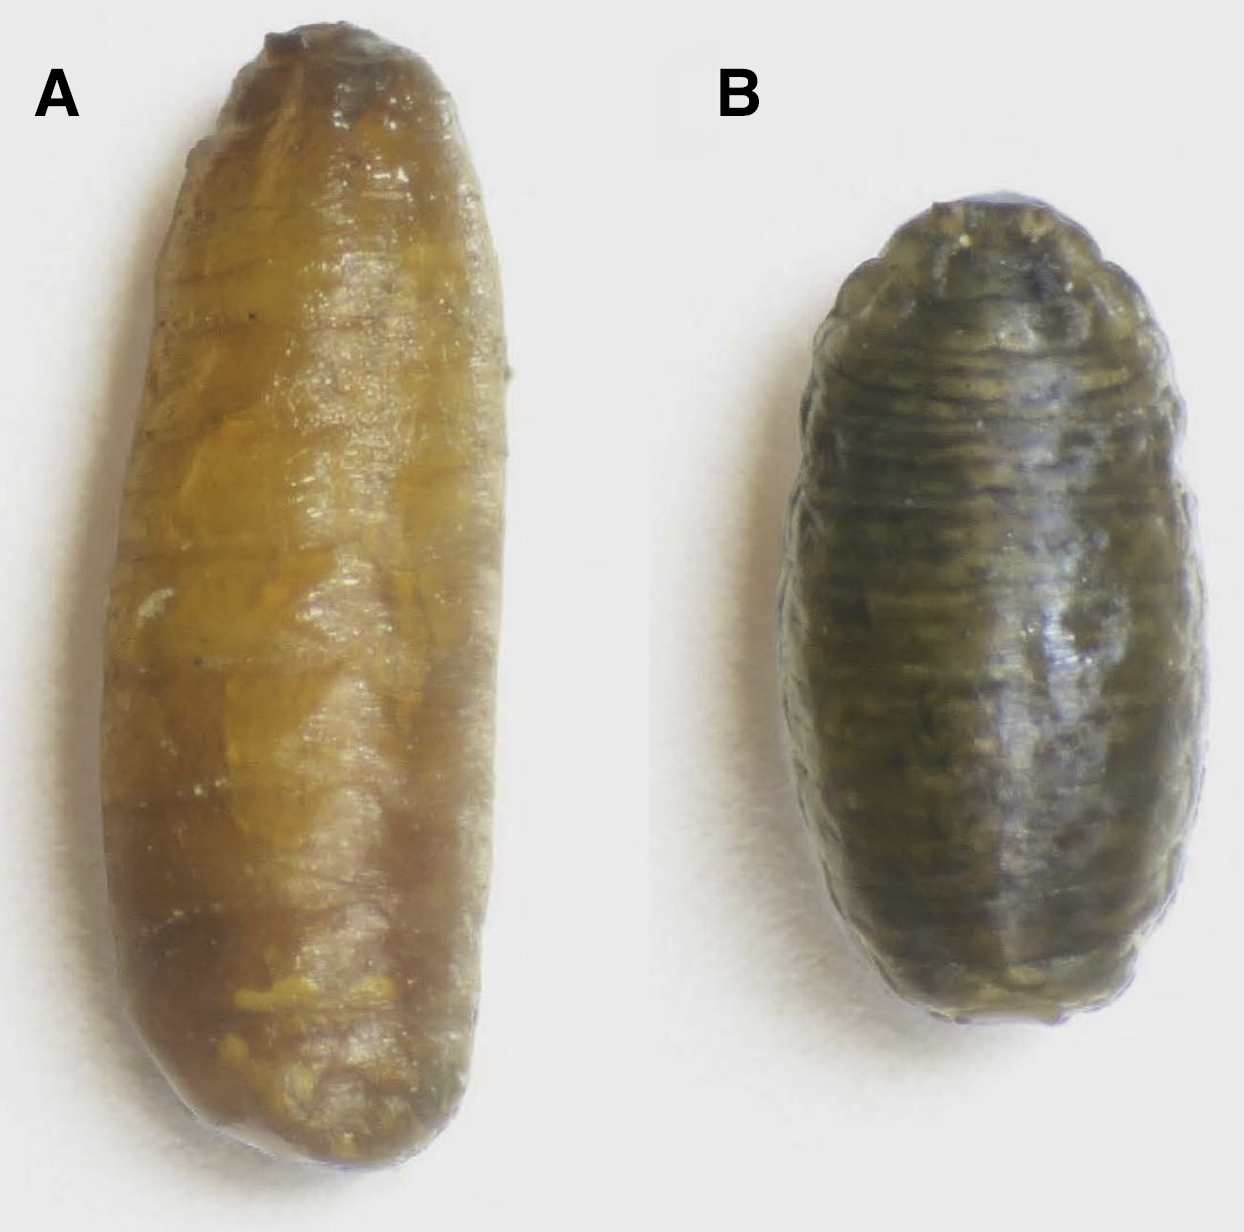
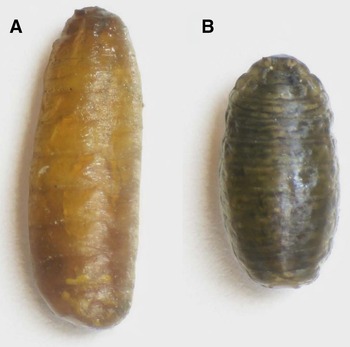
We randomly collected fruit from 5–20 bushes at six sites from 2023 to 2025 and transported the fruit to the laboratory for monitoring. In 2023, we sampled Union Gap; in 2024, we sampled Union Gap, Cowiche, and Tieton; and in 2025, we sampled Benton City, Bickleton, Ellensburg, Slavin Road, and Nile. In 2023, we collected fruit for 11 weeks, from 19 May to 14 July (21–2460 fruit per week; total of 4859). In 2024, collections were made 10 times, from 7 May to 2 July, at Union Gap (79–4482 fruit per date) and once each, on 7 June, at Cowiche (1095 fruit) and Tampico (896 fruit). In 2025, fruit were collected from 12 to 16 May, from 4 to 20 June, and from 9 to 17 July (589–8741 fruit per site per date), although not all sites were sampled during all three periods. We did not record the colours of fruit in 2023, but we did record them in 2024 and 2025. Fruit belonging to each of the five colour classes (Fig. 1F) in 2024 and 2025 were held in separate tubs for larvae to emerge and pupate. Puparia in the tubs were counted every 3–5 days until 30 days post-fruit collection, when all fruit had dried, after which no more larvae emerged. We stopped monitoring after 30 days and counted the dried fruit 1–2 months later, at which time no puparia were recovered. Puparia were identifiable to species: E. canadensis puparia (Fig. 2A) are elongate and tan, and R. ribicola puparia are stouter and dark grey or black (Fig. 2B).
Puparia of A, Euphranta canadensis (4.35 mm length) and B, Rhagoletis ribicola (2.80 mm length; same scale) from golden currant (Ribes aureum) fruit at Union Gap, Washington state, United States of America, in June 2024.
Do emergence timings of larvae of the two fly species from fruit following fruit collection differ? (2024, 2025)
As an extension of the previous questions, in 2024, we investigated when larvae of the two species emerged from the same fruit collections. Differences in emergence timing could reflect different-aged immature insect stages being present in fruit, mitigating interspecific competition among larvae. Fruit from about 10–15 bushes at the Union Gap, Tieton, and Cowiche sites were collected. Colours of representative subsamples of fruit were recorded (89–4302 per collection date). We sampled bushes at Union Gap eight times, on 8 and 20 May, 10, 11, 17, 20, and 25 June, and 2 July (161–7280 fruit per collection date). We sampled bushes at Tieton three times, on 28 May, 19 June, and 3 July, and at Cowiche once, on 17 June (255–3578 fruit per collection date). Numbers of larvae that emerged every 1–3 days were counted until 30 days after fruit collection, and their species identities were recorded. In 2025, we also followed emergence timing from a Cowiche sample collected on 16 June (2988 fruit).
Statistics
Seasonal catches of E. canadensis and R. ribicola
We assigned a number to each week of the season to determine whether catch timing of E. canadensis and R. ribicola differed (week 1 was one week after traps were deployed, week 2 was two weeks after deployment, and so forth). We used the Mann–Whitney U test to analyse weeks of fly catches on traps at Union Gap, where data were not normal and (or) where variances were not equal (Shapiro–Wilk test and Brown–Forsythe test of homogeneity of variance were P < 0.05). An independent t-test was used for catch-time data from Cowiche, where data were normal with no differences in variances. We present means (± standard error of the mean) so that data are biologically meaningful, but we also present mean rank sums (adjusting for sample size) when the Mann–Whitney U test was used.
Overlap in trap catches of fly species
Overlap in catches between the two fly species was estimated in two ways. The first estimate was based on the method of Batkhan (Reference Batkhan2022), with the length of overlap in trap catches, equating to flight periods of the two species, calculated as the minimum (A2, B2) − maximum (A1, B1) + 1, where A2 and B2 represent the last weeks and A1 and B1 the first weeks of E. canadensis and R. ribicola catches, respectively. The second estimate was calculated as the percent overlap in which the two species co-occurred out of the total catches in the season.
Do abundances of the two flies differ?
We conducted four separate analyses of fly abundance. At the Union Gap site in 2024, we compared (1) female E. canadensis versus female R. ribicola, and (2) male E. canadensis versus male R. ribicola; at the Cowiche site in 2024, we also compared (3) females and (4) males of the two species separately. An insufficient number of flies were captured at Tampico for analyses. For each of the four analyses, we used the PROC GENMOD procedure in the Statistical Analysis System (SAS Institute Inc. 2023), which fits counts using the Poisson distribution in a generalised linear model. In the SAS output, the Pearson and deviance chi-square statistics divided by their degrees of freedom were substantially greater than 1, indicating overdispersion. We therefore modelled overdispersion using the negative binomial distribution, which resulted in significant maximum likelihood estimates of the dispersion parameter, suggesting the negative binomial was appropriate.
Do the two fly species differ in eclosion timings in the laboratory?
Laboratory eclosion times generated for adult E. canadensis versus R. ribicola from larvae from 2024 collections were compared using an independent t-test for females (normal, equal variances) and a Mann–Whitney U test for males.
Do distributions of fly eggs and larvae depend on fruit maturity stages, and related to this, are eggs laid singly?
We conducted R × C contingency analyses to determine if numbers of eggs and larvae in golden currants depended on fruit colour stage. To determine if proportions of different colour fruit with eggs and larvae within fly species differed, tests of multiple proportions, followed by Tukey-type multiple comparisons (Zar Reference Zar1999), were performed.
Do the two fly species tend to infest fruit of different stages, and what are the larval abundances? (2023, 2024, and 2025)
To determine if week of larval infestation (and therefore fruit stage) by E. canadensis differs from that by R. ribicola at Union Gap in 2023, we used a Mann–Whitney U test by designating week 1 as 19 May, up to week 9 as 14 July. Each larva was considered an observation and was assigned a week (1–9) according to the date it was detected infesting a golden currant fruit. For 2024 and 2025 infestation data, the infestation index for both species was the percentage of total fruit producing larvae within each of the five different fruit colour stages. Data for both species within sites in May, June, and July were analysed using a test of multiple proportions, followed by Tukey-type multiple comparisons. The analyses did not include cases in which no fruit of a specific colour stage was found infested on a collection date within a site.
Abundances of larval E. canadensis and R. ribicola in golden currant fruit (combining all fruit maturation stages) were calculated as numbers of larvae per fruit and analysed using a Wilcoxon signed-ranks test. Abundances in May, June, July, and all months combined were calculated using each site–date combination for 2024 and for 2025 as a replicate. One site within a month could be two replicates if sampled on different dates or years.
What are the niche overlaps of larvae of the two flies?
Resource niche overlap between E. canadensis and R. ribicola was calculated for the June 2024 and June 2025 fruit collections from which both species emerged from fruit, and for all months (May, June, and July) and sites combined for each year, using data collected on infestation of fruit of different stages as indicated by larval emergence. The total number of E. canadensis or R. ribicola larvae emerged from all fruit colour stages was determined. Then the proportions of larvae out of the total from each stage were determined, and the overlap was calculated based on the formula of Pianka (Reference Pianka1974), following Krebs (Reference Krebs2014), using the five fruit colour stages as food types, where P ij and P ik are the proportions of E. canadensis (j) and R. ribicola (k) larvae that emerged from a specific fruit colour stage (i) out of total proportion of larvae across all stages, respectively:
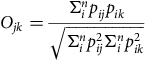 $$O_{jk}={{\Sigma }_{i}^{n}p_{ij}p_{ik} \over \sqrt{{\Sigma }_{i}^{n}{p}_{ij}^{2}{\Sigma }_{i}^{n}{p}_{ik}^{2}}}$$
Do emergence timings of larvae of the two fly species from fruit following fruit collection differ?
For the 2024 post-collection larval emergence data, we conducted Mann–Whitney U tests to determine emergence days of E. canadensis versus R. ribicola. Sufficient larvae of the two species were collected to enable the analyses only for the Union Gap 10–17 June, Tieton 19 June, and Cowiche 17 June collections. Insufficient larvae were collected for the other six site–date combinations for analyses.
Results
Currant bush sizes and fruit loads (2025)
The average size of representative currant bushes at the five sites (Union Gap, Selah, Zillah, Nile, and Slavin Road) in 2025 was 1.8 ± 0.1 m tall (mean ± standard error of the mean) and 2.0 ± 0.2 m wide. The mean of number of fruit was 68 ± 16 per 30.5 cm of branch (range: 26–115). We estimated that more than 50% of bushes across sites had more than 5000 fruit, although fruit numbers were highly variable.
How is fruiting phenology related to differences in seasonal catches of E. canadensis and R. ribicola? (2024, 2025)
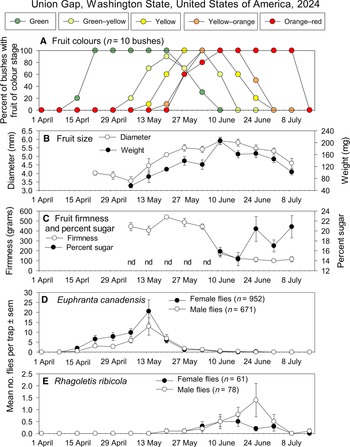
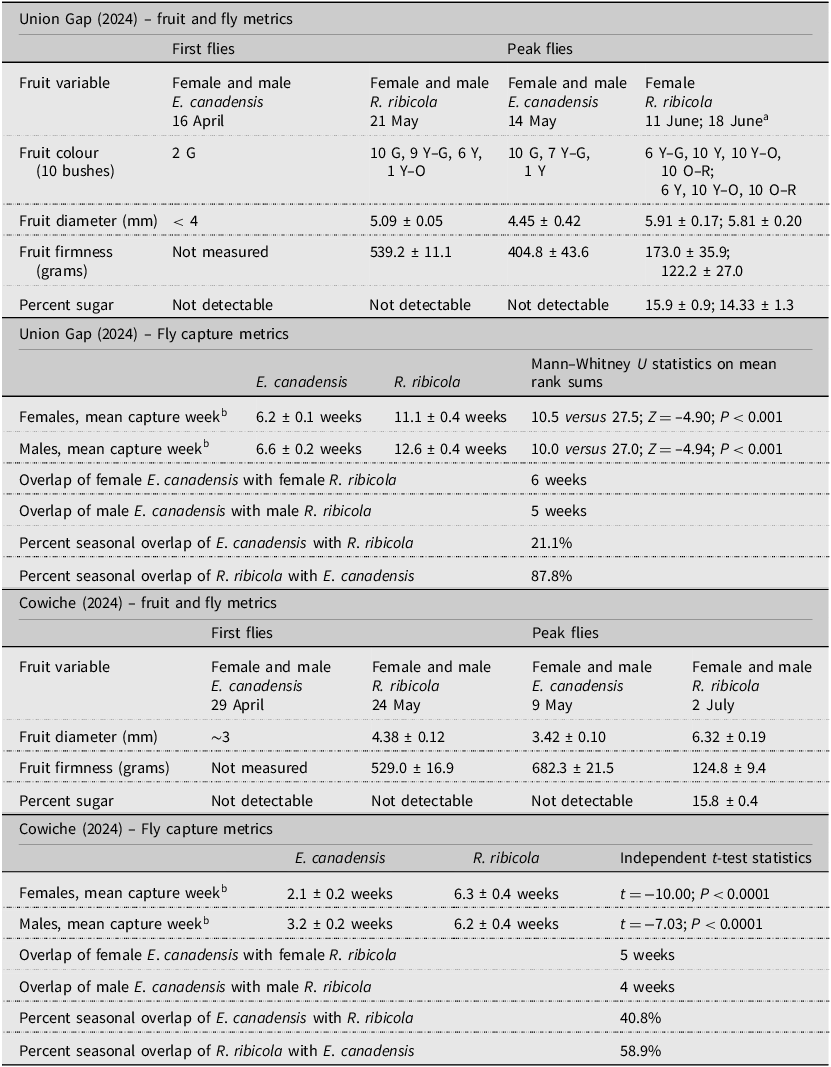
At Union Gap in 2024, only flowers were present on 1 April, but green fruitlets appeared by mid-April, followed by a succession of green to orange–red (and dry) fruit from April to July (Fig. 3A). All fruit dried and deteriorated by mid-July. Fruit of maximum size and orange–red colour indicative of full maturity were seen on 11 June (Fig. 3B), after which fruit declined in firmness while increasing in sugar levels (Fig. 3C). The first adult E. canadensis flies (Fig. 3D) were recorded on 16 April, when 80% of golden currant bushes at sites still had only blossoms and the remaining 20% had green fruit. The first R. ribicola catches (Fig. 3E) occurred on 21 May, when all bushes had green fruit, 90% had green–yellow fruit, 60% had yellow fruit, and 10% had yellow–orange fruit. Currant fruit stage, E. canadensis and R. ribicola catch, and fly overlap metrics are shown in Table 2.
Seasonal distributions of golden currant (Ribes aureum) fruit and flies at Union Gap in Washington state, United States of America, in 2024: A, golden currant fruit colours; B, fruit size ± standard error of the mean; C, fruit firmness and percent sugar content ± standard error of the mean; D, numbers of flies per trap ± standard error of the mean for Euphranta canadensis; and E, Rhagoletis ribicola. There were no fruit on 1 April; only flowers. nd = sugar not detectable. Note: From 1 April to 21 May, the red colour was superimposed on other colours (green–yellow, yellow, and yellow–orange) along the x-axis. Dry fruit are included in orange–red category.
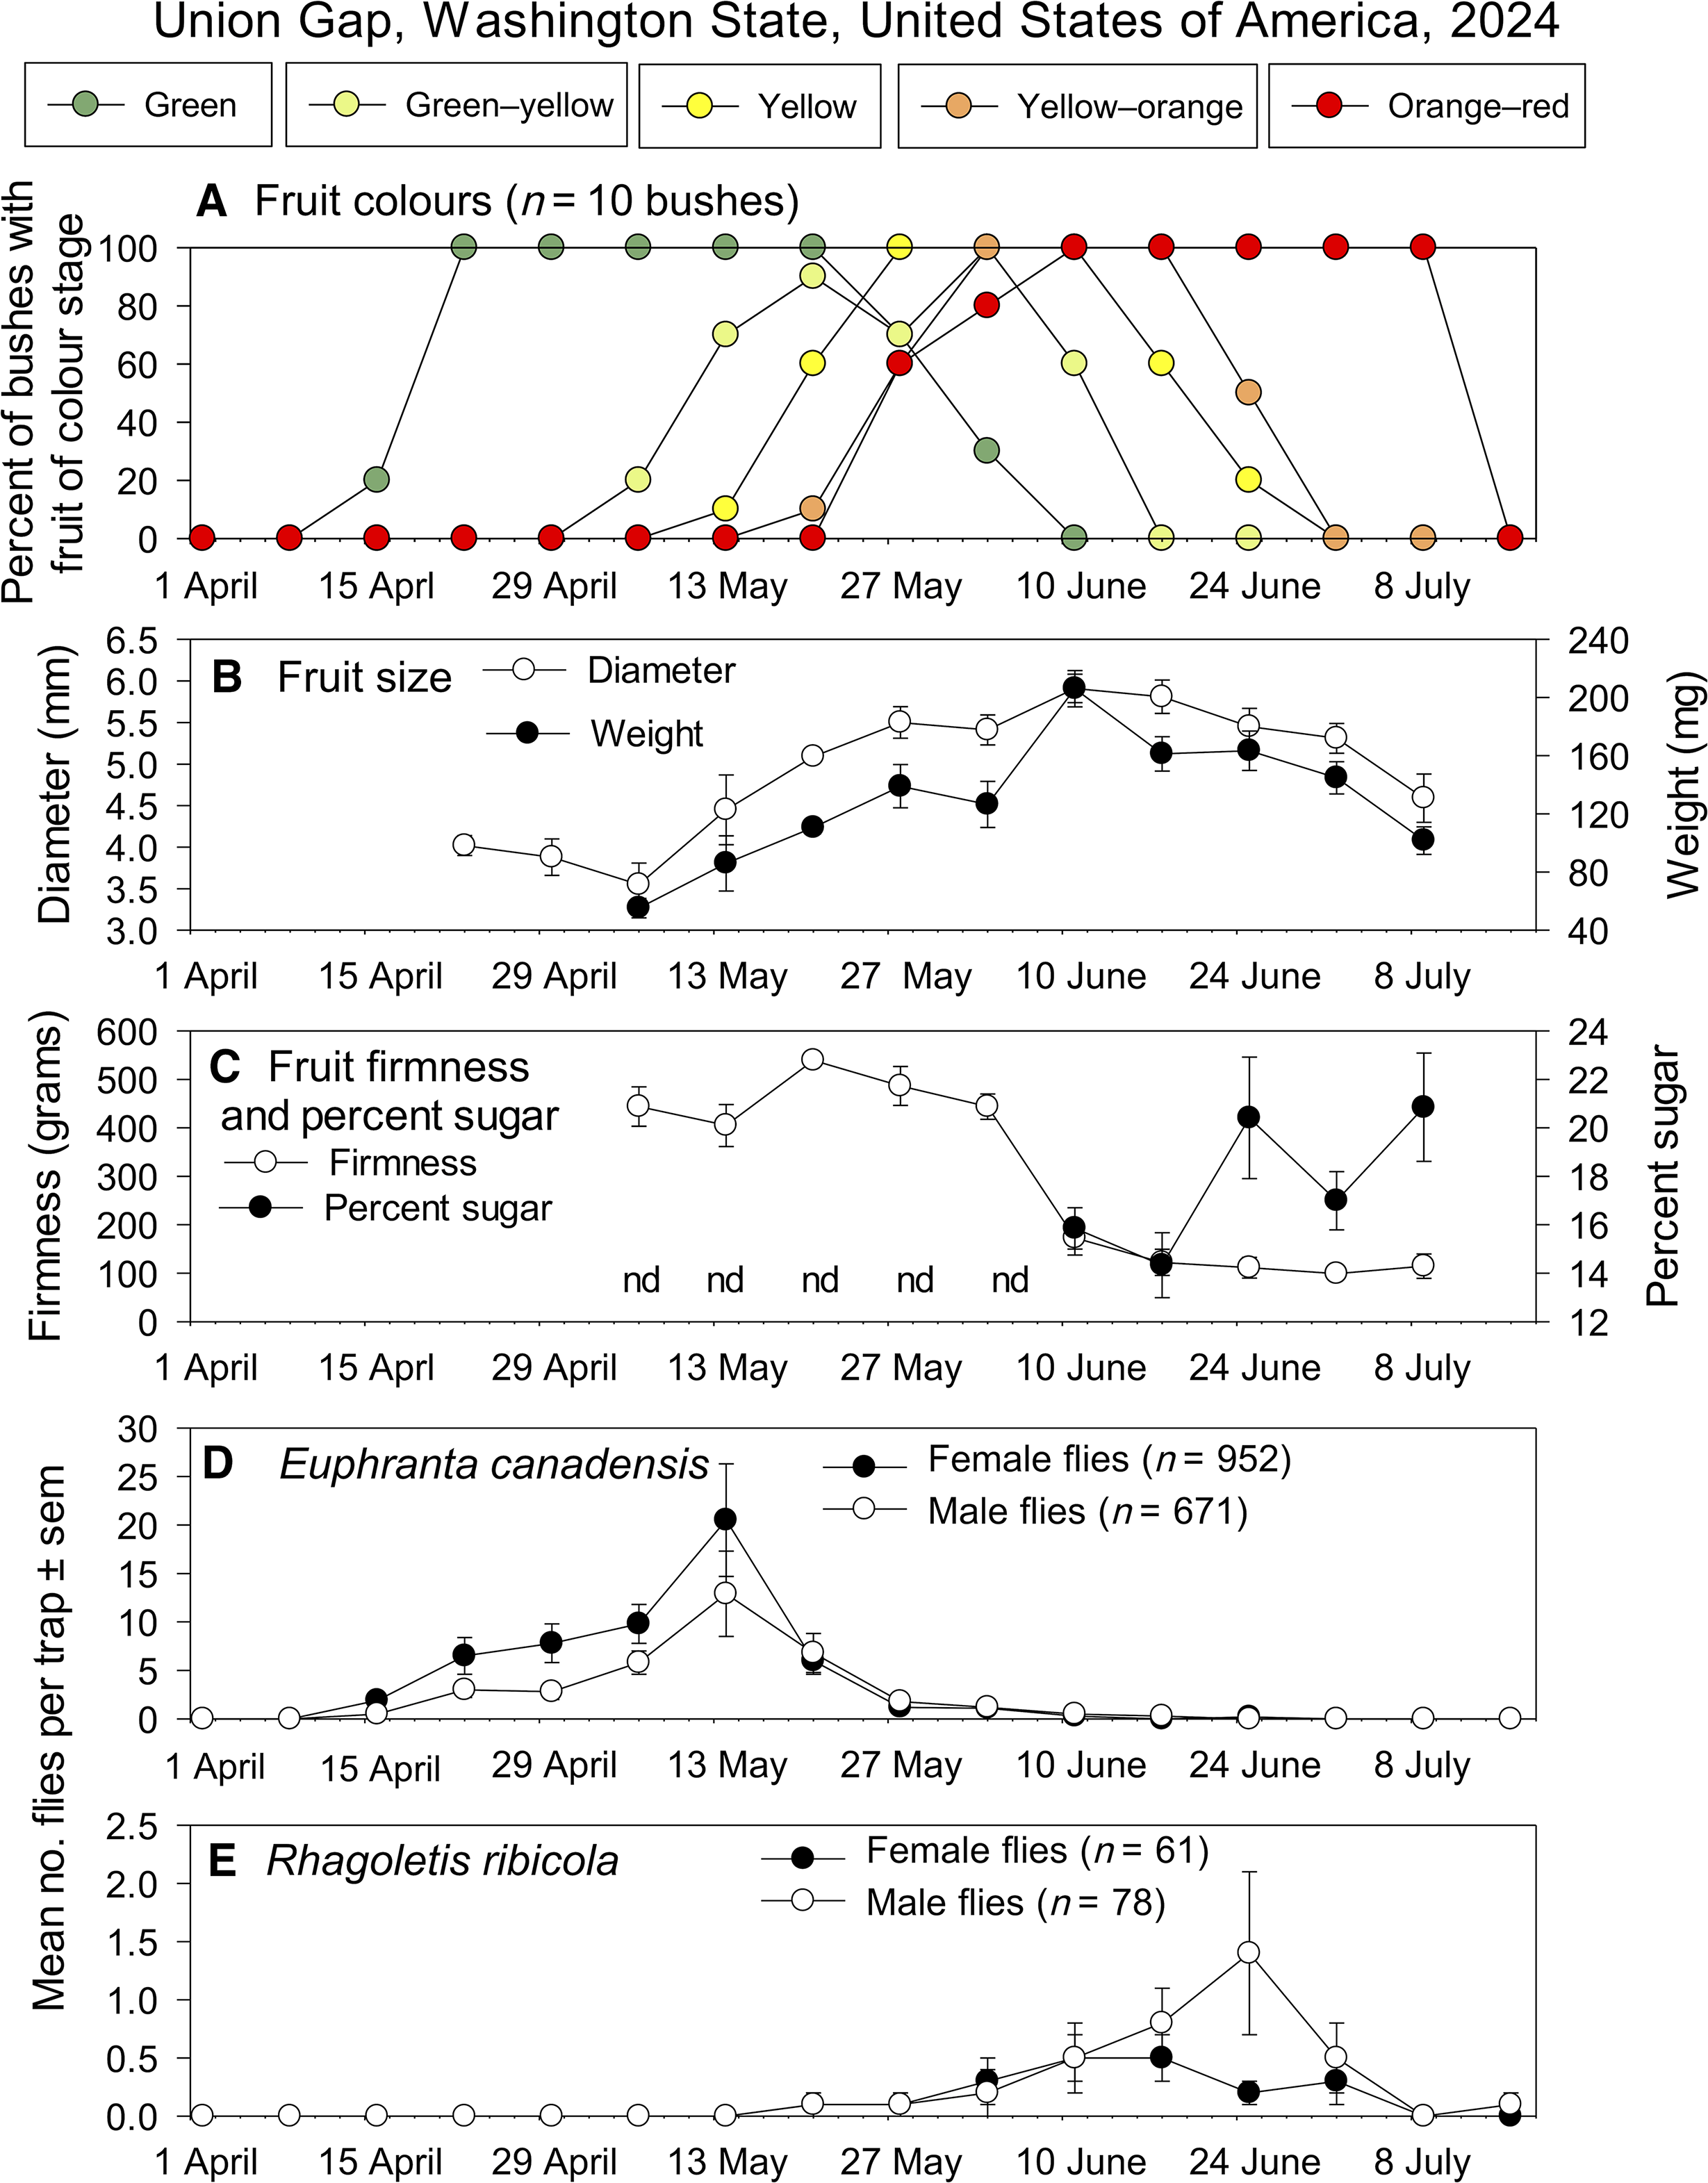
Figure 3. Long description
Panel A: A line graph shows the percent of bushes with fruit of different color stages from April to July. The colors include green, green-yellow, yellow, yellow-orange, and orange-red. Panel B: A line graph displays fruit size in terms of diameter (millimeters) and weight (milligrams) over the same period. Panel C: A line graph illustrates fruit firmness (grams) and percent sugar content over time, with sugar not detectable (nd) on certain dates. Panel D: A line graph presents the mean number of flies per trap for Euphranta canadensis, separated by female and male flies. Panel E: A line graph shows the mean number of flies per trap for Rhagoletis ribicola, also separated by female and male flies.
Golden currant (Ribes aureum) fruit stage (± standard error of the mean), Euphranta canadensis and Rhagoletis ribicola capture (± standard error of the mean), and fly overlap metrics at Union Gap and Cowiche in Washington state, United States of America, in 2024. Fruit colours: G = green; Y–G = yellow–green; y = yellow; Y–O = yellow–orange; O–R = orange–red. Numbers before colours are numbers of bushes out of a maximum of 10 with fruit of that colour. Fruit colours were not recorded in Cowiche. “Female and male” means both sexes were on traps on the same date. aMale R. ribicola in Union Gap peaked on 25 June: fruit colour: 2 Y, 5 Y–O, 10 O–R; fruit diameter: 5.45 mm; fruit firmness: 111.3 grams; percent sugar: 20.4. bWeek 1 was 1 week after traps were deployed, week 2 was 2 weeks after deployment, and so forth.
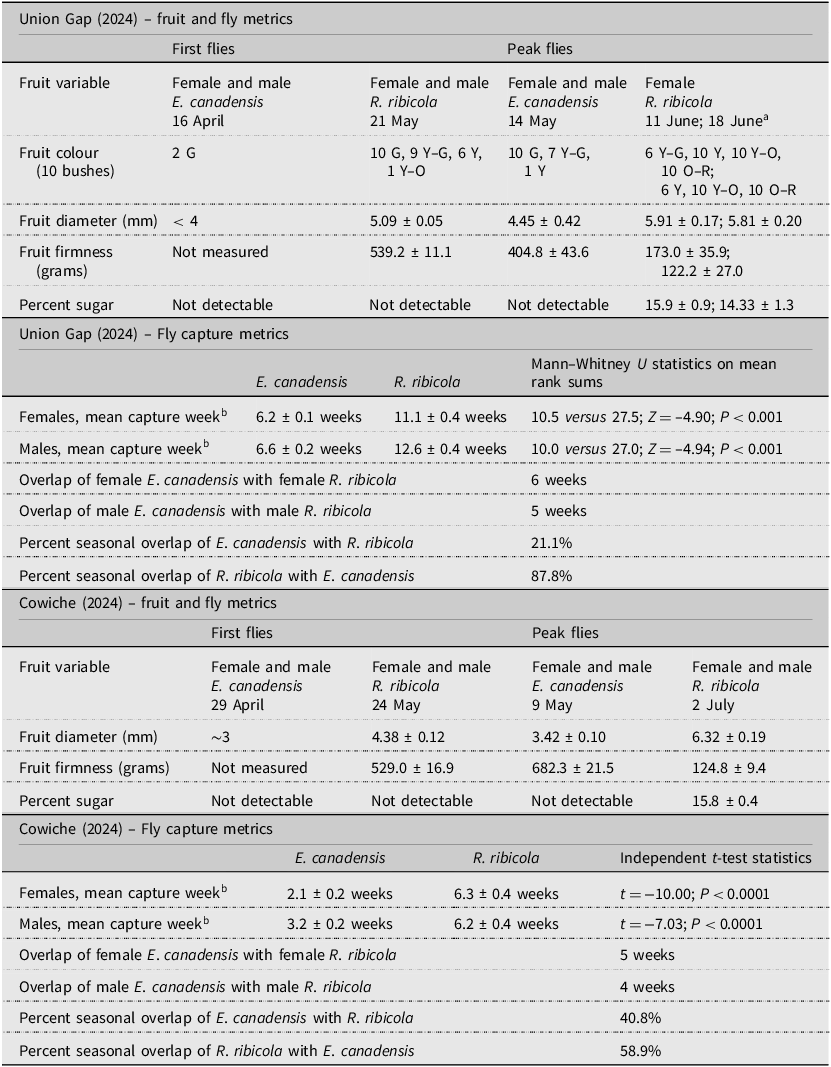
Table 2. Long description
A table comparing fruit and fly metrics for golden currant at Union Gap and Cowiche in Washington state in 2024. The table has two main sections, one for each location, with columns for first flies and peak flies, and rows for various fruit variables and fly capture metrics. For Union Gap, the first flies section includes data on fruit colour, diameter, firmness, and percent sugar, as well as fly capture metrics for female and male flies. The peak flies section includes similar data. For Cowiche, the table provides similar information. The table also includes statistical analysis of fly capture metrics.
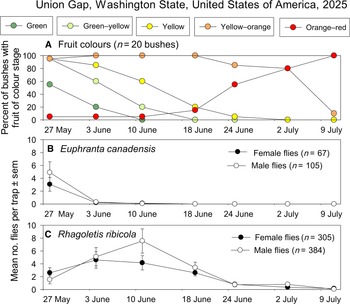
At Union Gap in 2025, E. canadensis adults were caught earlier and were largely gone by the time numbers of R. ribicola began increasing. Sixty per cent of bushes had green fruit on 27 May (Fig. 4A), when most E. canadensis were caught on traps (Fig. 4B). Sixty per cent of bushes had green–yellow fruit and 85% had yellow fruit on 3 June (Fig. 4A), when the peak number of female R. ribicola was caught (Fig. 4C). Peak male R. ribicola catch occurred on 10 June, when 20% of bushes had green–yellow fruit and 60% had yellow fruit.
Seasonal distributions of golden currant (Ribes aureum) fruit and flies at the Union Gap site in Washington state, United States of America, in 2025: A, golden currant fruit colours; B, numbers of flies per trap ± standard error of the mean for Euphranta canadensis; and C, Rhagoletis ribicola. Dry fruit are included in orange–red category.
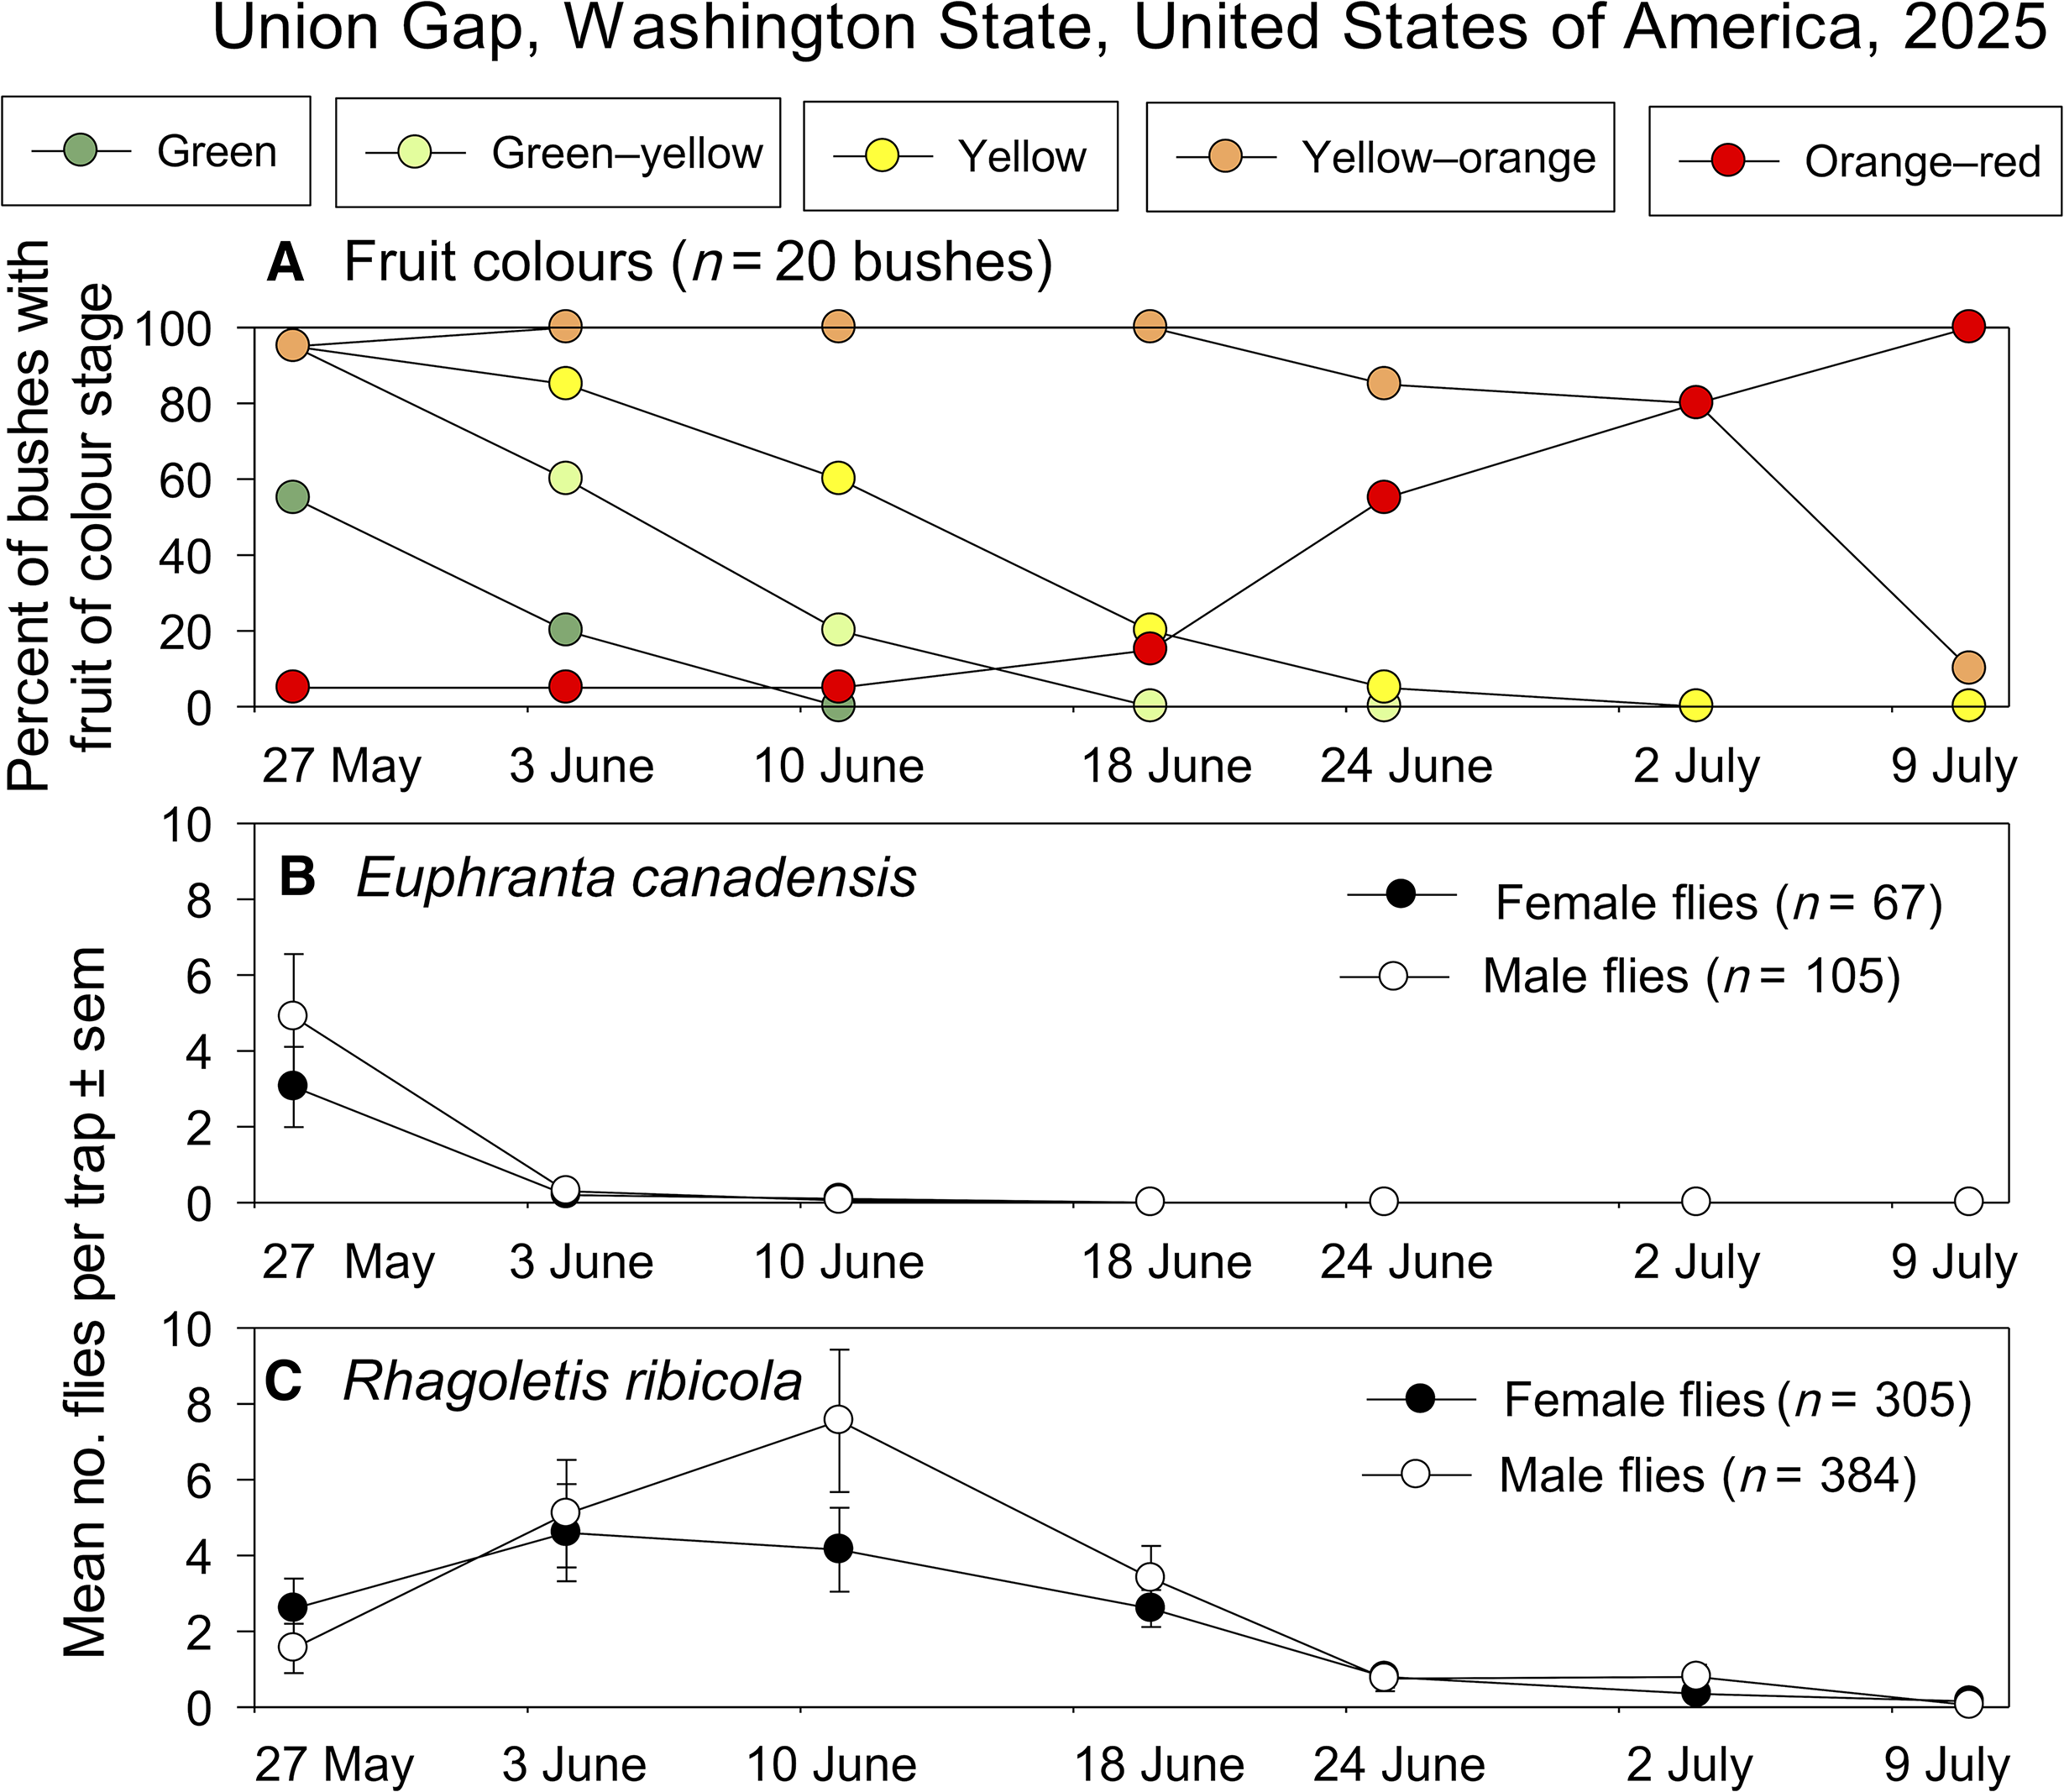
Figure 4. Long description
Three line graphs illustrate the seasonal distributions of golden currant fruit colors and fly populations in Union Gap, Washington State, USA, in 2025. Panel A shows the percentage of bushes with fruit of various colors over time, with colors ranging from green to orange-red. The x-axis represents dates from May 27 to July 9, and the y-axis represents the percent of bushes. Panel B depicts the mean number of flies per trap plus or minus standard error of the mean for Euphranta canadensis, with separate lines for female and male flies. The x-axis represents dates from May 27 to July 9, and the y-axis represents the mean number of flies per trap. Panel C shows similar data for Rhagoletis ribicola. The graphs indicate trends in fruit color changes and fly populations over the growing season.
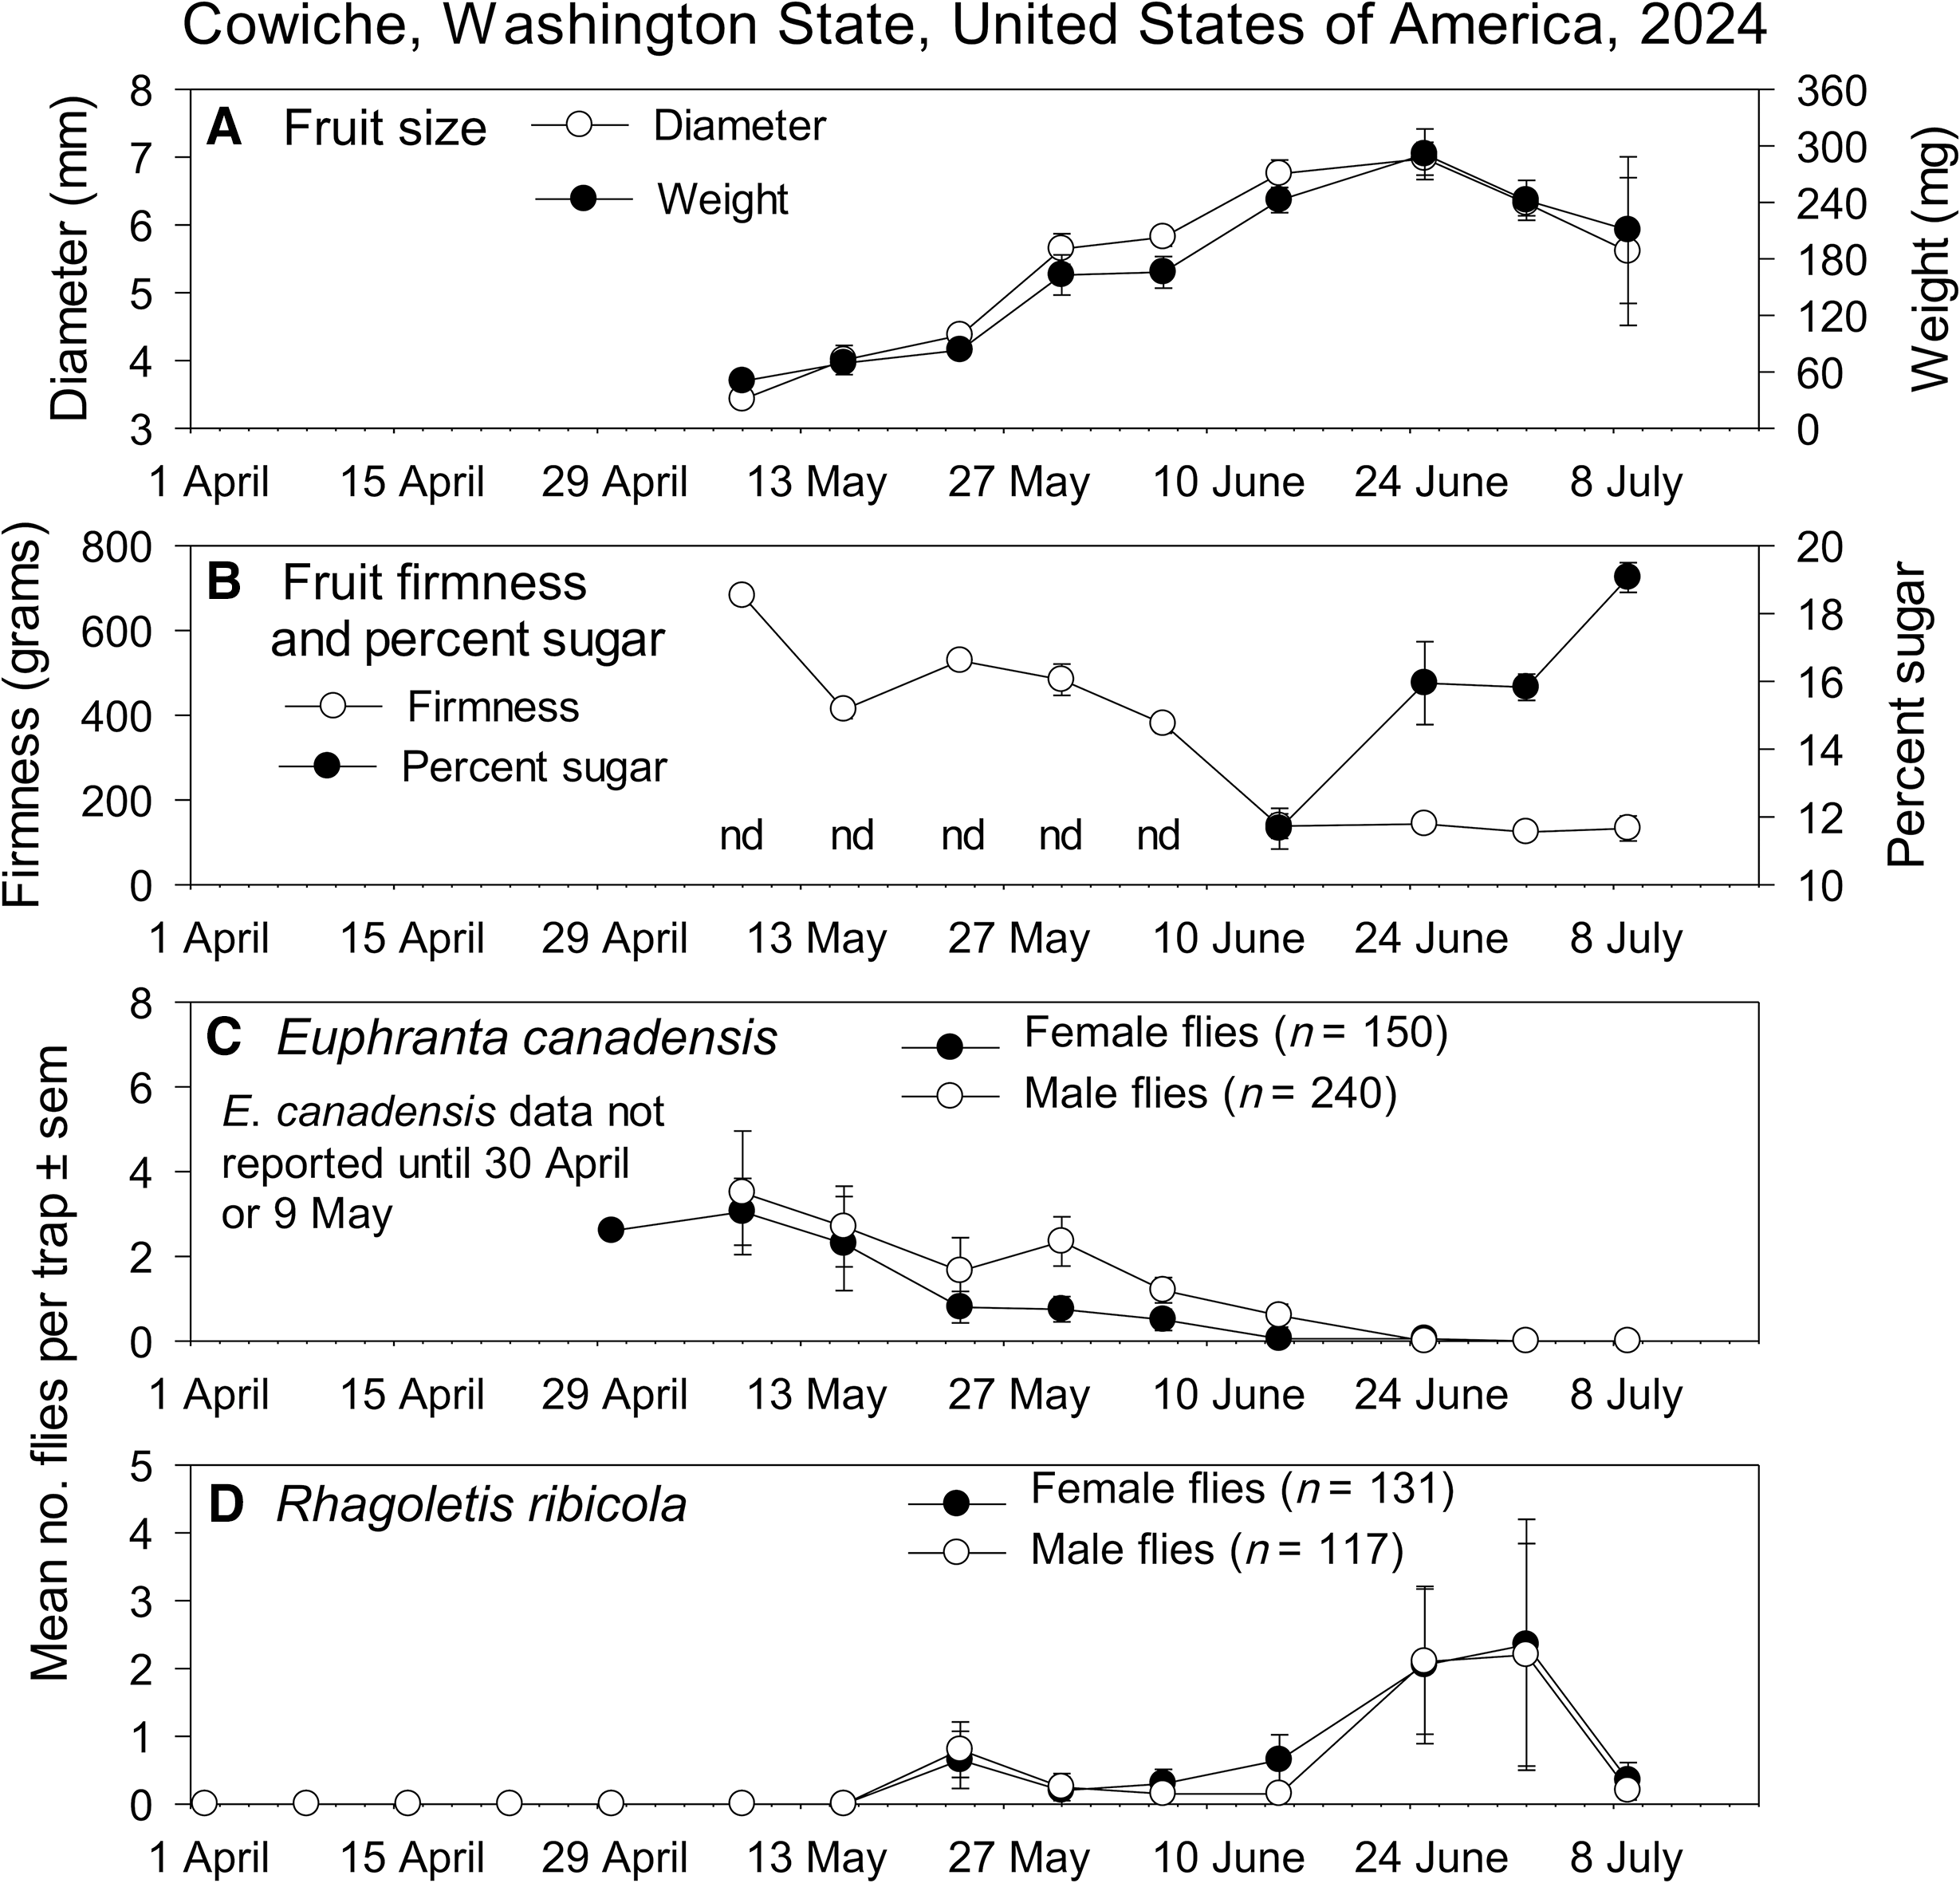
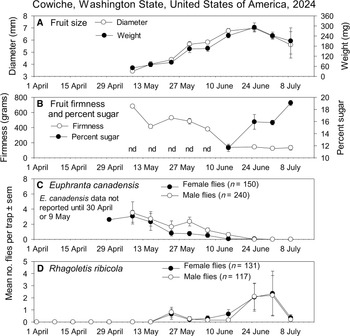
At Cowiche in 2024, fruit were increasing in size (Fig. 5A), were relatively firm, and had no detectable sugar levels (Fig. 5B) on 9 May, when E. canadensis abundance peaked (Fig. 5C). In contrast, R. ribicola (Fig. 5D) was first caught on 24 May, when fruit had stabilised in size. Currant fruit stage, E. canadensis and R. ribicola catch, and fly overlap metrics are shown in Table 2.
Seasonal distributions of golden currant (Ribes aureum) fruit and flies at the Cowiche site in Washington state, United States of America, in 2024: A, fruit size ± standard error of the mean; B, fruit firmness and percent sugar content ± standard error of the mean; C, numbers of flies per trap ± standard error of the mean for Euphranta canadensis; and D, Rhagoletis ribicola. nd, sugar not detectable.
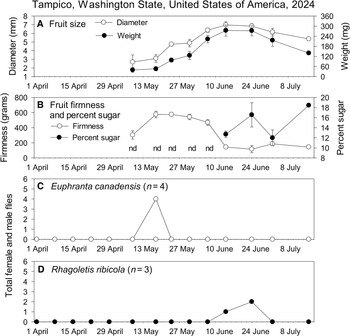
At Tampico in 2024, maximum fruit size (Fig. 6A), decreased firmness, and increased sugar levels (Fig. 6B) occurred in early July. Although only seven total flies were caught over the season at this site, E. canadensis (Fig. 6C) adults were trapped before fruit were at maximum size, when they were firm with no detectable sugar. In contrast, R. ribicola adults (Fig. 6D) were caught when fruit had reached maximum size, with declining firmness and 16.6% sugar content. Therefore, fruit maturity–fly detection relationships were similar at Tampico in 2024 to those at the two other sites. Due to the low fly catch numbers, we do not include Tampico data in Table 2.
Seasonal distributions of golden currant (Ribes aureum) fruit and flies at the Tampico site in Washington state, United States of America, in 2024: A, fruit size ± standard error of the mean; B, fruit firmness and percent sugar content ± standard error of the mean; C, numbers of flies per trap ± standard error of the mean for Euphranta canadensis; and D, Rhagoletis ribicola. nd, sugar not detectable.
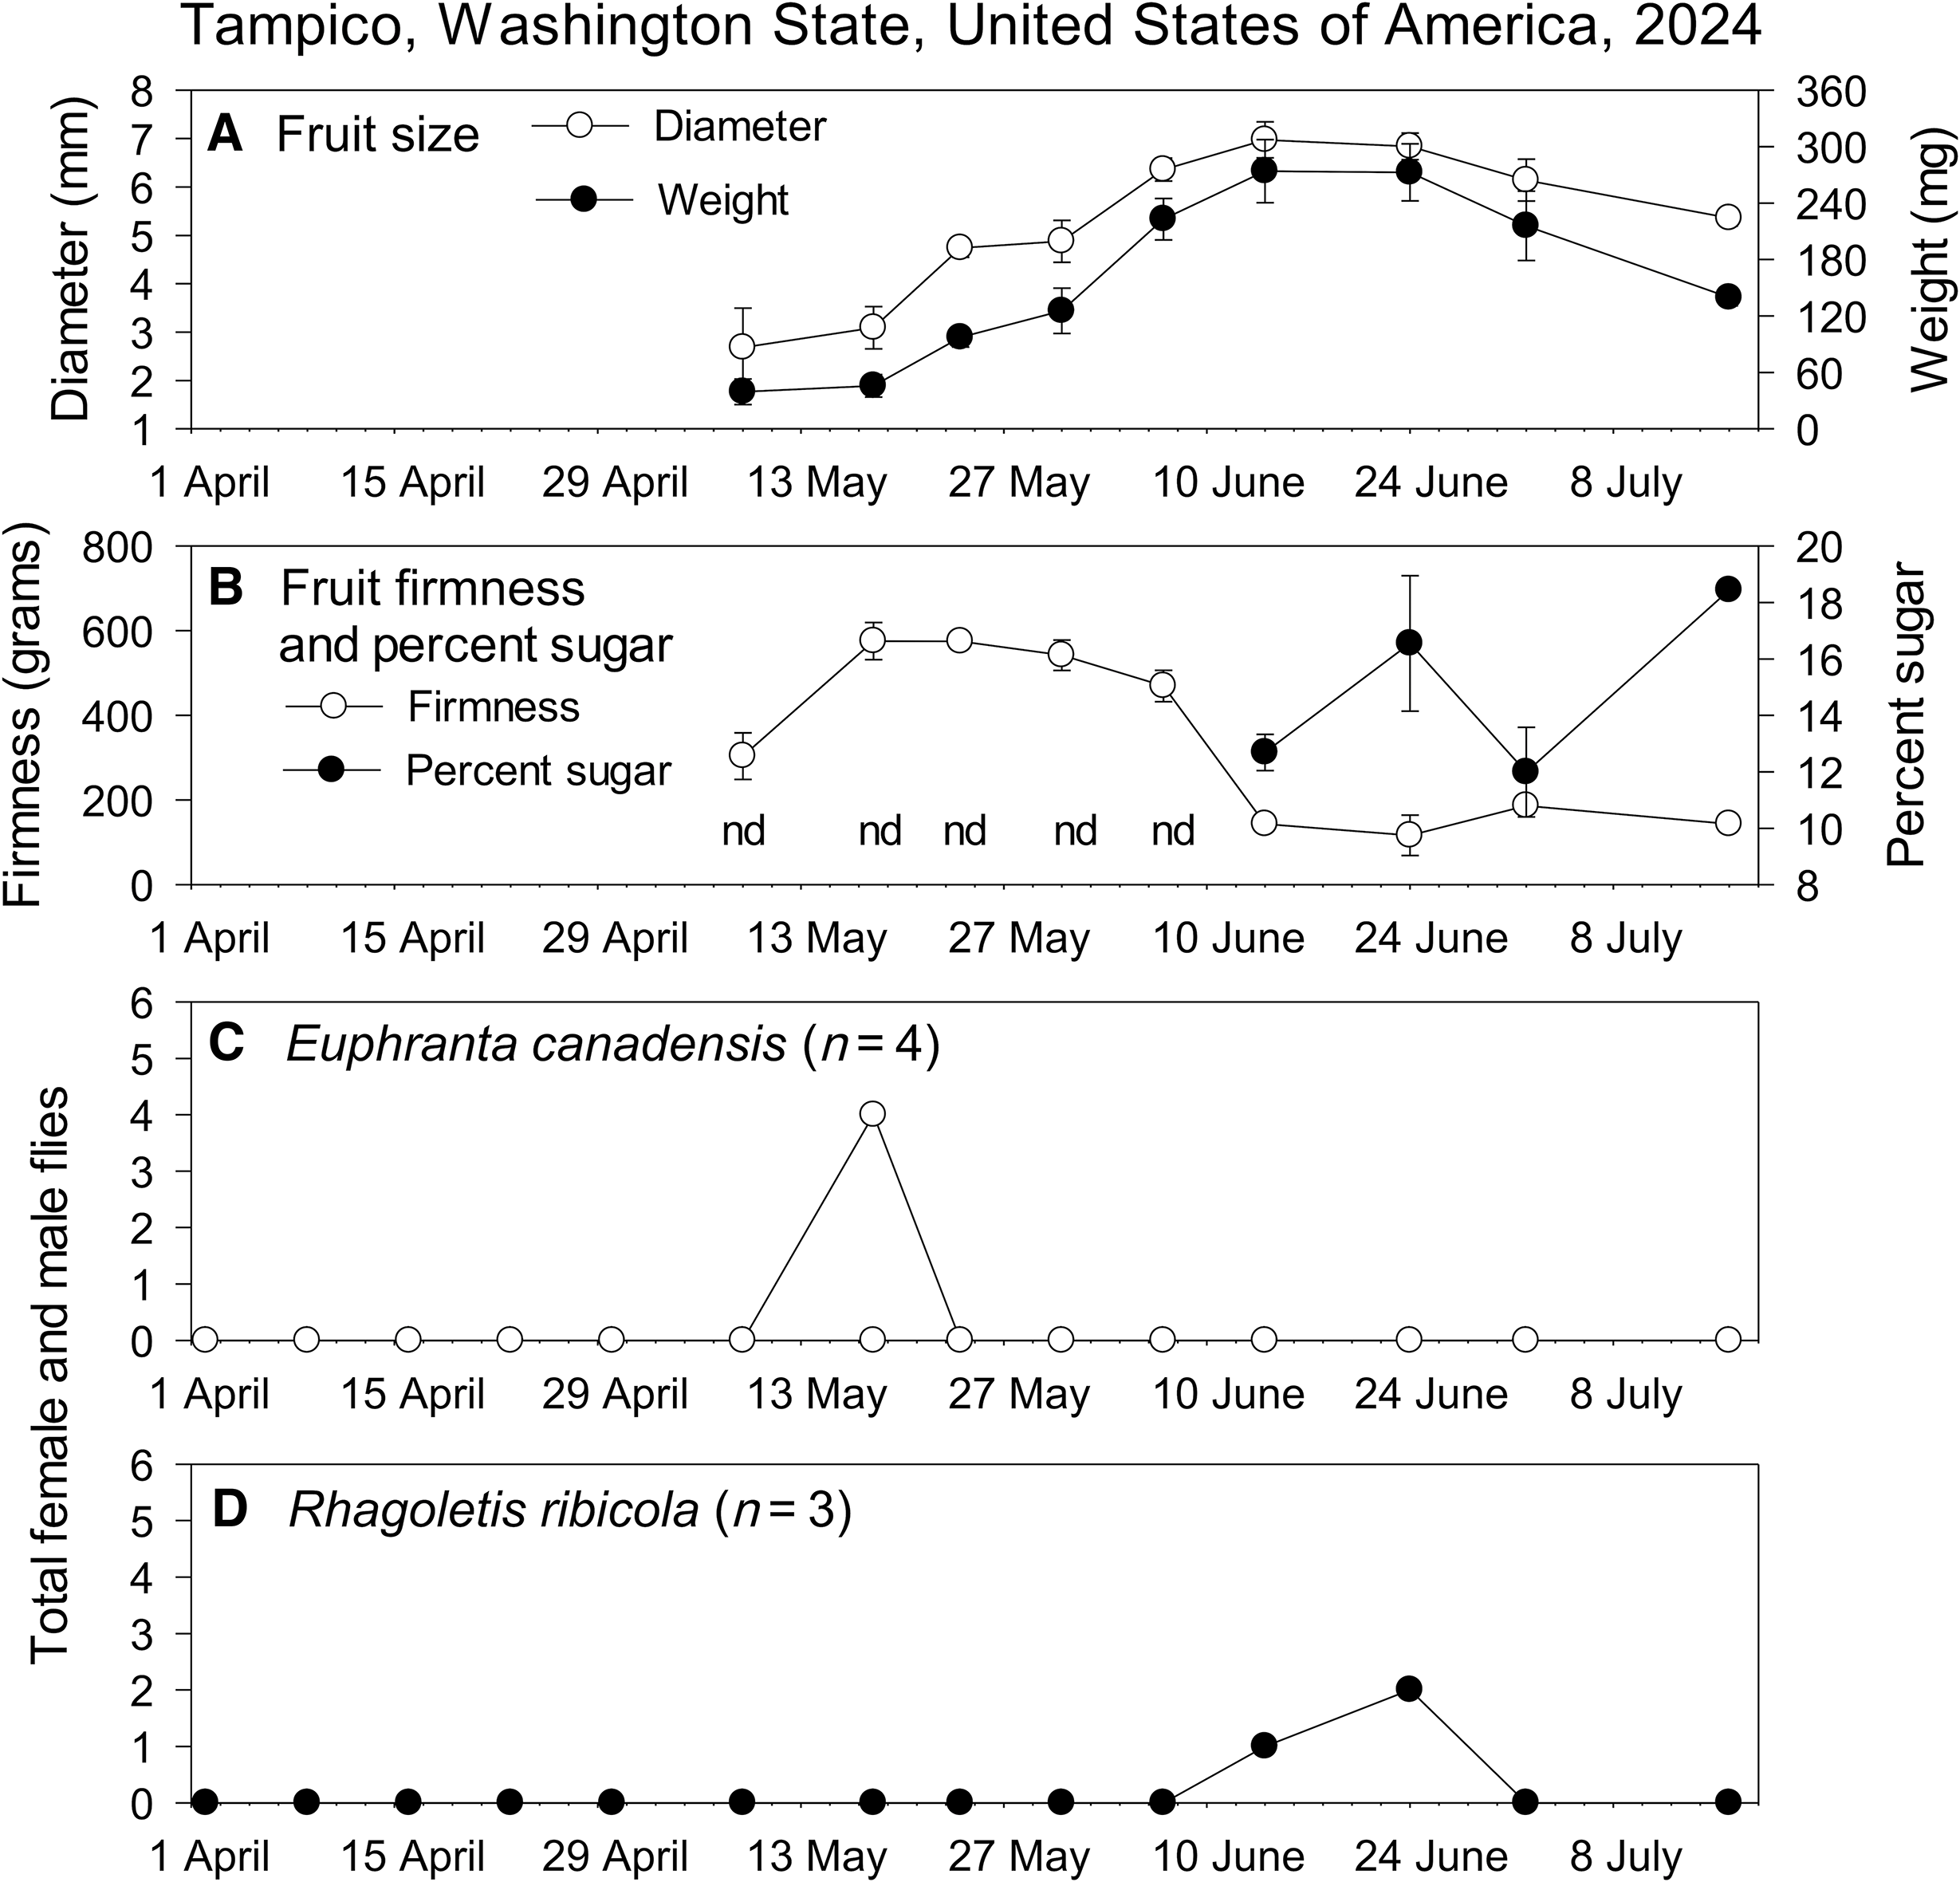
Figure 6. Long description
Panel A: A line graph shows the fruit size over time, with diameter in millimeters on the left y-axis and weight in milligrams on the right y-axis. The x-axis represents dates from April to July. The graph includes two lines: one for diameter and one for weight, both showing an increase until mid-June, followed by a decline. Panel B: Another line graph displays fruit firmness in grams on the left y-axis and percent sugar on the right y-axis over the same time period. Firmness peaks around mid-May and declines thereafter, while percent sugar is not detectable until late May, then increases. Panel C: A line graph illustrates the number of Euphranta canadensis flies per trap, with the y-axis showing the count and the x-axis representing dates. A notable peak occurs around mid-May. Panel D: A line graph shows the number of Rhagoletis ribicola flies per trap, with the y-axis indicating the count and the x-axis showing dates. A small peak is observed around late June.
Do abundances of the two flies differ? (2024)
Assuming traps were equally attractive to both species (no data tested this assumption), at Union Gap in 2024, female E. canadensis was approximately 15 times more abundant than R. ribicola (47.6 ± 10.8 versus 3.1 ± 1.1 flies per trap; z = 3.68; P = 0.0002), with male E. canadensis approximately nine times more abundant than male R. ribicola (33.5 ± 8.1 versus 3.9 ± 1.5 flies per trap; z = 3.24; P = 0.0012). However, at Cowiche (starting on 7 May), abundance of female E. canadensis and female R. ribicola did not differ (6.7 ± 1.7 and 5.9 ± 3.3 flies per trap, respectively; z = 0.24; P = 0.8131), nor did abundance of male E. canadensis and male R. ribicola (9.8 ± 2.4 and 5.7 ± 2.8 flies per trap, respectively; z = 1.15; P = 0.2482). As shown in Figures 6C and 6D, only seven total flies (four E. canadensis and three R. ribicola) were trapped at Tampico, so data from that site were not analysed statistically.
Seasonal air temperatures and adult fly catch periods (2024, 2025)
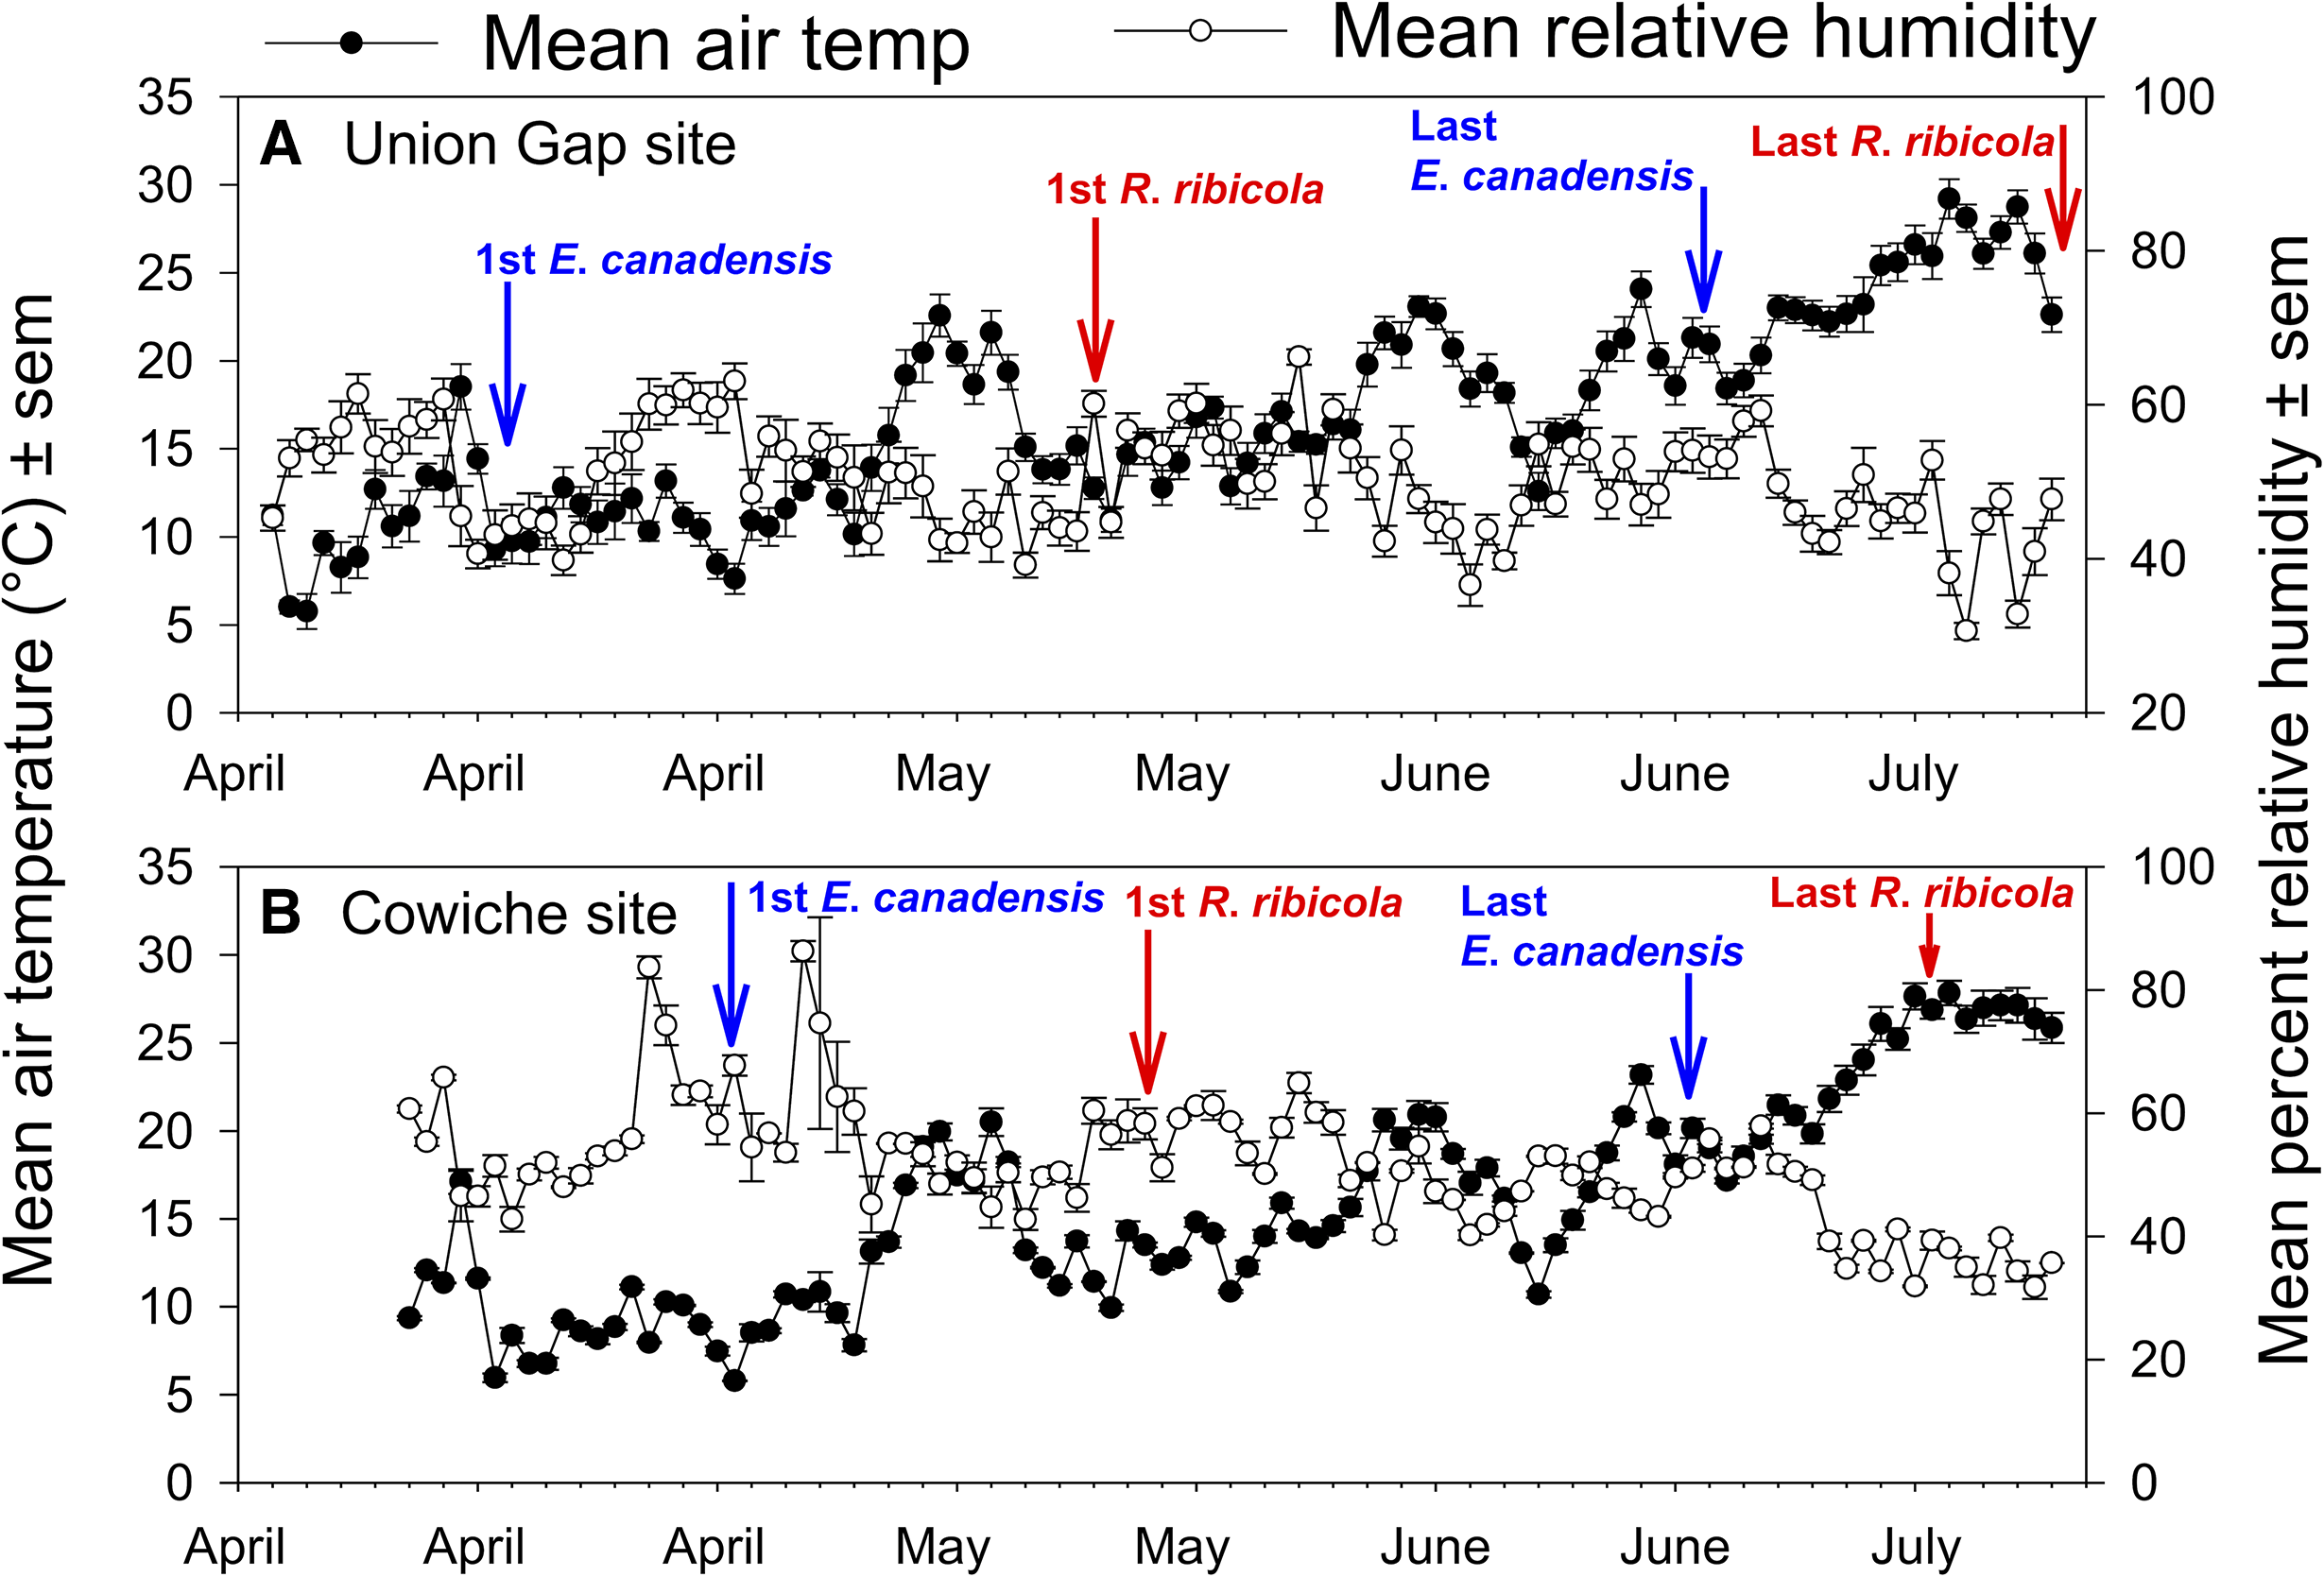
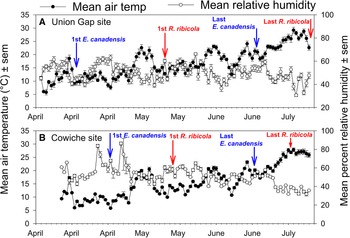
In 2024 at Union Gap (Fig. 7A) and Cowiche (Fig. 7B), more E. canadensis than R. ribicola were caught during the earlier, cooler part of the season (means per day are averaged from 24 hourly points). The mean temperature when E. canadensis was caught from 16 April to 25 June was 15.5 °C (range: 7.6–24.1 °C) versus 19.9 °C for R. ribicola (10.9–29.2 °C) from 21 May to 16 July. Mean relative humidity during each of the two respective periods was 50.5% and 49.5%. At Cowiche, the mean temperature when E. canadensis was caught from 29 April to 25 June was 14.8 °C (–2.1–35.0 °C) versus 18.1 °C (0.2–41.0 °C) when R. ribicola was caught from 24 May to 9 July. Mean relative humidity during each of the two respective periods was 53.3% and 49.5%. In 2025 at Union Gap (not shown in a figure), the mean temperature between 20 May and 9 July when R. ribicola was caught was 20.0 °C (5.1–36.7 °C), close to that of 2024, with a mean relative humidity of 58.6%.
Mean daily seasonal air and relative humidity ± standard error of the mean (from two data loggers) and first and last trap catches of Euphranta canadensis and Rhagoletis ribicola in golden currant (Ribes aureum) bushes at: A, Union Gap and B, Cowiche sites in Washington state, United States of America, in 2024.
Do the two fly species differ in eclosion timings in the laboratory? (2024)
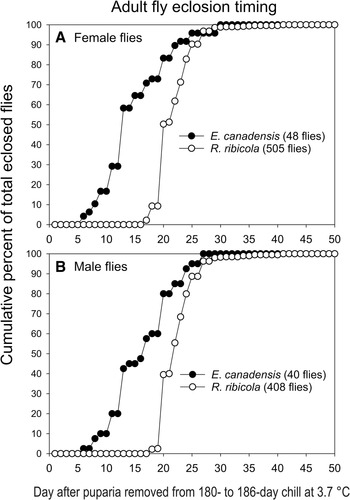
Under laboratory conditions, E. canadensis eclosed earlier than R. ribicola (Fig. 8A, B), which is consistent with the earlier catches of E. canadensis in the field. In addition, females of both species (Fig. 8A) eclosed before males of their own species did (Fig. 8B), matching the sex-related difference observed in the field trapping studies. For E. canadensis females, the mean day of eclosion (15.6 ± 1.1 days) was significantly earlier than that of R. ribicola females (22.5 ± 0.3 days; t = –8.93; P < 0.0001). Similarly, for E. canadensis males, the mean eclosion day (17.0 ± 1.0 days) was significantly earlier than that of R. ribicola males (23.3 ± 0.2 days; mean rank sums of 24.0 versus 57.7; z = –5.16; P < 0.001).
Cumulative eclosion curves of adult (A) female and (B) male Euphranta canadensis and Rhagoletis ribicola reared from golden currant (Ribes aureum) fruit collected at Union Gap, Washington state, United States of America, at 23.8 °C in the laboratory after puparia were chilled for 180–186 days at 3.7 °C.
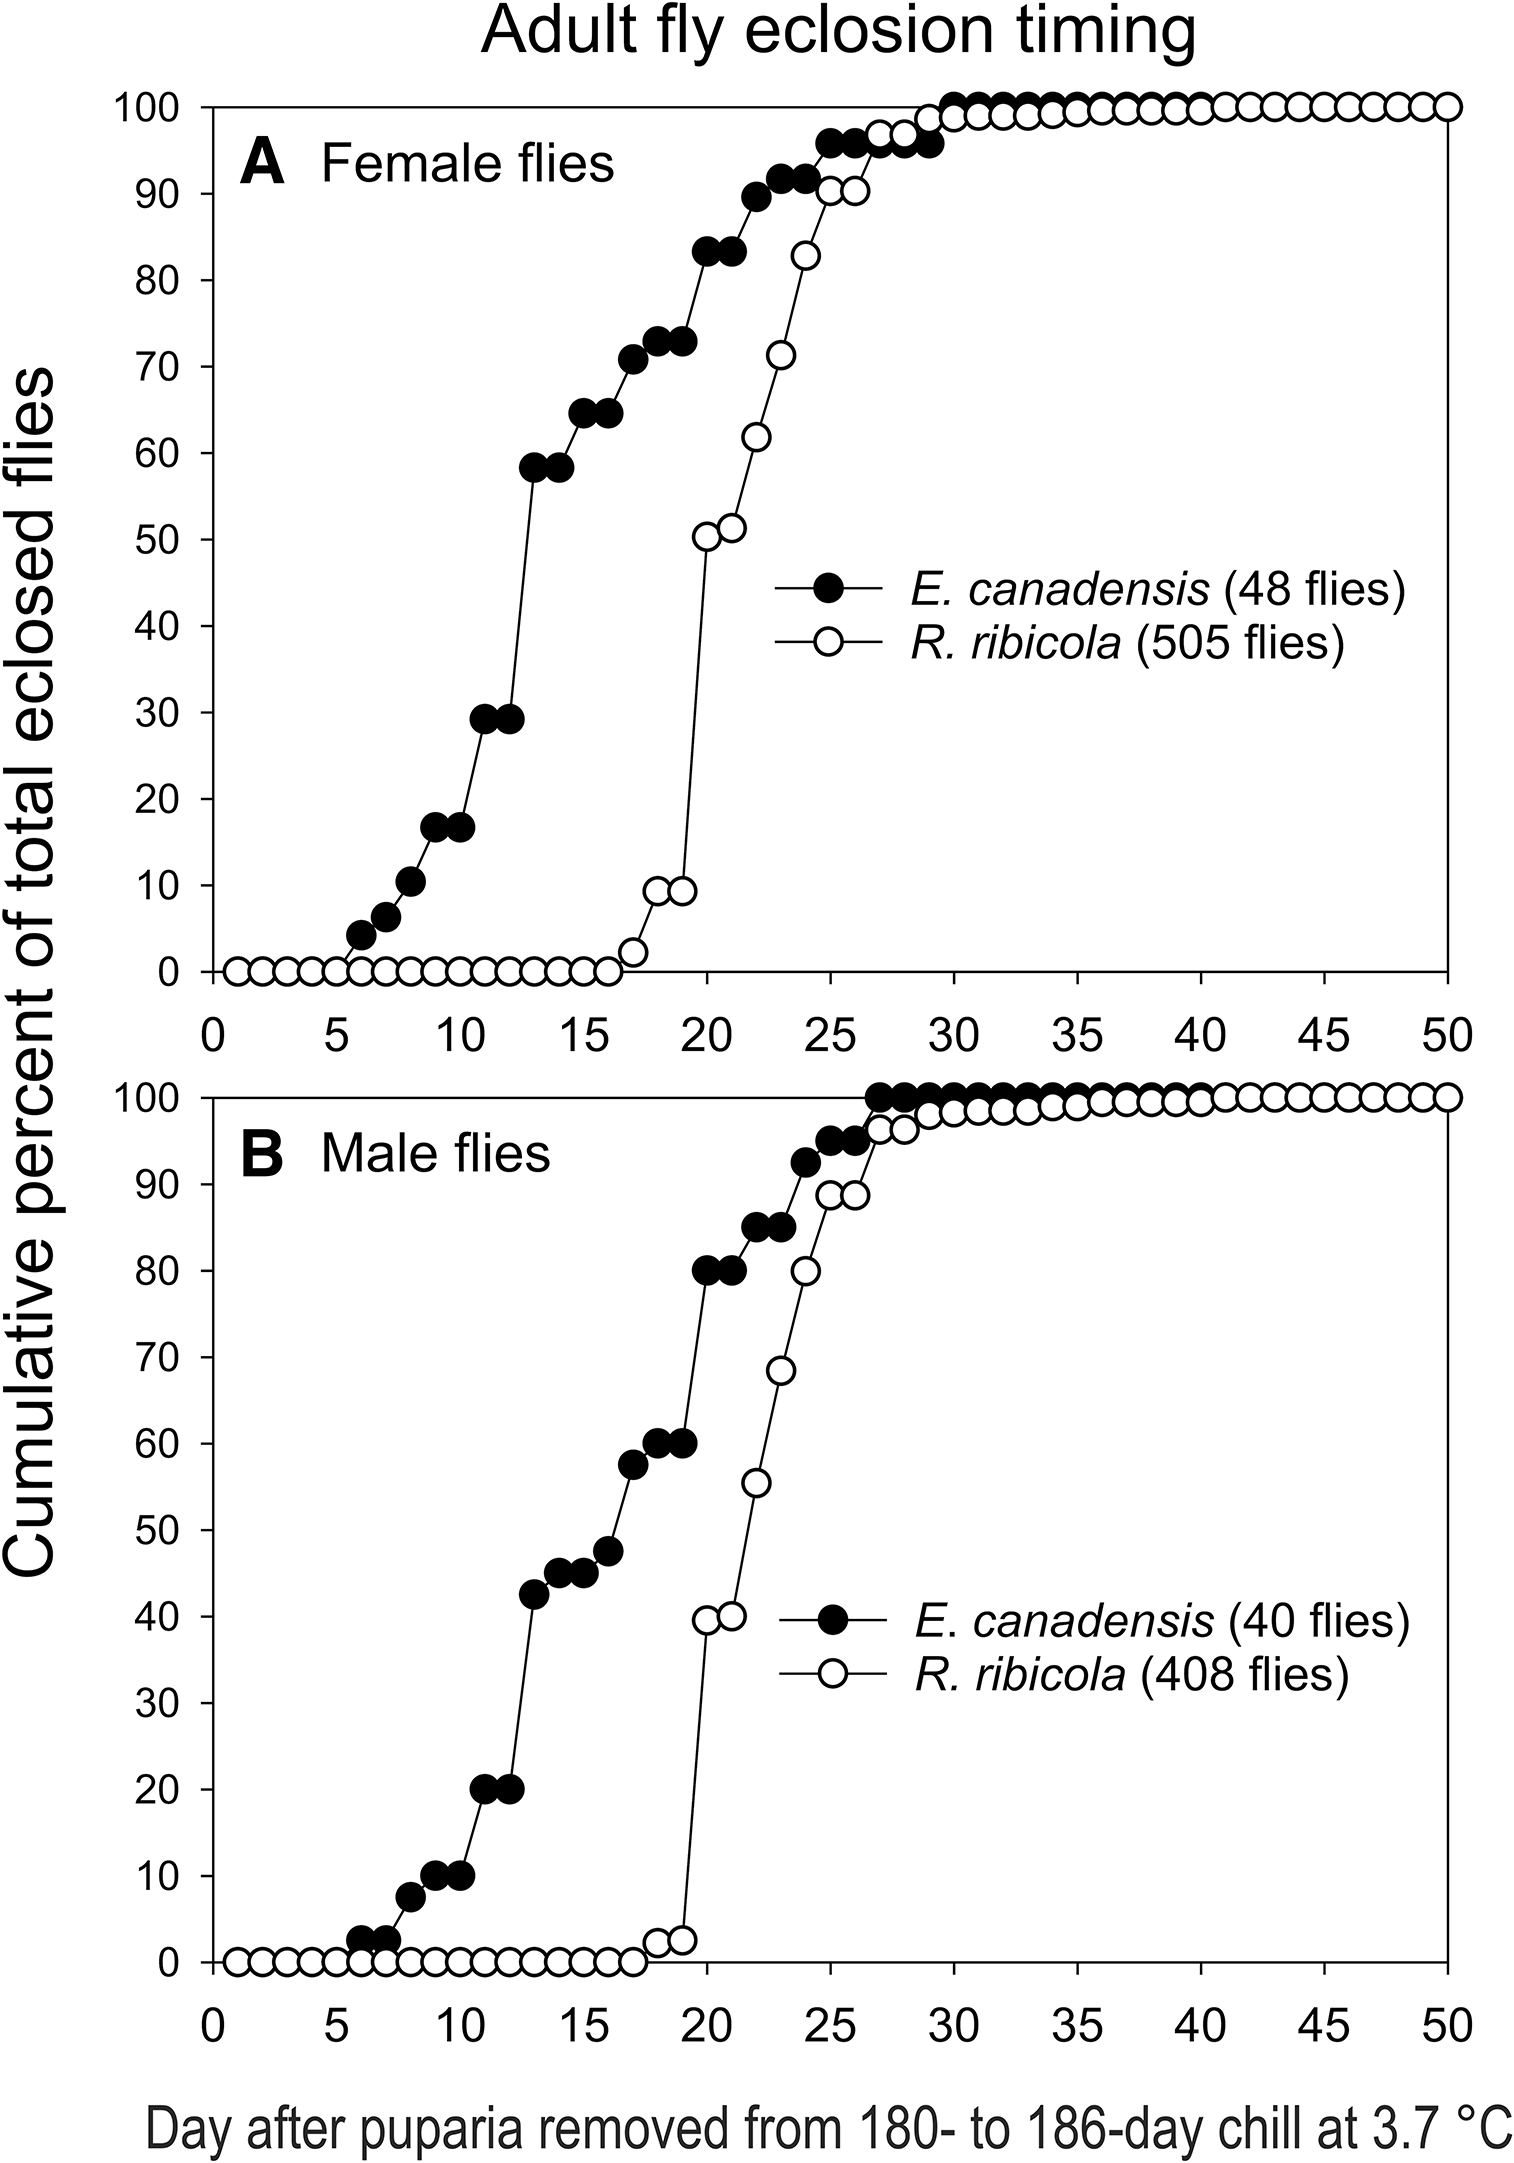
Figure 8. Long description
Two line graphs depict the cumulative percent of total eclosed flies for female and male flies of two species. Panel A shows the eclosion timing for female flies, with the y-axis representing the cumulative percent of total eclosed flies and the x-axis representing the day after puparia removed from 180- to 186-day chill at 3.7 degrees Celsius. The graph includes data for E. canadensis (48 flies) and R. ribicola (505 flies), with E. canadensis eclosing earlier than R. ribicola. Panel B shows the eclosion timing for male flies, with the same axes and units as Panel A. The graph includes data for E. canadensis (40 flies) and R. ribicola (408 flies), with E. canadensis also eclosing earlier than R. ribicola in this panel.
Do distributions of fly eggs and larvae depend on fruit maturity stages, and related to this, are eggs laid singly? (2024)
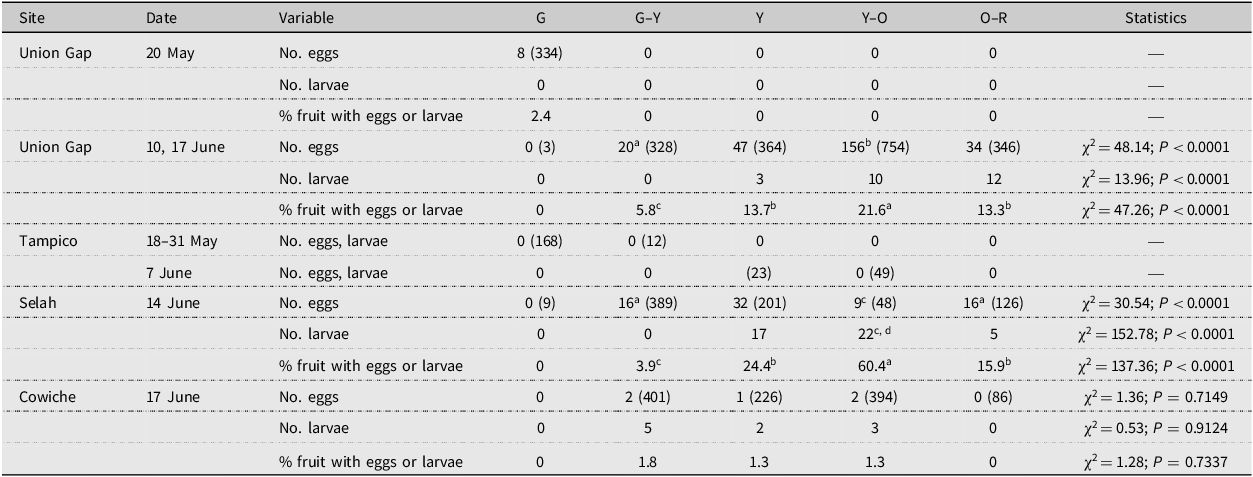
Table 3 shows that yellow–orange fruit in June at the Union Gap and Selah sites (the two locations with sufficient data) was the class of fruit most heavily infested with eggs and larvae (21.6% and 60.4% of the total detected, respectively), followed by yellow and orange–red fruit, and then green–yellow fruit. Considering the yellow–orange fruit stage from Union Gap, Cowiche, Selah, and Tampico combined (n = 1239 fruit total from 31 May and June collection dates), the percentage of fruit with eggs and larvae was 15.9%. Out of 422 total eggs and larvae (not distinguished to fly species) detected in 4009 currants assayed, 96.7% occurred singly (97.2% of 290 eggs at Union Gap, 100% of 15 eggs at Cowiche, and 94.9% of 117 eggs at Selah; no eggs in Tampico fruit samples).
Numbers of eggs and larvae of Euphranta canadensis and Rhagoletis ribicola infesting different maturation stages of golden currant (Ribes aureum) fruit at four sites in Washington state, United States of America, in May and June 2024. Fruit colour stages: G = green; G–Y = green–yellow; Y = yellow; Y–O = yellow–orange; O–R = orange–red. Numbers in parentheses are the number of fruit in a given maturation stage collected at random and analysed for infestation on the indicated date at a site. For No. eggs and No. larvae, R × C contingency tests were conducted to test dependence of eggs or larvae on fruit maturation (colour) stage. For percentages of fruit stages with eggs or larvae, tests of multiple proportions followed by Tukey-type multiple comparisons were conducted. Green fruit were not included in either of these two analyses. Percentages of fruit infested with eggs or larvae on given collecting dates at sites followed by the same letter are not significantly different (P > 0.05). aTwo eggs in one fruit. bTwo eggs in each of three fruit. cOne egg in one fruit with one larva. dTwo larvae in one fruit; — = no or too few puparia for analysis.
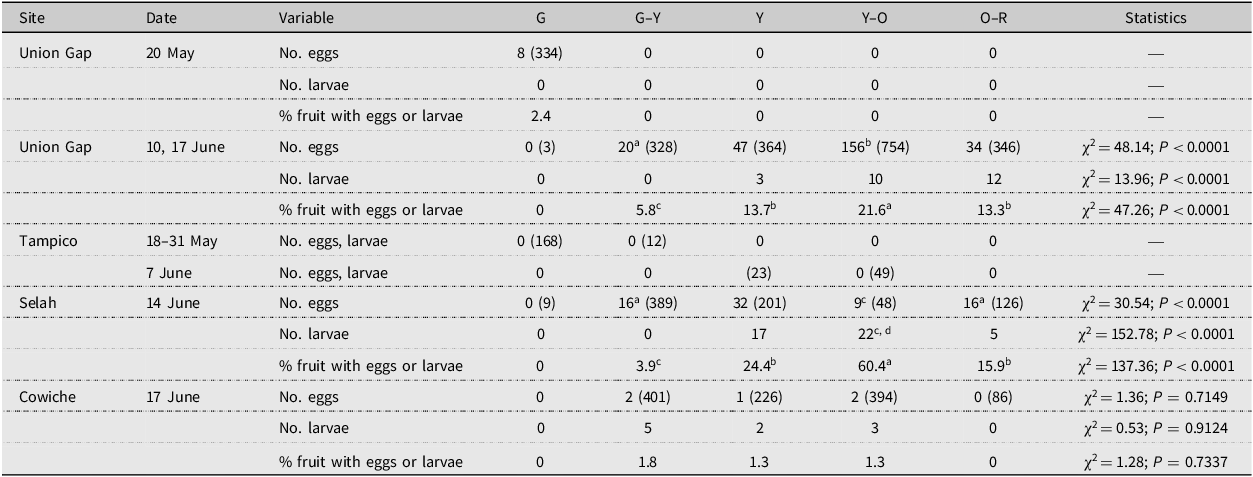
Table 3. Long description
A table comparing the number of eggs and larvae infesting different maturation stages of golden currant fruit at four sites in Washington state. The table has 12 rows and 8 columns. Column headers are Site, Date, Variable, G, G-Y, Y, Y-O, O-R, and Statistics. Row labels include Union G, Union G, Tampico, Selah, and Cowiche. The table presents data on the number of eggs, larvae, and percentage of fruit with eggs or larvae at different maturation stages. Notable trends include higher infestation rates in yellow-orange fruit stages at Union Gap and Selah sites in June.
Do the two fly species tend to infest fruit of different stages, and what are the larval abundances? (2023, 2024, and 2025)
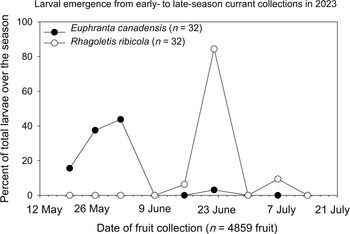
Only larvae of E. canadensis and R. ribicola emerged from golden currant fruit in all three years of the study. Significant differences were detected in the time when E. canadensis and R. ribicola larvae infested golden currant fruit, with the pattern remaining consistent across years. We did not classify fruit into different stages in 2023 at Union Gap, but we can infer that earlier-season fruit are less mature than later-season fruit. In 2023 at Union Gap (Fig. 9), 31 of the 32 E. canadensis larvae (96.9%) emerged in May from less mature fruit stages than from fruit in June, when 29 of 32 R. ribicola larvae (90.6%) emerged. Correspondingly, the larval infestation week of golden currant fruit by E. canadensis larvae was significantly earlier than that by R. ribicola (2.4 ± 0.2 versus 6.1 ± 0.1 weeks, respectively; mean rank sums of 17.0 and 48.0, respectively; z = –6.67; P < 0.001).
Seasonal distributions of Euphranta canadensis and Rhagoletis ribicola larvae emerging from golden currant (Ribes aureum) fruit collected at Union Gap in Washington state, United States of America, in 2023.
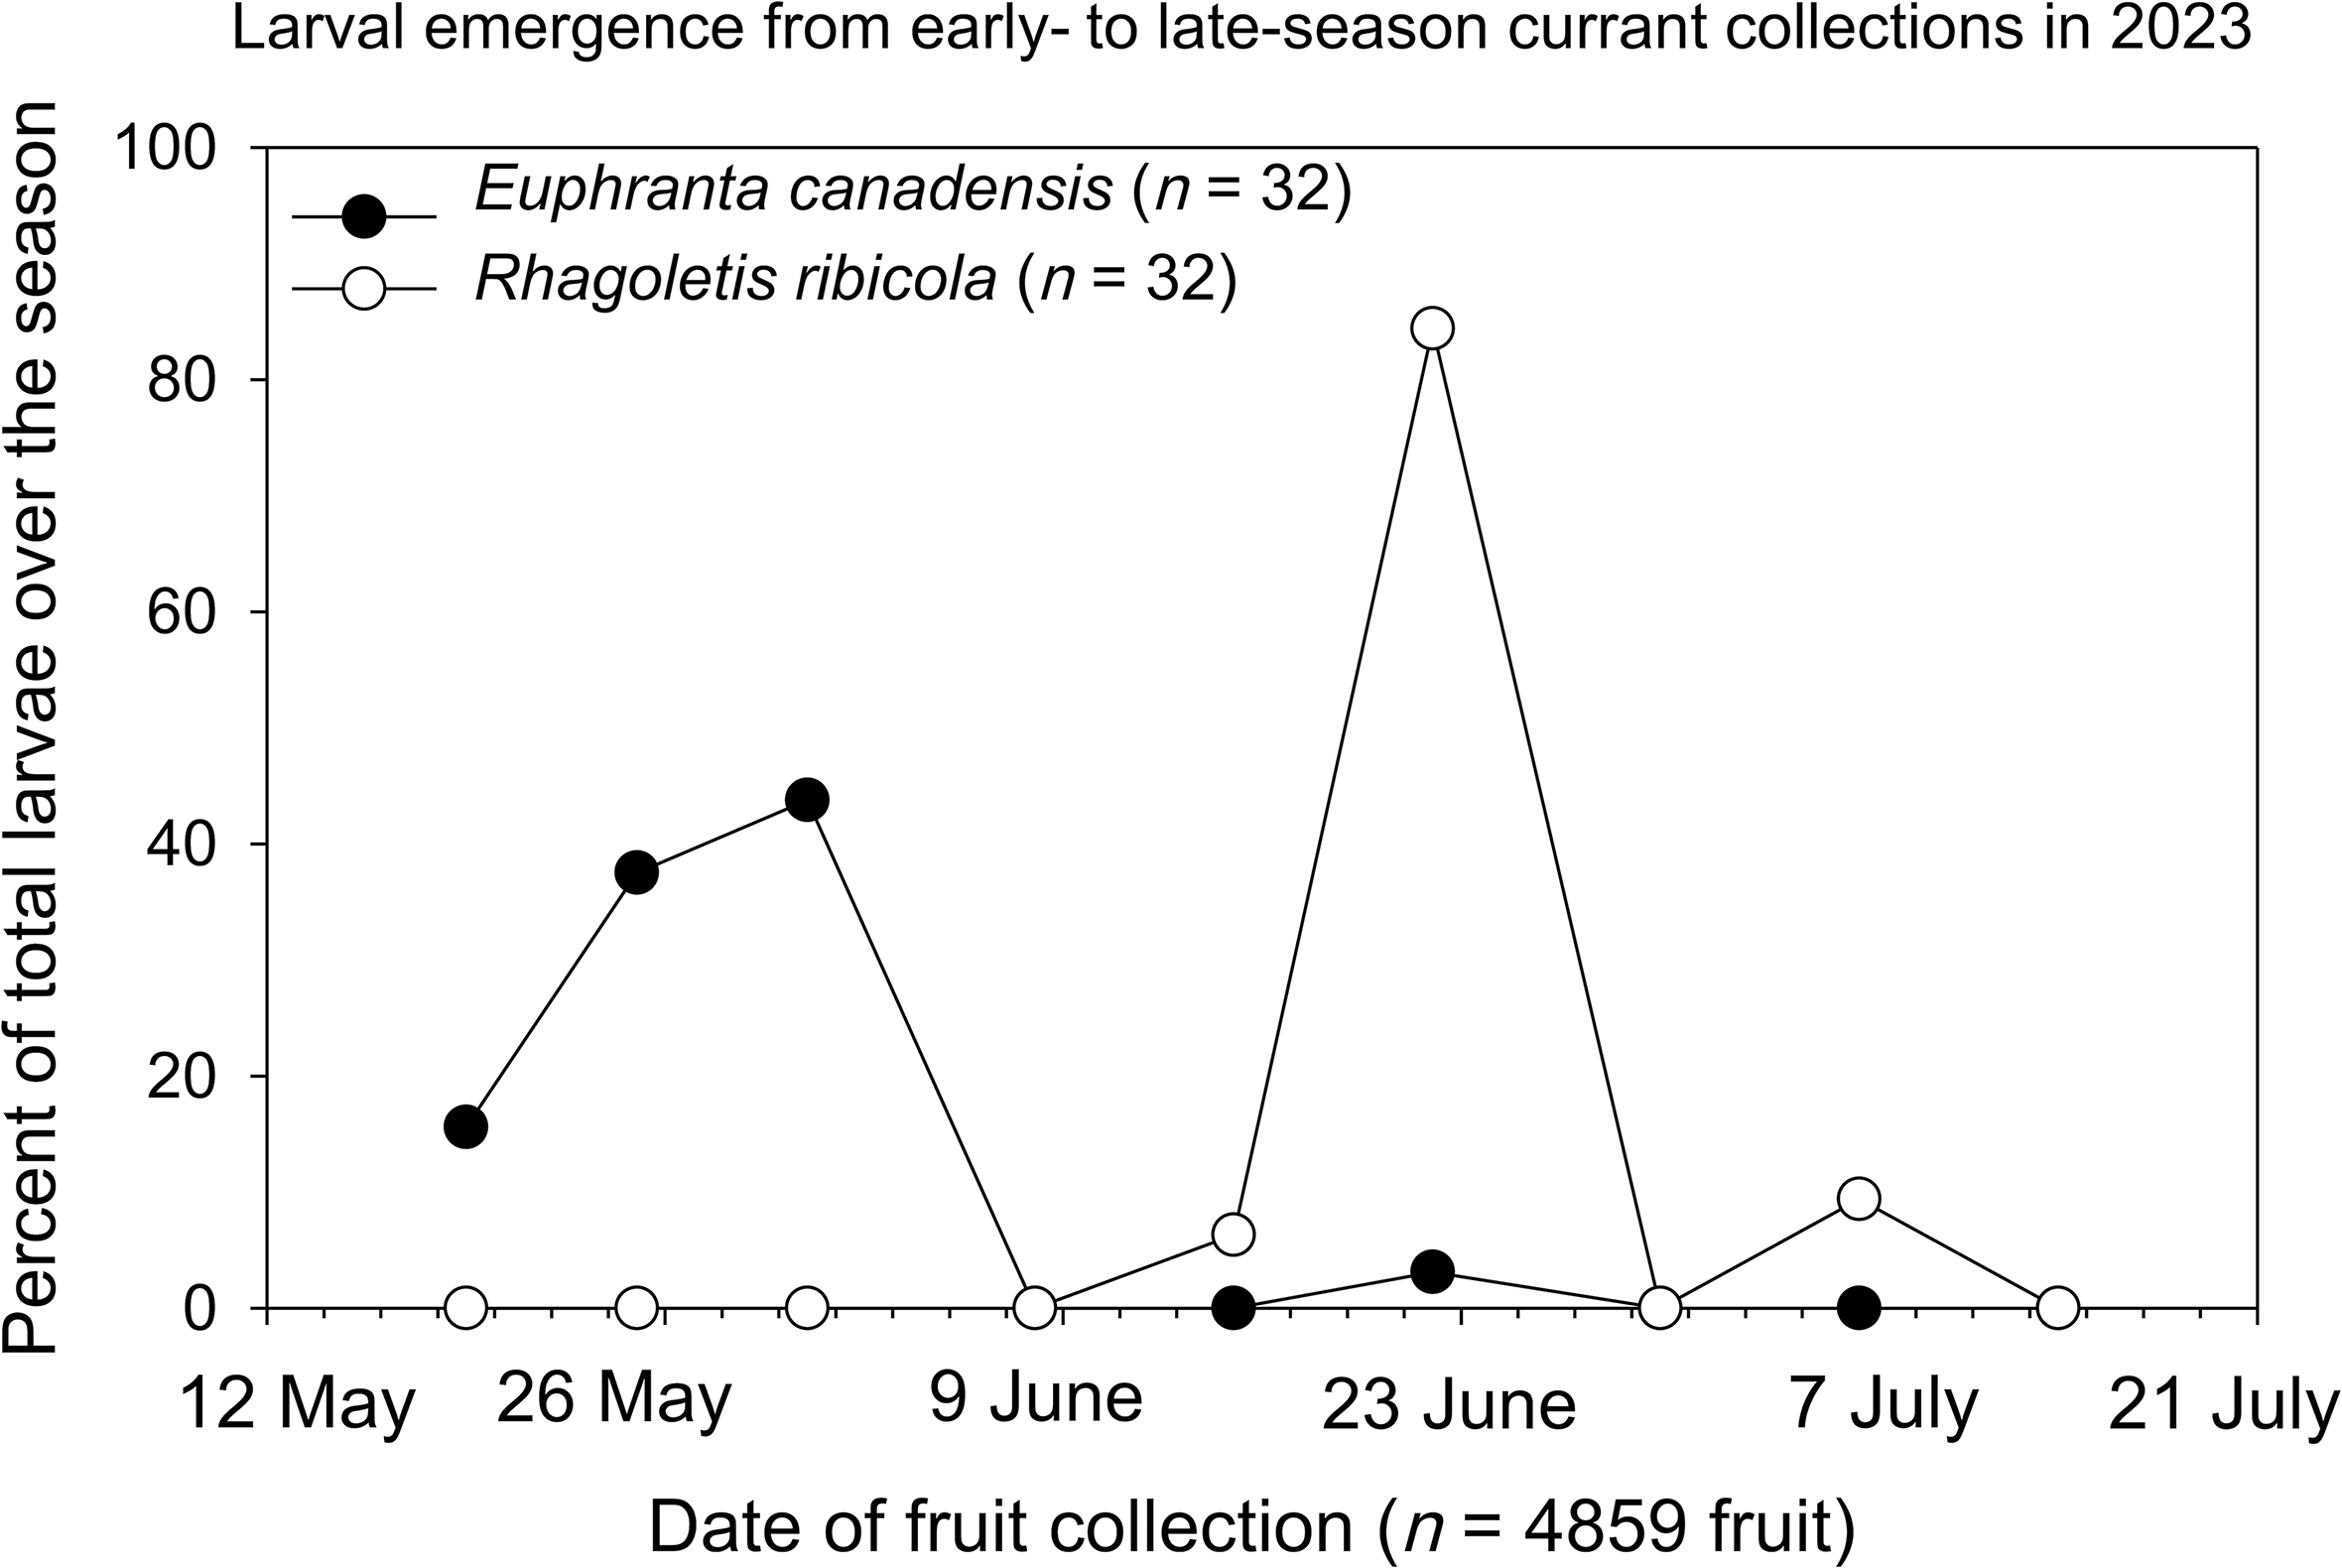
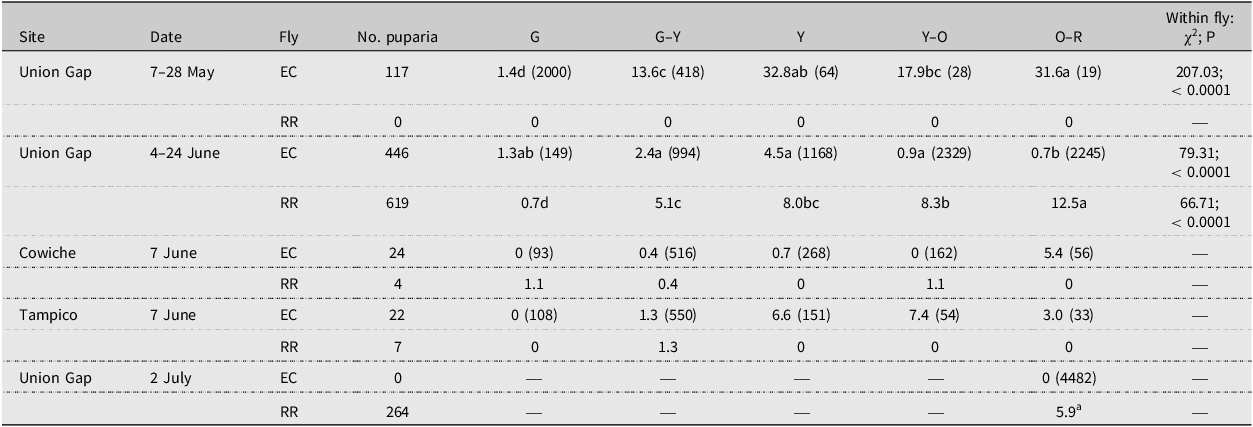
Table 4 shows percentages of golden currant fruit in different maturation stages producing fly larvae in May, June, and July 2024. Only E. canadensis larvae emerged from fruit collected in May at Union Gap, mostly from the green–yellow stage of fruit. However, both E. canadensis and R. ribicola emerged from fruit collected in June. Most E. canadensis emerged from yellow fruit (45.2% of all stages present at the time), whereas most R. ribicola emerged from orange–red fruit (also 45.2% of all stages present). The intermediate yellow–orange stage (28.7% of all fruit in June) was most likely to have larvae of both species. Only R. ribicola larvae emerged from fruit collected in July, when all fruit were orange–red or dried (Table 4).
Percentages of golden currant (Ribes aureum) fruit in different maturation stages producing Euphranta canadensis (EC) and Rhagoletis ribicola (RR) puparia at three sites in Washington state, United States of America, from May to July 2024. Numbers in parentheses are numbers of fruit in the specific maturation stage collected at random and analysed for infestation on the indicated date at a site. Fruit colour stages: G = green; G–Y = green–yellow; Y = yellow; Y–O = yellow–orange; O–R = orange–red. Percentages followed by the same letter are not significantly different (Tukey-type multiple comparisons, P > 0.05). aDried fruit, only in July; — = no or too few puparia for analysis.
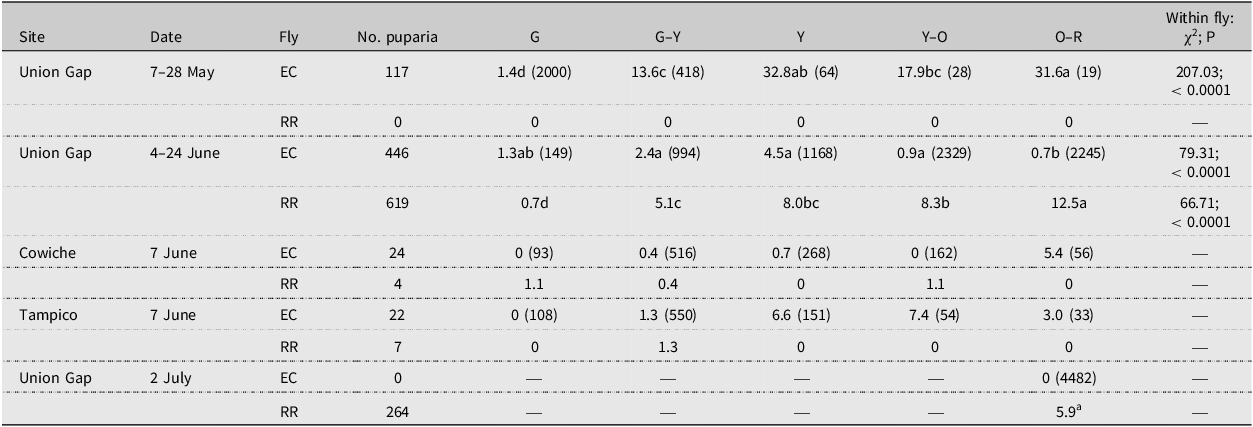
Table 4. Long description
The table presents data on the percentages of golden currant fruit in different maturation stages that produce fly larvae at various sites and dates. It includes columns for Site, Date, Fly, No. puparia, G, G-Y, Y, Y-O, O-R, and Within fly. The table has 11 rows and 11 columns. Row 1: Union G., 7-28 May, EC, 117, 1.4d (2000), 13.6c (418), 32.8ab (64), 17.9bc (28), 31.6a (19), 207.03; <0.0001. Row 2: Union G., 7-28 May, RR, 0, 0, 0, 0, 0, 0, —. Row 3: Union G., 4-24 June, EC, 446, 1.3ab (149), 2.4a (994), 4.5a (1168), 0.9a (2329), 0.7b (2,245), 79.31; <0.0001. Row 4: Union G., 4-24 June, RR, 619, 0.7d, 5.1c, 8.0bc, 8.3b, 12.5a, 66.71; <0.0001. Row 5: Cowiche, 7 June, EC, 24, 0 (93), 0.4 (516), 0.7 (268), 0 (162), 5.4 (56), —. Row 6: Cowiche, 7 June, RR, 4, 1.1, 0.4, 0, 1.1, 0, —. Row 7: Tampico, 7 June, EC, 22, 0 (108), 1.3 (550), 6.6 (151), 7.4 (54), 3.0 (33), —. Row 8: Tampico, 7 June, RR, 7, 0, 1.3, 0, 0, 0, —. Row 9: Union G., 2 July, EC, 0, —, —, —, —, —, —. Row 10: Union G., 2 July, RR, 264, —, —, —, —, 5.9a, —.
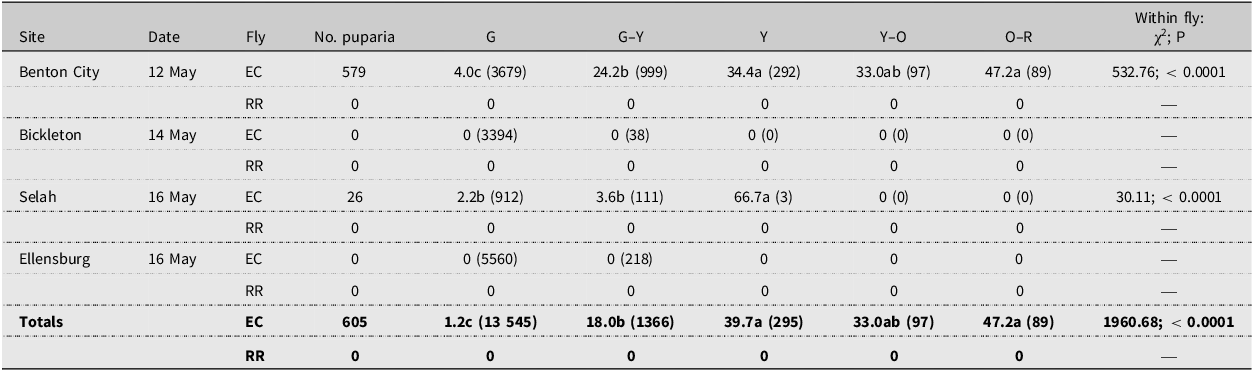
Table 5 shows that May 2025 fruit produced only E. canadensis, with more E. canadensis emerging from yellow to orange–red fruit (33.0 and 47.2%) than from green or green–yellow fruit. In addition to data in Table 5, a 16 May 2025 collection from Union Gap of 4795 currants that were not divided into colour classes produced 31 E. canadensis and no R. ribicola puparia. Similarly, 17 039 currants collected on the same day from Cowiche and not divided by colour produced 28 E. canadensis and no R. ribicola puparia.
Percentages of golden currant (Ribes aureum) fruit in different maturation stages producing Euphranta canadensis (EC) and Rhagoletis ribicola (RR) puparia at four sites in Washington state, United States of America, in May 2025. Numbers in parentheses are numbers of fruit in the specific maturation stage collected at random and analysed for infestation on the indicated date at a site. Fruit colour stages: G = green; G–Y = green–yellow; Y = yellow; Y–O = yellow–orange; O–R = orange–red. Percentages followed by the same letter are not significantly different (Tukey-type multiple comparisons; P > 0.05). — = no or too few puparia for analysis.
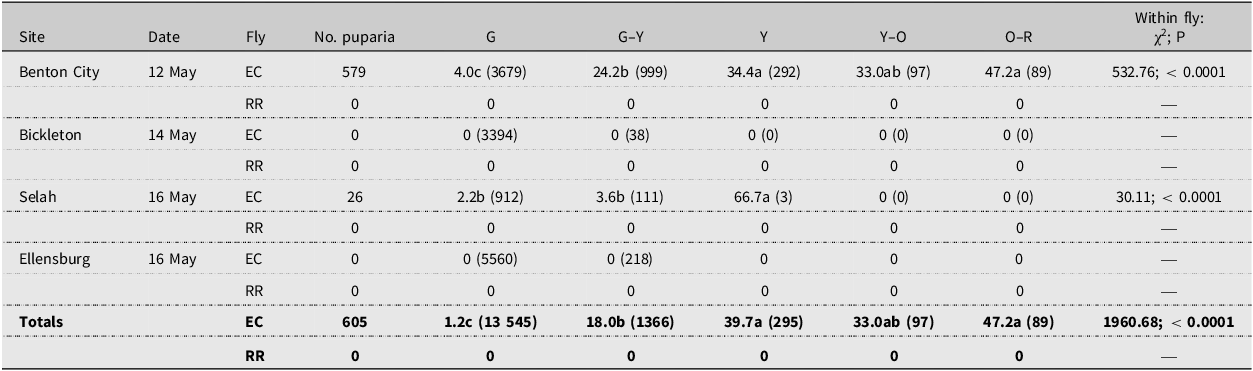
Table 5. Long description
A table comparing the percentages of golden currant fruit in different maturation stages producing Euphranta canadensis (EC) and Rhagoletis ribicola (RR) puparia at four sites in Washington state in May 2025. The table has 4 rows and 10 columns. Column headers are Site, Date, Fly, No. puparia, G, G-Y, Y, Y-O, O-R, and Within fly: χ2; P. Row labels include Benton C., Bickleton, Selah, Ellensburg, and Totals. Each row provides data for different sites and dates, showing the number of puparia and percentages of fruit in various maturation stages. Notable trends include higher percentages of EC puparia in yellow to orange-red fruit compared to green or green-yellow fruit. Some cells indicate no or too few puparia for analysis.
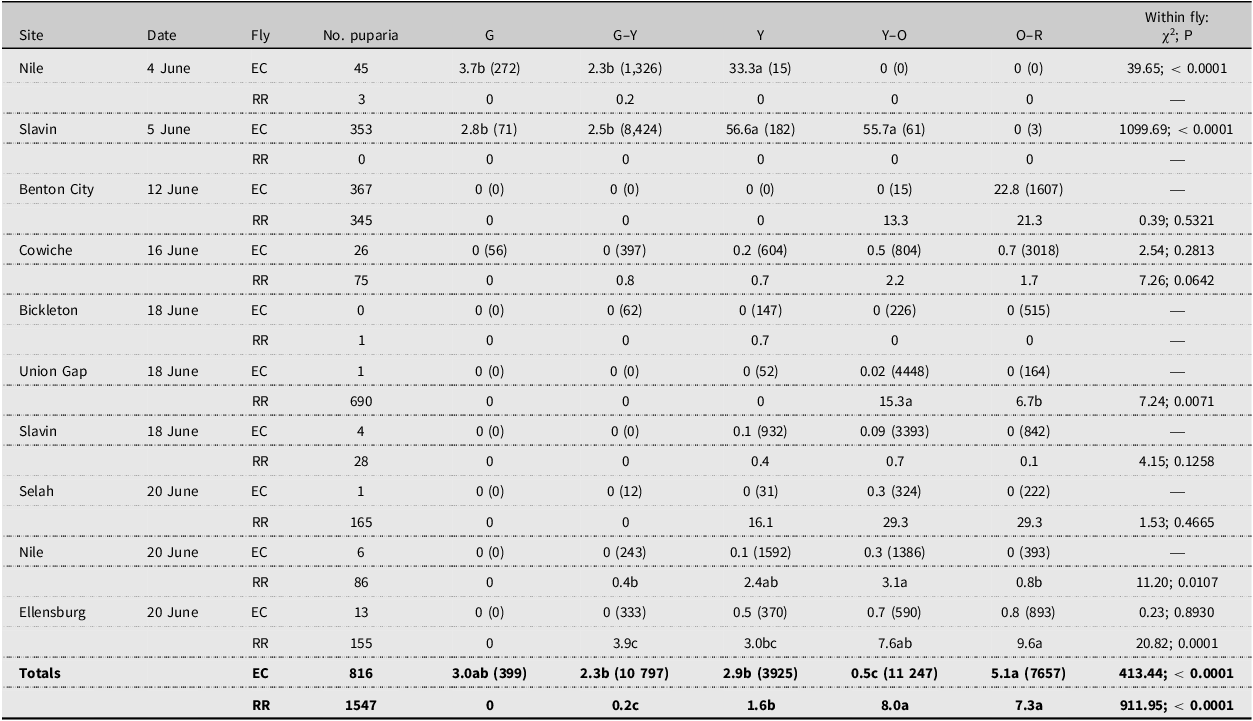
Table 6 shows that June 2025 fruit produced both E. canadensis and R. ribicola. Variability occurred in the percentages of both fly species infesting fruit of different colour stages across the 10 site–date combinations as expected, with generally low infestations (0–55.7% per fruit colour stage for E. canadensis and 0–29% for R. ribicola) accounting for some nonsignificant differences within site–date combinations. However, overall percentages (combining all site–dates; in the “Totals” row, bottom of Table 6) that produced E. canadensis did not differ in the most immature versus most mature fruit. Specifically, percentage infestations of fruit by E. canadensis were green = green–yellow = yellow, and green = orange–red. In contrast, higher overall infestation percentages by R. ribicola (totals, last row in Table 6) occurred in more mature fruit than in less mature fruit. Specifically, percentage infestations by R. ribicola of fruit were orange–red = yellow–orange > yellow > green–yellow, with no infestation in the green, the most immature stage. A 9 June 2025 collection of 5523 currants from Fort Simcoe that were not separated by colour produced 36 E. canadensis and 88 R. ribicola puparia, again showing co-occurrence of the two species in June fruit collections.
Percentages of golden currant (Ribes aureum) fruit in different maturation stages producing Euphranta canadensis (EC) and Rhagoletis ribicola (RR) puparia at eight sites in Washington state, United States of America, in June 2025. Numbers in parentheses are numbers of fruit in the specific maturation stage collected at random and analysed for infestation on the indicated date at a site. Fruit colour stages: G = green; G–Y = green–yellow; Y = yellow; Y–O = yellow–orange; O–R = orange–red. Percentages followed by the same letter are not significantly different (Tukey-type multiple comparisons; P > 0.05). — = no or too few puparia for analysis.
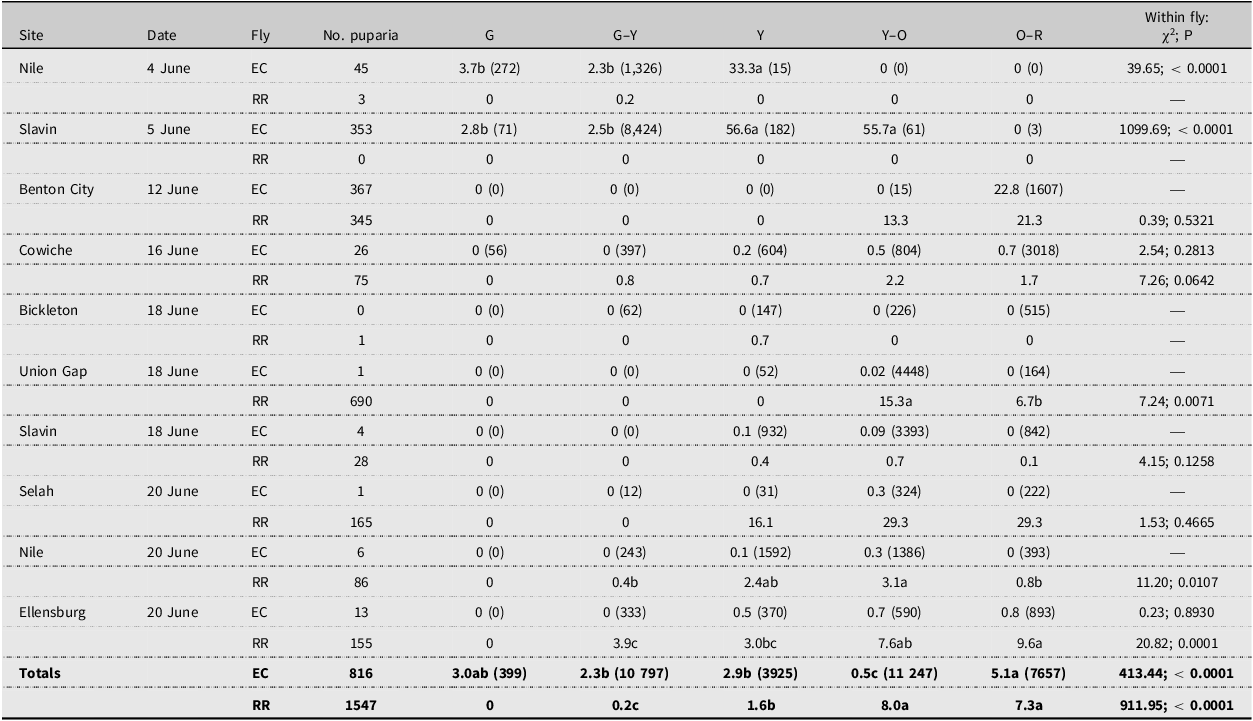
Table 6. Long description
The table presents data on the percentages of golden currant fruit in different maturation stages producing Euphranta canadensis (EC) and Rhagoletis ribicola (RR) puparia at eight sites in Washington state in June 2025. The table has 10 rows and 10 columns. Column headers are Site, Date, Fly, No. puparia, G, G-Y, Y, Y-O, O-R, and Within fly: χ2; P. Row labels include site names and dates. The table includes values for the number of puparia and percentages of infestation for different fruit color stages. Notable trends include generally low infestations for both fly species, with some significant differences within site-date combinations. For EC, infestations were noted in green, green-yellow, and green-orange-red stages. For RR, higher infestations occurred in more mature fruit stages, with no infestation in the green stage. The totals row combines all site-dates and shows overall infestation percentages.
In July 2025 (no table shown), only orange–red fruit were present. Only R. ribicola emerged from 7.1% of 11 363 orange–red fruit across four sites. The sites and fruit numbers are as follows: Union Gap, 9 July: 3398 fruit and 68 puparia; Nile, 9 July: 2437 fruit and 704 puparia; Slavin, 10 July: 4394 fruit and 17 puparia; Ellensburg, 19 July: 1134 fruit and 16 puparia.
From the infestation data, we calculated the percentages of fruit that did not produce larvae, assuming one larva per fruit. In 2023, no larva emerged from 98.7% of 4859 fruit that produced 64 larvae collected from Union Gap. In 2024, no larva emerged from 94.4% of a total of 15 887 fruit that produced 890 larvae; in addition, none emerged from 91.4% of 2573 yellow–orange fruit (Table 4; May, June, and July: the 15 887 total fruit is the sum of all numbers inside the parentheses in the table; total larvae can be calculated based on summing up all percentages). In 2025, no larvae emerged from 95.5% of 88 137 total fruit, which produced 3966 larvae, and no larvae emerged from 91.3% of 11 344 yellow–orange fruit sampled from May to June from eight sites (total 2025 fruit are from Table 5, May; Table 6, June; also from May and June fruit that were not colour classified, and July (no table) fruit; all numbers stated in the three previous paragraphs).
In the May 2024 and 2025 fruit collections, the mean larval abundances across all fruit stages and sites were 0.0274 ± 0.0156 larvae/fruit for E. canadensis and no (0) larvae/fruit for R. ribicola (n = 39 755 total fruit). In June collections, mean larval abundances were 0.0306 ± 0.0159 larvae/fruit for E. canadensis and 0.0625 ± 0.0240 larvae/fruit for R. ribicola (n = 48 424 total fruit; z = –0.8475, P = 0.3953). In July collections, no E. canadensis was present, but the mean larval abundance of R. ribicola was 0.0771 ± 0.0537 (15 845 total fruit). For the entire season combined, the mean larval abundances were 0.0238 ± 0.0096 for E. canadensis and 0.0485 ± 0.0169 for R. ribicola (z = –0.7714, P = 0.4413).
What are the niche overlaps of larvae of the two flies? (2024, 2025)
Niche overlap was based on percentages of E. canadensis and R. ribicola larvae infesting golden currant fruit of the same colour (maturation) stage within sites at the same time of the season. No niche overlap was detected in May 2024 (Table 4) and May 2025 (Table 5; only E. canadensis emerged from May samples in both years) or in July 2024 (Table 4) and July 2025 (no table; only R. ribicola emerged from July samples in both years).
For June fruit collections (June 2024, Table 4; June 2025, Table 6) from which both E. canadensis and R. ribicola larvae emerged, sufficient data were obtained for only five of 13 date–site combinations to allow niche-overlap estimates. These sites were Union Gap and Tampico in 2024 and Benton City, Cowiche, and Ellensburg in 2025. Tables 4 and 6 show these sites and the infestations in them across the fruit colour stages used to determine proportions for the niche overlap formula provided in Materials and methods. In June 2024, niche overlap between species was 0.649 at Union Gap and 0.543 at Tampico. In June 2025, it was 0.996 at Benton City, 0.986 at Cowiche, and 0.982 at Ellensburg. Based on these estimates, a relatively high degree of niche overlap was limited to only one portion of the season. When considering the entire season comprising May, June, and July for all sites, overall niche overlap was reduced to 0.425 in 2024 and to 0.582 in 2025.
Do emergence timings of larvae of the two fly species from fruit following fruit collection differ? (2024, 2025)
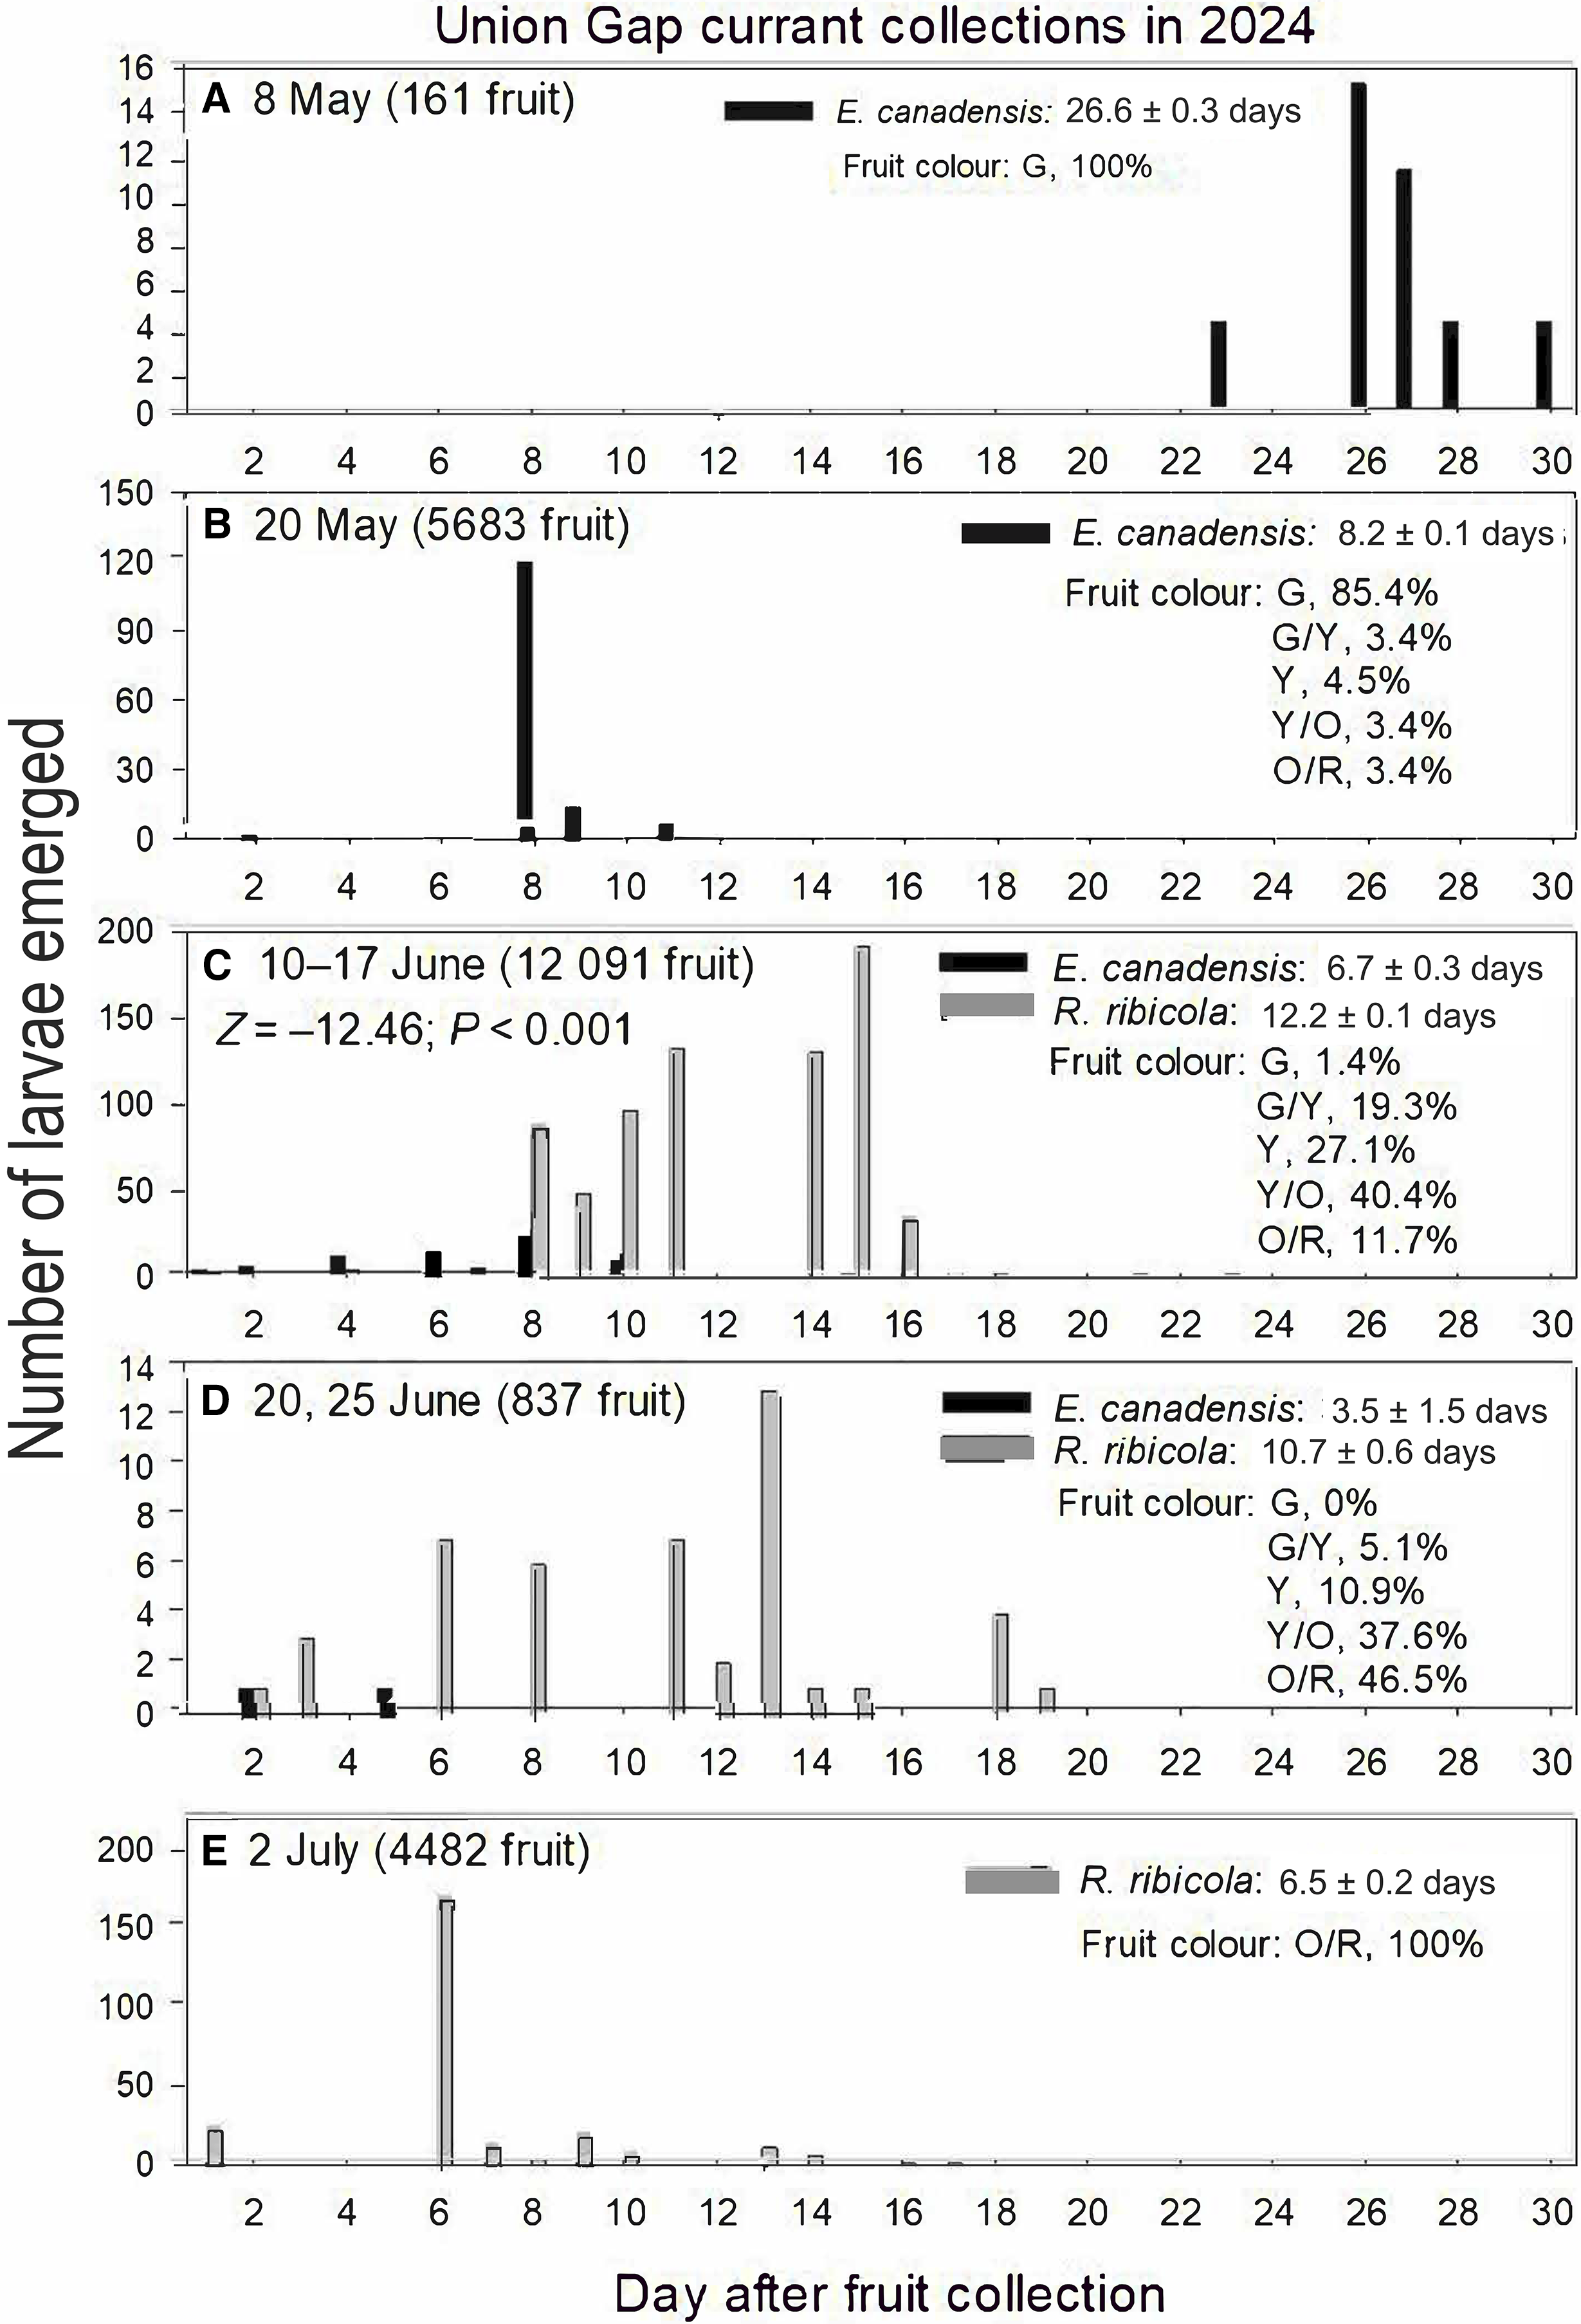
Figures 10 and 11 show the emergence timings of larvae of E. canadensis and R. ribicola following fruit collections. Green fruit collected in May 2024 produced only E. canadensis, with less ripe fruit from 8 May (Union Gap, Fig. 10A) producing larvae on average more than 3 weeks after collection and riper fruit from 20 and 28 May producing larvae 2–13 days after collection (Union Gap, Fig. 10B; Tieton, Fig. 11A). Fruit collected in June 2024 produced both species, with the emergence of E. canadensis occurring statistically earlier than that of R. ribicola (Union Gap, Fig. 10C, D; Tieton, Fig. 11B; Cowiche, Fig. 11C). For fruit collections on the four June sample periods that were infested by both species, E. canadensis larvae emerged 5.5–10.7 days (mean, 8.3 days) earlier on average than R. ribicola did (range and mean from: Union Gap, 10–17 June: 12.2 days − 6.7 days = 5.5 days, Fig. 10C; Union Gap, 20, 25 June: 10.7 days − 3.5 days = 7.2 days, Fig. 10D; Tieton, 19 June: 14.9 days − 4.2 days = 10.7 days, Fig. 11B; Cowiche, 17 June: 16.0 days − 6.4 days = 9.6 days, Fig. 11C). Only R. ribicola larvae emerged from July 2024 fruit (Union Gap, Fig. 10E; Selah, Fig. 11D), within 14 days following collection, earlier than from less mature fruit. Patterns seen in 2024 were also detected in 2025. From 2988 yellow–orange fruit collected at Cowiche on 16 June (not shown in a figure), 21 E. canadensis emerged from 17 to 25 June, and 50 R. ribicola emerged from 24 June to 4 July. Thus, only a 1-day overlap was observed in interspecific larval emergence in 2025.
Larval emergence times for Euphranta canadensis and Rhagoletis ribicola in the laboratory from golden currant (Ribes aureum) fruit following their collection on different dates at Union Gap in Washington state, United States of America, in 2024: A, 8 May; B, 20 May; C, 10–17 June; D, 20, 25 June; and E, 2 July. Mean ± standard error of the mean for larval emergence of the two flies are given along with distributions of fruit colours for each collection date. Z statistic is from Mann–Whitney U test for mean rank sums.
Larval emergence times for Euphranta canadensis and Rhagoletis ribicola in the laboratory from golden currant (Ribes aureum) fruit following their collection on different dates at three sites in Washington state, United States of America, in 2024: A, Tieton, collected 28 May; B, Tieton, collected 19 June; C, Cowiche, collected 17 June; and D, Selah, collected 3 July. Mean ± standard error of the mean for larval emergence of the two flies are given for each collection date. Fruit colours were not recorded for these collections. Z statistic is from Mann–Whitney U test for mean rank sums.
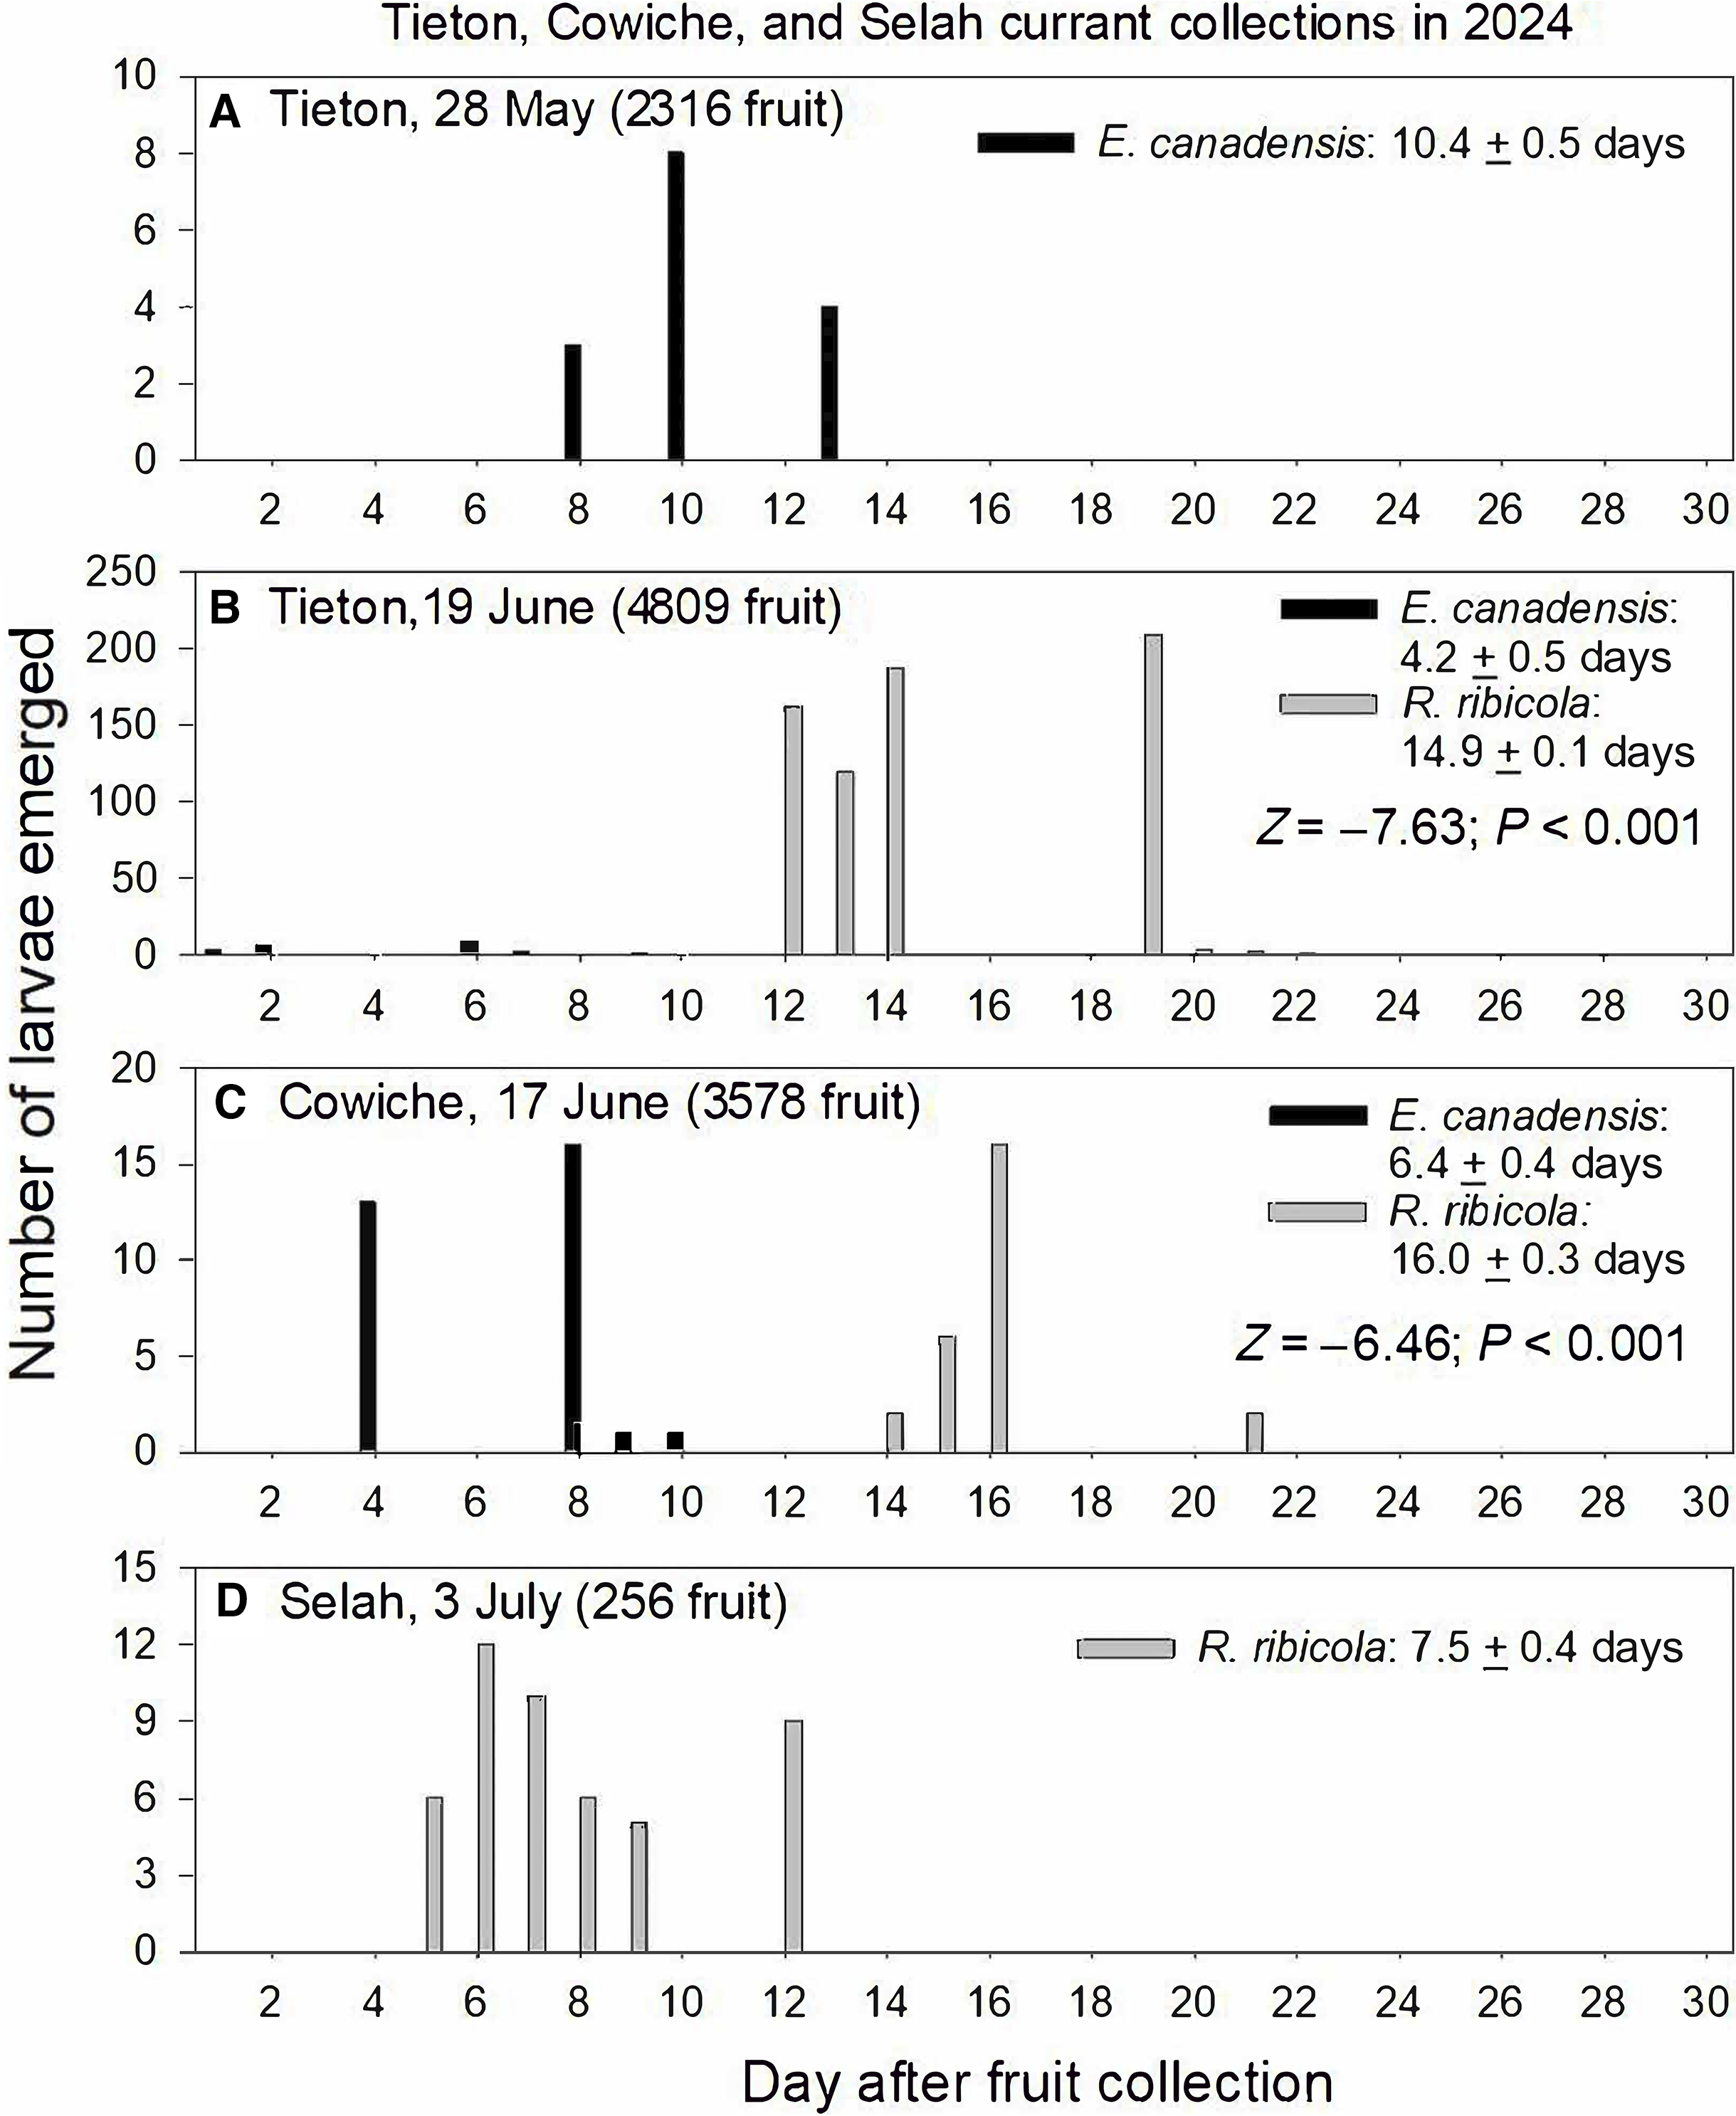
Figure 11. Long description
Panel A: A bar graph shows the number of larvae emerged from fruit collected in Tieton on 28 May. The x-axis represents the day after fruit collection, ranging from 0 to 30 days. The y-axis represents the number of larvae emerged, ranging from 0 to 10. The graph shows peaks in larval emergence on days 8, 10, and 14. Panel B: A bar graph shows the number of larvae emerged from fruit collected in Tieton on 19 June. The x-axis represents the day after fruit collection, ranging from 0 to 30 days. The y-axis represents the number of larvae emerged, ranging from 0 to 250. The graph shows peaks in larval emergence on days 12, 14, and 20. Panel C: A bar graph shows the number of larvae emerged from fruit collected in Cowiche on 17 June. The x-axis represents the day after fruit collection, ranging from 0 to 30 days. The y-axis represents the number of larvae emerged, ranging from 0 to 20. The graph shows peaks in larval emergence on days 4, 6, 8, and 16. Panel D: A bar graph shows the number of larvae emerged from fruit collected in Selah on 3 July. The x-axis represents the day after fruit collection, ranging from 0 to 30 days. The y-axis represents the number of larvae emerged, ranging from 0 to 15. The graph shows peaks in larval emergence on days 4, 6, 8, 10, and 14.
Discussion
Temporal partitioning
In the E. canadensis–R. ribicola–golden currant system in central Washington state, we found evidence for temporal resource partitioning of shared fruit resources, an axis of niche differentiation facilitating species coexistence (Chesson Reference Chesson2000). The differences in phenology of the two fly species appear to largely result from the earlier adult eclosion time of E. canadensis. Previous studies have shown that eclosion time is genetically controlled in Rhagoletis (Ragland et al. Reference Ragland, Doellman, Meyers, Hood, Egan and Powell2017; Doellman et al. Reference Doellman, Egan, Ragland, Meyers, Hood and Powell2018; Dowle et al. Reference Dowle, Powell, Doellman, Meyers, Calvert and Walden2020; Meyers et al. Reference Meyers, Doellman, Ragland, Hood, Egan and Powell2020; Calvert et al. Reference Calvert, Doellman, Feder, Hood, Meyers and Egan2021). Whether the same is true in Euphranta remains to be determined. Regardless, E. canadensis’ earlier eclosion time likely results in the fly being reproductively active earlier, females ovipositing sooner in the season into more green fruit, and larvae feeding and emerging earlier in the year from golden currant than is observed for R. ribicola, reducing interspecific competition. At least in the laboratory, larval infestation of the same resource at the same time by two tephritid fly species can reduce measures of fly fitness (Liendo et al. Reference Liendo, Parreño, Cladera, Vera and Segura2018).
Presumably fruit and temperature factors associated with April to May or June in the past selected for when E. canadensis and R. ribicola adults are active. Specifically, less mature fruit, as indicated by smaller size, greater firmness, and less or no detectable sugar content, are associated with adult E. canadensis presence. Conversely, more mature fruit, greater fruit size, and less firm fruit with higher sugar levels are associated with R. ribicola presence. There also appears to be a cooler temperature niche for E. canadensis and a warmer temperate niche for R. ribicola that are associated with the maturation of fruit stages and leading to oviposition by flies. One can hypothesise that fruit and temperature factors play a role in coexistence if E. canadensis fares poorly when it ecloses in late season, and vice versa for R. ribicola.
Analysis of populations of the more widespread E. canadensis in other regions and other currant–gooseberry hosts would shed light on the source of selection for the fly species’ earlier phenology compared to that of R. ribicola. If E. canadensis ecloses earlier than R. ribicola does only where the two species co-occur, this would support ecological character displacement. Alternatively, if E. canadensis differs similarly throughout its range, this would imply that selection for earlier eclosion enabled subsequent range or host expansion (or both) for the fly, allowing for E. canadensis and R. ribicola to co-occur. In support of the latter hypothesis, in Winnipeg, Canada, where R. ribicola has not been reported (Bush Reference Bush1966; Foote et al. Reference Foote, Blanc and Norrbom1993), Mitchener (Reference Mitchener1927) observed that E. canadensis oviposited into currants that were three-quarters green. This suggests that earlier adult eclosion and a preference for attacking early fruit evolved in E. canadensis independently of the presence of R. ribicola.
The temporal division of limiting food resources has been observed for a wide range of insects and, therefore, given the ubiquity of insects and phytophagous insects in particular, would appear common in nature (e.g., Headrick and Goeden Reference Headrick and Goeden1990; Inbar and Wool Reference Inbar and Wool1995; Debouzie et al. Reference Debouzie, Heizmann, Desouhant and Menu1996; Albrecht and Gotelli Reference Albrecht and Gotelli2001; Yadav and Singh Reference Yadav and Singh2005; Agarwal and Rastogi Reference Agarwal and Rastogi2009; Venner et al. Reference Venner, Pélisson, Bel-Venner, Débias, Rajon and Menu2011; Hood et al. Reference Hood, Blankinship, Doellman and Feder2021; Reut et al. Reference Reut, Chrabąszcz and Moniuszko2021). However, temporal partitioning of host fruit resources has rarely been reported for temperate tephritids. Also, in the case of two temperate tephritids attacking knapweed, temporal partitioning did not appear to be a factor in coexistence (Mays and Kok Reference Mays and Kok2003). Although temporal resource division helps ameliorate competition, the results of the present study also point to the likely involvement of other factors, such as fly behaviour, resource availability, and fly abundance, in allowing E. canadensis and R. ribicola to coexist.
Behavioural mechanisms
Females of both species appear to oviposit singly into fruit, thereby largely avoiding instances of multiple infestation. Such behaviour could reduce both intra- and interspecific competition. It can be hypothesised that if R. ribicola is like 10 other Rhagoletis species (Prokopy Reference Prokopy1981), it deposits an oviposition-deterring pheromone that reduces the chances of conspecifics ovipositing into an egg-occupied fruit. Intraspecific larvae thus do not compete or risk cannibalisation (Balduf Reference Balduf1959). Interspecific competition could be avoided even further if there is interspecific recognition of oviposition-deterring pheromones. It is not known whether E. canadensis has an oviposition-deterring pheromone. Evidence for or against such pheromones playing a role in coexistence could be provided through experiments that expose clean fruit to E. canadensis or R. ribicola. Observations can then be made to determine whether flies of either or both species that sting fruit drag their aculei and deposit liquid on fruit. The fruit could then be exposed to flies and their behavioural responses to fruit recorded.
Resource availability and fly abundances
It can be hypothesised that low infestation levels of golden currants relative to high fruit abundance on bushes may also mitigate competition and contribute to species coexistence. Niche overlap was high for E. canadensis and R. ribicola in June. However, this may not result in interspecific competition if golden currant fruit are not a limiting resource for either tephritid species at this time. Under this scenario, coexistence can be maintained even when niche overlap measures are high (Pianka Reference Pianka1974; Sale Reference Sale1974; Rusterholz Reference Rusterholz1981). The possibility of high resource levels that allow coexistence has been suggested for two moths attacking the same fruit stage of Schoepfia schreberi (Schoepfiaceae), which can occur and persist in high numbers during some parts of the season (López-Ortega et al. Reference López-Ortega, Pérez-Rodríguez, Rojas, Soto Hernández, López-Mata and Rico-Gray2013). The same may be true for E. canadensis and R. ribicola. Additional studies on the availability of usable host resources throughout the field season and additional years of surveys at more sites would be necessary to confirm this hypothesis. Based on observations at our field sites in central Washington, it appears that golden currant fruit loads are high on plants in May and June, when flies are present. Specifically, visual estimates suggested more than 5000 fruit per plant for three consecutive years at the Union Gap site. However, this does not mean that of all these fruit or bushes are suitable for oviposition or infestation: Piper and Doane (Reference Piper and Doane1898), for example, reported that R. ribicola infestations in Washington are heavy in a few bushes but not in others within a patch.
Infestation rates of R. ribicola in currants and gooseberries outside of Washington state have not been reported, and it is therefore not possible to determine whether the low larval abundances – less than 10% of fruit with larvae – seen across sites in the present study are typical in other regions of western North America. However, E. canadensis infestations in California and Oregon, United States of America, were “heavy” in currant and gooseberry (Paine Reference Paine1912; Jones Reference Jones1937), although it is possible that fly population sizes or genetics due to climate or other unknown factors have changed over the last 100 years. In contrast to our results, other fruit in central Washington might be a limiting resource for Rhagoletis, forcing flies to lay eggs into already infested fruit. For example, 35–100% of sweet and tart cherries and 22–95% of bitter cherries can be infested by R. indifferens, 2–32% of snowberry fruit can be infested by Rhagoletis zephyria Snow, 4–27% of rose hips can be infested by R. basiola, and 100% of walnuts can be infested by Rhagoletis completa Cresson (Yee Reference Yee2005, Reference Yee2008).
We currently lack sufficient long-term data to know whether fruit loads in golden currants tend to be heavy in most years, as during the 2023–2025 period of the present study. If years occur when currant fruit loads are low, fly populations may decline as a result in succeeding years and may take many years to recover, which would explain the low infestation rates here. Low fruit loads may also increase rates of multiple infestation, increasing levels of competition. Surveys of fruit loads over larger geographic areas and more years are needed to support the hypothesis that low infestations play a role in coexistence.
In general, more widespread species tend to be more successful than rarer species (Brown Reference Brown1984). This would imply that E. canadensis, being more widespread, should be more successful or more abundant than R. ribicola. However, although E. canadensis adults were significantly more abundant than R. ribicola at the Union Gap and Cowiche sites in 2024, we did not detect a significant difference in larval abundance between the two species in golden currant fruit. One possible explanation for this is that E. canadensis is less fecund than R. ribicola, because higher adult populations should be associated with greater larval abundance. For example, at Union Gap, R. ribicola was more abundant in 2025 (Fig. 4) than in 2024 (Fig. 3), and larval abundances in June 2025 and 2024 were correspondingly 0.148 and 0.09 larvae/fruit, respectively. Alternatively, differences in natural mortality, dispersal, or oviposition site (i.e., bush location) may exist between the species. More work is needed to resolve the differences in abundances of adult and larval life stages of E. canadensis and R. ribicola infesting golden currant.
Comparative systems
We are aware of several other potential examples of seasonal partitioning of shared host fruit resources in temperate tephritids in addition to the E. canadensis and R. ribicola system described here and those involving cherry-infesting flies discussed in the Introduction. Specifically, walnut-infesting flies in the Rhagoletis suavis (Loew) species group form three different secondary contact zones in the United States of America (Bush Reference Bush1966; Glover et al. Reference Glover, Egan, Hood, Rull, Aluja and Feder2018). In all three zones, different pairs of walnut flies co-occur and attack the same species of Juglans (Juglandaceae) host and even infest the same trees. In each contact zone, one of the two flies ecloses 2–4 weeks earlier in the season than the other, implying temporal subdivision of shared walnut resources similar to the temporal subdivision of currants by E. canadensis and R. ribicola observed in the present study. Another tephritid example centres on juniper-infesting species in the genera Paraterellia and Rhagoletis: this system is even more like the E. canadensis and R. ribicola system in that different tephritid genera are involved. In the Paraterellia–Rhagoletis system, several cases have been observed in which the two taxa attack the same Juniperus (Cupressaceae) host in sympatry but differ significantly by more than a month when they eclose as adults and infest juniper cones as larvae (Jeffrey L. Feder, unpublished data). Other examples of temporal resource partitioning among temperate tephritid fruit flies may await discovery and verification.
Applied implications
The results of the present study have applied implications for invasive fruit fly pests. Understanding temporal partitioning can help inform monitoring and management decisions for tephritid pests that co-occur in fruit trees. For example, if R. cerasi, which is invasive in eastern North America (Barringer Reference Barringer2018), transitions from honeysuckles to cherries, it might infest cherries earlier than the native pest R. cingulata does (Vogt et al. Reference Vogt, Köppler, Dahlbeck and Hensel2010). If the two species coexist due to temporal partitioning of cherries, traps for detecting flies need to be deployed earlier and the fly management period will be prolonged. Fly pressure may increase due to the presence of the two pests. Also, R. cerasi has yet to be found in the Pacific Northwest, where a major commercial cherry industry is located, but it could alter timing of and increase sprays for fly control if it invades the region, depending on how it interacts with R. indifferens, the native fly attacking cherries in the region (Prengaman Reference Prengaman2017). Therefore, understanding insect life history timing is not only important for understanding the creation and maintenance of species biodiversity but also has applied significance for pest management.
Supplementary material
The supplementary material for this article can be found at https://doi.org/10.4039/tce.2026.10074.
Acknowledgements
The authors thank Alexander Rose, Hazen Jacob, Ricky Cisneros, Chey Temple, and Amy Paredes (United States Department of Agriculture, Agricultural Research Service) for technical assistance in the field and laboratory and Michael Bush (Washington State Department of Agriculture) for assisting with this project. Mention of trade names or commercial products in this publication is solely for the purpose of providing specific information and does not imply recommendation or endorsement by the United States Department of Agriculture and the Washington State Department of Agriculture. The United States Department of Agriculture and the Washington State Department of Agriculture are equal opportunity providers and employers.
Author contributions
W.L.Y. and J.M.M. conceived the research. W.L.Y. created the graphs and conducted statistical analyses. W.L.Y., J.M.M., and J.L.F. contributed ideas to various parts of the manuscript and wrote the manuscript.
Funding statement
This study was financed using discretionary funds from the United States Department of Agriculture, Agricultural Research Service.
Competing interests
The authors declare that they have no conflicts of interest.


 Open access

