Introduction
Grazing poses several management challenges to intensive dairy farming among the following: nitrogen (N) utilisation, diet optimisation and seasonal variation in production level (Kristensen et al., Reference Kristensen, Søegaard and Kristensen2005). Additionally, grass often has a high content of sugar (Smouth et al., Reference Smouth, Simpson and Pearce1995), which may induce high butyrate fermentation in the rumen and challenge the metabolic capacity of splanchnic tissues (Kristensen and Harmon, Reference Kristensen and Harmon2004). It is common to find a high content of rumen degradable protein in grass (Van Vuuren et al., Reference Van Vuuren, Tamminga and Ketelaar1991), which can lead to excessive ammonia absorption from the rumen and low overall N utilisation by the cows. Dairy cows and other ruminants have a unique ability to recycle urea-N to the forestomach, where it can be utilised in microbial protein synthesis. Theoretically, efficient recycling of endogenous urea-N will make it possible to maintain N supply for rumen microbes with less dietary N intake (Lapierre and Lobley, Reference Lapierre and Lobley2001). Nonetheless, under practical farming conditions dairy operations utilise only approximately 25% of the dietary N for milk, weight gain and foetal growth (Børsting et al., Reference Børsting, Kristensen, Misciattelli, Hvelplund and Weisbjerg2003). Numerous diet-related factors can influence N efficiency, such as overfeeding with rumen degradable protein (Hristov et al., Reference Hristov, Etter, Ropp and Grandeen2004), lack of synchronisation between ruminal carbohydrate and protein degradation (Casper et al., Reference Casper, Maiga, Brouk and Schingoethe1999), unbalanced composition of amino acids absorbed in the small intestine (Rulquin et al., Reference Rulquin, Pisulewski, Vérité and Guinard1993) and undersupply of nutrients other than amino acids (Firkins et al., Reference Firkins, Hristov, Hall, Varga and St-Pierre2006). However, N efficiency is influenced by not only dietary factors but also the production level of the cow and the inevitable endogenous amino acid catabolism influences overall efficiency (Lobley, Reference Lobley2003). Ruminants have a competitive advantage compared with other species by having a digestive system that makes it possible to reutilise endogenous N. Data reviewed by Lapierre and Lobley (Reference Lapierre and Lobley2001) showed that on average 43% of the endogenous urea production was taken up into the gastro-intestinal tract as estimated from the negative net portal flux of urea. Marini and Van Amburgh (Reference Marini and Van Amburgh2003) found that the gut entry rate of urea (urea transferred by saliva plus urea transported directly from the blood to the gastro-intestinal tract) relative to the urea entry rate (total urea production by the liver) varied from 29% to 83% in heifers fed decreasing amounts of dietary N. These data show that the gut urea entry is quantitatively important to the overall N metabolism and that improved control of urea recycling might be a valuable tool for future strategies to improve N efficiency of dairy cows. In the present study, we aimed to investigate the urea metabolism in lactating cows fed a clover grass-based diet with relatively low N content and to test the hypothesis that feeding of rapidly degradable carbohydrates before allowing cows to graze would improve the ruminal capture of grass N and decrease ammonia absorption and hepatic urea synthesis. The objectives of the study were to measure urea metabolism and to study ruminal fermentation and short-chain fatty acids (SCFA) metabolism under conditions with high sugar intake from grass and different strategies for concentrate supplementation in lactating dairy cows.
Material and methods
The present experiment complied with the Danish Ministry of Justice, Law no. 382 (10 June 1987), Act no. 726 (9 September 1993) concerning experiments with animals and care of experimental animals.
Animals
Three Danish Holstein cows (parity 1, 2 and 3), 608 ± 24 kg of body weight, 267 ± 24 days in milk with a milk yield of 20, 7 and 21 kg/day, respectively, were used. The cows were fitted with a ruminal cannula (no. 1C; Bar Diamond Inc., Parma, ID, USA) and permanent indwelling catheters in the mesenteric artery, mesenteric vein, hepatic portal vein and hepatic vein (Huntington et al., Reference Huntington, Reynolds and Stroud1989). First sampling was 14 to 23 days after surgery. The cows were kept in tie stalls with wood shavings as bedding. The barn was lit from 0530 to 2200 h. The cows were milked at 0600 and 1600 h; milk production was recorded at each milking.
Experimental treatments
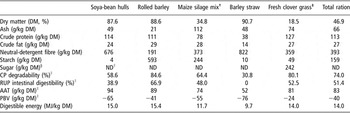
Three experimental treatments differing by the time of day of feeding two different concentrate supplements relative to feeding fresh clover grass were tested in a 3 × 3 Latin-square design with 1-week periods and sampling for 24 h on the last day of each period. Short experimental periods of only 1 week were chosen to minimise the variation in clover grass between experimental periods and thereby decrease period × treatment interactions. To minimise the need for adaptation between experimental periods, the composition of the daily ration remained fixed across all treatments (% of dry matter (DM): fresh clover grass, 47; maize silage mixed with minerals and vitamins, 16; soya-bean hulls, 18; rolled barley, 18; and barley straw, 1). The chemical composition is given in Table 1. The treatments were as follows: soya-bean hulls fed at 0700 h and barley fed at 1530 h (SAM), barley fed at 0700 h and soya-bean hulls fed at 1530 h (BAM), and both soya-bean hulls and barley fed at 1530 h (SBPM). Feed was offered restrictively according to feed intake by the individual cow in the previous week. Fresh clover grass was harvested every morning at 0730 h and offered from 0800 to 1500 h. Maize silage mixed with minerals and vitamins (Table 1) and barley straw were fed to all cows at 1530 h. Cows were offered the experimental diet at least 10 days before the first sampling. Every morning and afternoon feed refusals were removed and weighed. DM intake was recorded on a daily basis.
Chemical composition of feedstuffs and total ration

†Maize silage mix containing (in % of DM): maize silage (89.4), mineral mix (7.0; Type 2, Vitfoss, Gråsten, Denmark), vitamins (0.8; Rød Solitren, Leo Pharmaceutical. Products, Vejen, Denmark), sodium chloride (1.4) and sodium sulphate (1.4).
‡The clover grass as sowed was a mixture of 17% white clover (Trifolium repens) and 83% perennial ryegrass (Lolium perenne).
§Sugar is the sum of glucose, fructose, sucrose and fructan.
∥Abbreviations are: ND = not determined; CP degradability = effective rumen protein degradability calculated from in situ incubations; RUP intestinal digestibility = intestinal digestibility of undegraded feed protein calculated from rumen and total tract digestibility; AAT = amino acids absorbed in the small intestine (Madsen et al., Reference Madsen, Hvelplund, Weisbjerg, Bertilsson, Olsson, Spörndly, Harstad, Volden, Tuori, Varvikko, Huhtanen and Olufsson1995); PBV = protein balance in the rumen (rumen degradable CP – predicted potential microbial CP synthesis; Madsen et al., Reference Madsen, Hvelplund, Weisbjerg, Bertilsson, Olsson, Spörndly, Harstad, Volden, Tuori, Varvikko, Huhtanen and Olufsson1995).
Intravenous infusion
Continuous infusion of p-aminohippuric acid (pAH; 31 ± 4 mmol/h) into the mesenteric vein was initiated at 0500 h on sampling days. Infusates were prepared the day before sampling by dissolving pAH (186.7 mmol/kg of infusate) in sterile water. The pH was adjusted to 7.4 using sodium hydroxide. The infusates were transferred to sterile bottles by filtration (0.45 and 0.2 μm; Supor® membrane; VacuCap® 90 Filter Unit, Pall Life Sciences, Ann Arbor, MI, USA). Peristaltic pumps (Slangepumpe type 110; Ole Dich Instrumentmakers, Hvidovre, Denmark) were used to infuse pAH and infusates were weighed several times during samplings to verify constant infusion rates.
Sampling procedures
In all, 16 sets of blood samples were obtained simultaneously from the artery, portal and hepatic catheters by slowly drawing blood into 10-ml syringes at 1.5-h intervals starting at 0600 h. A total of 20 ml blood was obtained from each catheter at every sampling. Blood was transferred into sodium heparin vacutainers (Greiner Bio-One; Kremsmünster, Austria), mixed and placed on ice immediately after collection. Five separate sets of blood samples were obtained in 1-ml heparinised syringes and immediately taken for blood gas and oximetry analysis starting at 0900 h and thereafter at 4.5-h intervals. Packed cell volume was determined for all arterial samples by centrifugation of microcapillary tubes at 12 000 × g for 6 min. Plasma was harvested by centrifugation at 3000 × g at 4°C for 20 min and stored below −20°C until analysis. Sixteen samples of ruminal fluid were obtained at the same time intervals as blood sampling using a 100-ml bottle pushed to the bottom of the ventral rumen sack of the cow and allowed to fill with ruminal fluid. Ruminal samples were immediately placed on ice. Ruminal fluid was spun at 3000 × g at 4°C for 10 min. The pH was measured and a subsample of 8 ml of supernatant was combined with 2 ml of 25% meta-phosphoric acid and stored at −20°C until analysis for SCFA. Ruminal fluid without meta-phosphoric acid was transferred into centrifuge tubes and stored at −20°C until analysis for glucose, lactate and ammonia. Twenty-four-hours quantitative urine (sulphuric acid stabilised) and faeces collection was initiated at 0545 h. Feedstuffs were sampled on sampling days and stored at −20°C until analysis. Milk samples were obtained weekly. Frequency of primary ruminal contractions was recorded in a 15-min window around every blood sampling using an intrareticular bolus with a data logger (Sievers et al., Reference Sievers, Kristensen, Laue and Wolffram2004).
Analytical procedures
Chemical composition of feedstuffs and the total ration are presented in Table 1. The DM content of concentrates and roughages was determined at 100°C for 20 h in a forced-air oven. N was determined as described by Hansen (Reference Hansen1989). Ash was determined after combustion at 525°C for 6 h. Crude fat was analysed according to Stoldt (Reference Stoldt1952), where an initial hydrolysis in HCl was followed by a Soxhlet extraction with petroleum ether. Ash-free neutral-detergent fibre (NDF) was determined in a Fiber-Tec system according to Van Soest et al. (Reference Van Soest, Robertson and Lewis1991) with sulphite and an α-amylase pre-treatment overnight (38°C). Starch analysis was performed as described by Åman and Hesselman (Reference Åman and Hesselman1984). The content of sugars in grass was determined as described by Larsson and Bengtsson (Reference Larsson and Bengtsson1983). Ruminal crude protein (CP) degradability was determined by the in situ method (Hvelplund and Weisbjerg, Reference Hvelplund and Weisbjerg2000) using three dry, rumen-cannulated cows on standard diets (67% hay and 33% concentrate). Intestinal digestibility of CP was determined by the mobile nylon bag method (Hvelplund et al., Reference Hvelplund, Weisbjerg and Andersen1992). N content in the nylon bags was determined according to the Kjeldahl method using an automated Kjel–Foss apparatus (Foss Electric, Hillerød, Denmark). Blood pH and total blood concentrations of O2 and CO2 were measured using an ABL520 blood gas analyser (Radiometer, Copenhagen, Denmark). Concentration of pAH in blood plasma was determined as described by Harvey and Brothers (Reference Harvey and Brothers1962). Plasma concentrations of urea-N were determined by the diacetyl monoxime method (Marsh et al., Reference Marsh, Fingerhut and Miller1965). The recovery of urea in the plasma fraction of whole blood was investigated by spiking 5 ml plasma and 5 ml whole blood from three cows with 200 μl of a 0.5, 1.0 and 2.5 mmol/l urea solution using deionised water as balance. The relative urea response in plasma from spiked whole blood relative to directly spiked plasma was 109 ± 3%. Therefore, to obtain whole-blood urea-N concentrations plasma urea-N data were divided by a factor of 1.09. Ammonium was determined in plasma by the glutamate dehydrogenase reaction (Spooner et al., Reference Spooner, Toseland and Goldberg1975). The procedure was adapted to run on a Cobas Mira Plus auto analyser (Triolab A/S, Brøndby, Denmark) using straight plasma. In a recovery experiment for ammonium similar to that described for urea, no difference was observed in the response when comparing blood plasma and whole blood spiked with ammonium. Whole blood concentrations of ammonia were set equal to blood plasma concentrations. Plasma concentrations of l-lactate, d-glucose and l-glutamine, and rumen fluid concentrations of ammonia, d-glucose and l-lactate were determined by immobilised oxidase enzyme membranes and ion-selective electrodes using a Select Biochemistry Analyzer (YSI 7100; Yellow Spring Instruments, OH, USA). Plasma SCFA was analysed as described by Kristensen (Reference Kristensen2000). Ruminal fluid with 5% meta-phosphoric acid was analysed for SCFA by gas chromatography (Kristensen et al., Reference Kristensen, Danfær, Tetens and Agergaard1996). Urinary urea-N was measured as described by Marsh et al. (Reference Marsh, Fingerhut and Miller1965). Urinary N was determined as described by Hansen (Reference Hansen1989). Faeces were analysed for N, ash, NDF and DM according to the same procedures as feed. Milk was analysed for the content of protein, fat, lactose and urea-N by IR using a Milkoscan 4000 (Foss Electric).
Calculations
Digestible energy in feed was calculated according to Weisbjerg and Hvelplund (1993). The amino acids absorbed in the small intestine (AAT) and the protein balance in the rumen (PBV) were calculated according to the system described by Madsen et al. (Reference Madsen, Hvelplund, Weisbjerg, Bertilsson, Olsson, Spörndly, Harstad, Volden, Tuori, Varvikko, Huhtanen and Olufsson1995), utilising data on effective protein degradability in the rumen and intestinal digestibility of rumen undegraded feed protein (RUP) of individual feed components obtained from in situ incubations and corrected for loss of small particles according to Hvelplund and Weisbjerg (Reference Hvelplund and Weisbjerg2000). Portal and hepatic blood plasma flow (l/h) was calculated as follows: infusion rate of pAH/(portal pAH concentration − arterial pAH concentration) and infusion rate of pAH/(hepatic pAH concentration − arterial pAH concentration), respectively. Whole blood flow (l/h) was calculated as plasma flow/(1 − (haematocrit/100)). Hepatic arterial blood flow was calculated as hepatic flow − portal flow. The net portal flux was calculated as portal blood flow or plasma flow × (portal concentration − arterial concentration) using either whole blood or plasma values as indicated. The net hepatic flux was calculated as follows: hepatic blood flow or plasma flow × hepatic concentration − ((portal blood flow or plasma flow × portal concentration) + (hepatic blood flow or plasma flow – portal blood flow or plasma flow) × arterial concentration). The total splanchnic flux was calculated as hepatic blood flow or plasma flow × (hepatic concentration − arterial concentration). A positive net flux indicates a net release or production of a nutrient and a negative net flux indicates uptake or utilisation. Hepatic extraction ratios were calculated as follows: (−) net hepatic flux/(portal blood flow or plasma flow × portal concentration) + (hepatic blood flow or plasma flow − portal blood flow or plasma flow) × arterial concentration). Urea entry rate (mmol/h) was defined as the net hepatic flux of urea-N. Gastro-intestinal entry rate of urea-N (mmol/h) was calculated as urea entry rate − (urea-N excretion in urine + urea-N excreted in milk). Salivary urea-N flux was calculated as gastro-intestinal entry rate − net portal flux of urea-N. The portal-drained viscera (PDV) extraction ratio of urea-N was calculated as (−) net portal flux of urea-N/(arterial blood concentration of urea-N × portal blood flow).
Statistical analysis
Data on ruminal variables, arterial variables and net fluxes were analysed as repeated measurements by the MIXED procedure of SAS version 8.02 (2001) using the autoregressive covariance structure; AR(1) (Littell et al., Reference Littell, Milliken, Stroup and Wolfinger1996). Effects of treatment (Trt), experimental period, sampling time (Time) and treatment × sampling time (Trt × Time) were included in the model as fixed effects. The effect of cow was included as a random effect. Treatment means were separated using the pairwise difference option in the least-square means procedure when an overall treatment effect (P < 0.05) was detected. Data on feed intake, N balance and urea kinetics were analysed by ANOVA using the generalized linear model procedure of SAS (Littell et al., Reference Littell, Milliken, Stroup and Wolfinger1996). Effects of cow, treatment and period were included in the model. The data set is complete except for the loss of hepatic blood samples number 1 and 2 and arterial blood samples number 5, 6 and 9 for one cow in the last sampling period. In the last sampling period pAH infusion was terminated after the 10th blood sample for two cows. In case of missing samples, means were weighted by time, i.e. each sample represents a sampling window starting in time halfway between the previous and the actual sample and ending in time halfway between the actual and the following sample. Significance was declared at P ⩽ 0.05. A tendency was declared for 0.05 < P < 0.10. All data are presented as mean ± residual standard error.
Results
Diet composition and feed intake
The experiment was conducted in a period with abnormal spring weather from May to June, 2004. The grass had a lower content of CP (12.7% of DM) than expected (23.5%) and the total ration was low in CP (11.3% of DM; Table 1). The estimated ruminal protein balance (PBV value) for the ration was highly negative: −549 g/day. The digestibility of NDF was not affected by treatment and averaged 0.69 ± 0.03. Total DM intake did not differ between treatments (Table 2) and averaged 13.6 ± 1.1 kg DM per day.
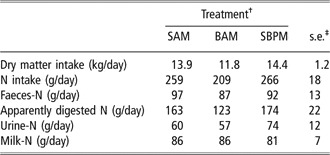
Nitrogen (N) balance in lactating Holstein cows

†Treatments differed by the time of day of feeding two different concentrate supplements relative to feeding fresh grass. The treatments were soya-bean hulls fed at 0700 h and barley fed at 1530 h (SAM), barley fed at 0700 h and soya-bean hulls fed at 1530 h (BAM) and both soya-bean hulls and barley fed at 1530 h (SBPM).
‡Residual standard error of the mean (n = 3).
Nitrogen balance and milk yield
N intake and apparently digested N were not affected by treatments and averaged 245 ± 63 and 153 ± 45 g/day, respectively. Faeces N, urine N and milk N were not affected by treatments (Table 2). Milk yield and yields of protein, fat and lactose were not affected by treatments and averaged 16.1 ± 6.7 kg/day, 32.6 ± 0.9, 46.5 ± 3.7 and 46.9 ± 0.1 g/kg, respectively. The recovery of feed N in milk did not differ between treatments and averaged 0.34 ± 0.11.
Ruminal variables
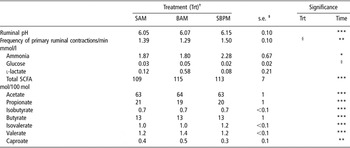
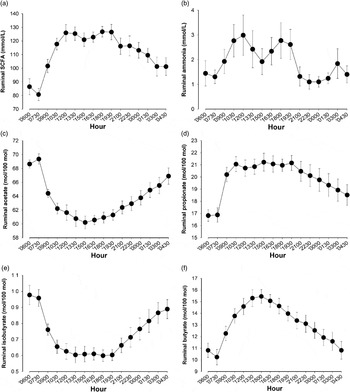
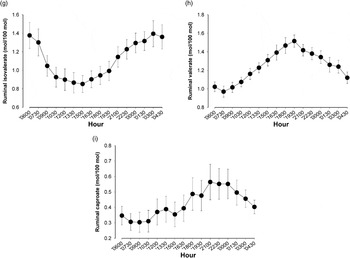
The frequency of ruminal contractions tended (P < 0.10) to increase with SBPM, no other ruminal variables were affected by treatment (Table 3). Ruminal concentrations of total SCFA (Figure 1a) and ammonia (Figure 1b) as well as the frequency of primary ruminal contractions increased after the morning feeding and ruminal glucose tended to increase. Molar proportions of ruminal acetate (Figure 1c), isobutyrate (Figure 1e) and isovalerate (Figure 1g as well as ruminal pH decreased after the AM feeding. Average ruminal pH below 5.7 was not recorded at any time. The molar proportions of propionate (Figure 1d), butyrate (Figure 1f), valerate (Figure 1h and caproate (Figure 1i) increased after the AM feeding. Timing of the apparent zenith for molar proportions of the individual SCFA differed: propionate, 1030 h; butyrate, 1500 h; valerate, 1930 h; and caproate, 2100 h.
Ruminal variables

†Treatments differed by the time of day of feeding two different concentrate supplements relative to feeding fresh grass. The treatments were soya-bean hulls fed at 0700 h and barley fed at 1530 h (SAM), barley fed at 0700 h and soya-bean hulls fed at 1530 h (BAM), and both soya-bean hulls and barley fed at 1530 h (SBPM).
‡Residual standard error of the mean (n = 3).
§Tendency (P < 0.1).
Ruminal variables in lactating Holstein cows fed a low-nitrogen clover grass-based diet. Grass was offered from 0800 to 1500 h. Supplement was fed at 0700 and/or 1530 h and maize silage at 1530 h. (a) Concentration of short-chain fatty acids (SCFA), (b) concentration of ammonia, (c) molar proportion of acetate, (d) molar proportion of propionate, (e) molar proportion of isobutyrate, (f) molar proportion of butyrate, (g) molar proportion of isovalerate, (h) molar proportion of valerate and (i) molar proportion of caproate. Each data point is the mean of nine observations ± s.e.


Arterial variables
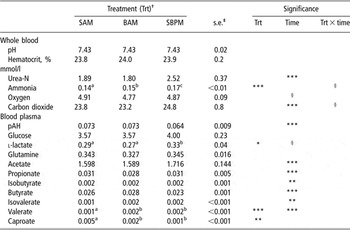
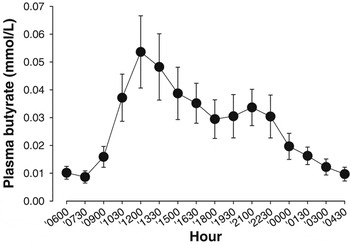
The arterial concentrations of ammonia and lactate were greater with SBPM compared with SAM and BAM (P < 0.05; Table 4) and a tendency for a treatment × time interaction (P < 0.10) for ammonia was observed, reflecting a higher concentration with SBPM during the time with grass intake. The arterial concentration of valerate was lower and that of caproate was higher with SAM compared with BAM and SBPM. None of the other arterial variables was affected by treatment (Table 4). The arterial concentration of urea-N increased and the arterial concentrations of carbon dioxide, pAH and glucose decreased following the morning feeding (P < 0.05; Table 4). The arterial concentrations of oxygen and l-lactate tended to increase after the morning feeding (P < 0.10). Arterial blood pH and haematocrit as well as and the plasma glutamine concentration were not affected by time of sampling. All arterial SCFA concentrations except for caproate were affected by time of sampling (P < 0.05) and for all SCFA except for caproate the arterial concentration increased following the morning feeding with the most pronounced effect observed for butyrate with an approximately six-fold increase (Figure 2).
Arterial variables

a,b,cMeans within a row that do not have common superscripts differ, P < 0.05.
†Treatments differed by the time of day of feeding two different concentrate supplements relative to feeding fresh grass. The treatments were soya-bean hulls fed at 0700 h and barley fed at 1530 h (SAM), barley fed at 0700 h and soya-bean hulls fed at 1530 h (BAM) and both soya-bean hulls and barley fed at 1530 h (SBPM).
‡Residual standard error of the mean (n = 3).
§Tendency (P < 0.1).
Arterial plasma concentration of butyrate in lactating Holstein cows fed a low-nitrogen grass-based diet. Grass was offered from 0800 to 1500 h. Supplement was fed at 0700 and/or 1530 h and maize silage at 1530 h. Each data point is the mean of nine observations ± s.e.

Blood flows
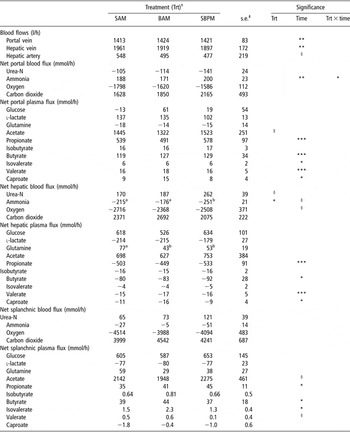
Portal and hepatic blood flows increased (P < 0.05) and the hepatic arterial blood flow tended to increase following the morning feeding (P < 0.10; Table 5).
Blood flows and net portal flux, net hepatic flux, and net splanchnic flux of metabolites

a,bMeans within a row that do not have common superscripts differ, P < 0.05.
†Treatments differed by the time of day of feeding two different concentrate supplements relative to feeding fresh grass. The treatments were soya-bean hulls fed at 0700 h and barley fed at 1530 h (SAM), barley fed at 0700 h and soya-bean hulls fed at 1530 h (BAM) and both soya-bean hulls and barley fed at 1530 h (SBPM).
‡Residual standard error of the mean (n = 3).
§Tendency (P < 0.1).
Net portal fluxes
The net portal flux of ammonia was affected by treatment × time (P < 0.05), reflecting increased net portal flux of ammonia from 0600 to 1330 h with SAM compared with BAM. Treatment SBPM was not different from the other treatments and the numerical differences were small (Table 5).
The net portal flux of acetate tended (P < 0.10) to decrease with BAM compared with SAM and SBPM. The net portal fluxes of SCFA other than acetate were not affected by treatment (Table 5). The net portal fluxes of propionate, butyrate, isovalerate, valerate and caproate increased after the morning feeding (P < 0.05).
Net hepatic fluxes
The net hepatic flux of ammonia was lower (P < 0.05) with BAM compared with SBPM, none of these treatments differed from SAM. The net hepatic flux of urea-N tended (P < 0.10) to be greater with SBPM compared with SAM and BAM. None of the other net hepatic fluxes was affected by treatment (Table 5). The net hepatic uptake of oxygen tended (P < 0.10) to increase after morning feeding. The net hepatic flux of carbon dioxide, glutamine, glucose, l-lactate, acetate, isobutyrate and isovalerate were not affected by time of sampling. The net hepatic flux of propionate, butyrate, valerate and caproate were affected (P < 0.05) by sampling time, reflecting an increased hepatic uptake of these SCFA after the morning feeding, lasting until approximately 2230 h when the hepatic uptake started to decrease to the pre-feeding level.
Net splanchnic fluxes
None of the net splanchnic fluxes were affected by treatment (Table 5). The net splanchnic flux of urea-N was overall positive, whereas the net splanchnic flux of ammonia was overall negative. The net splanchnic flux of oxygen, carbon dioxide, glutamine, glucose and l-lactate were not affected by time of sampling. The net splanchnic flux of propionate and butyrate increased after the morning feeding and the net splanchnic flux of acetate tended to increase. The net splanchnic flux of butyrate increased more than 22-fold from the sampling at 0600 h to the apparent zenith at 1200 h.
Hepatic extraction ratios
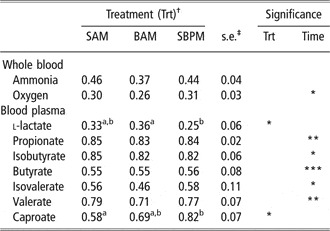
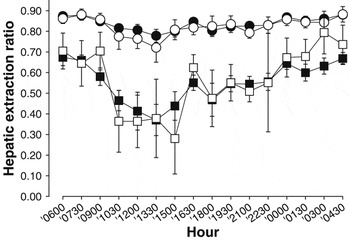
The hepatic extraction ratio of l-lactate was lower (P < 0.05) with SBPM compared with SAM and BAM and the hepatic extraction ratio for caproate was lower (P < 0.05) with SAM compared with SBPM, none of these treatments differed from BAM. No treatment effects were observed for other metabolites with positive hepatic extraction ratios (Table 6). The hepatic extraction ratio of oxygen and valerate increased after the morning feeding. The hepatic extraction ratio of propionate, isobutyrate, butyrate and isovalerate decreased after the morning feeding. Nadir was observed between 1330 and 1500 h. The overall level and the pattern of hepatic extraction ratios showed large resemblance between propionate and isobutyrate as well as between butyrate and isovalerate, but the reduction in hepatic extraction was much greater for butyrate and isovalerate compared with propionate and isobutyrate (Figure 3). The hepatic extraction ratios for l-lactate, glutamine and caproate were not affected by sampling time.
Hepatic extraction ratio of metabolites

a,bMeans within a row that do not have common superscripts differ, P < 0.05.
†Treatments differed by the time of day of feeding two different concentrate supplements relative to feeding fresh grass. The treatments were soya-bean hulls fed at 0700 h and barley fed at 1530 h (SAM), barley fed at 0700 h and soya-bean hulls fed at 1530 h (BAM) and both soya-bean hulls and barley fed at 1530 h (SBPM).
‡Residual standard error of the mean (n = 3).
Hepatic extraction of propionate (filled circle), isobutyrate (open circle), butyrate (closed square) and isovalerate (open square) in lactating Holstein cows fed a low-nitrogen grass-based diet. Grass was offered from 0800 to 1500 h. Supplement was fed at 0700 and/or 1530 h and maize silage at 1530 h. Each data point is the mean of nine observations ± s.e.

Urea-N kinetics
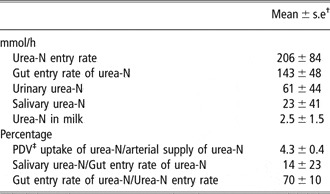
None of the urea-N kinetic variables was affected by treatment (Table 7). However, overall as much as 70 ± 10% of the total entry rate of urea-N was transferred to the gastro-intestinal tract, i.e. gut entry rate of urea-N. Salivary urea-N accounted for 14 ± 23% of the gut entry rate of urea-N. The urea-N recycling via direct transfer across PDV epithelia was equal to 4.3 ± 0.4% of the arterial supply of urea-N to the PDV tissues. The urinary urea excretion accounted for 8% of N intake.
Urea kinetics in lactating Holstein cows fed a low-nitrogen (N) grass-based diet

†Standard error of the mean (n = 9).
‡Portal-drained viscera.
Discussion
Ammonia and digestibility
The ruminal ammonia concentration did not differ between treatments, and even when greatest (3.0 ± 0.8 mmol/l at 1200 h) it was lower than the threshold of 3.5 mmol/l previously assumed to limit microbial growth (Satter and Slyter, Reference Satter and Slyter1974) and depress fibre digestion (Volden, Reference Volden1999). The NDF digestibility in the present study did not indicate a major depression of the fibre digestion caused by low N content and if the cows were affected by the low N content it might have affected DM intake rather than digestibility as previously observed in beef steers fed low-N diets (Klevesahl et al., Reference Klevesahl, Cochran, Titgemeyer, Wickersham, Farmer, Arroquy and Johnson2003). Similarly, Marini and Van Amburgh (Reference Marini and Van Amburgh2003) observed that total tract NDF digestibility in heifers was depressed on a 1.45% N diet (ruminal ammonia 0.8 mmol/l) but not on a 1.89% N diet (ruminal ammonia 1.2 mmol/l).
Ruminal SCFA
The high sugar content (242 g/kg DM) of the fresh clover grass gave a marked ruminal butyrate response as expected from the finding of butyrate fermentation when feeding sugar to cattle (Heldt et al., Reference Heldt, Cochran, Stokka, Farmer, Mathis, Titgemeyer and Nagaraja1999; Norton et al., Reference Norton, Peiris and Elliott1994). The pattern of ruminal butyrate seemed closely related to grass intake, i.e. no response to supplement intake before grass feeding and the molar proportion of butyrate started to decline when the grass was removed in the afternoon. Ruminal SCFA profiles were strikingly different. The molar proportion of propionate was relatively stable from 0900 to 2100 h compared with butyrate, and both the response in valerate and caproate were delayed and did not peak until 1930 to 2100 h. The lack of treatment effects on ruminal SCFA indicates that the different SCFA patterns were predominantly driven by the sequential feeding of grass and maize silage.
Arterial variables
Despite the low N content of the feed, the omission of supplement before grass feeding with treatment SBPM resulted in slightly increased arterial ammonia concentrations. However, the observed treatment effects for arterial ammonia concentrations were not reflected in arterial concentrations of urea that were relatively low at all times during the day (maximum 2.5 mmol/l urea-N) and not affected by treatment. The largest post-prandial responses in arterial SCFA concentrations were observed for butyrate and propionate, reflecting the large diurnal variation in ruminal concentration as well as the large sensitivity to variation in hepatic extraction for these SCFA. The arterial butyrate concentration peaked above 0.05 mmol/l as a result of the fast increase in net portal absorption of butyrate and the marked reduction in hepatic extraction of butyrate during grass feeding (Figures 2 and 3). The arterial butyrate concentration is high compared with the usual values for dairy cattle (0.012 to 0.025 mmol/l (Reynolds et al., Reference Reynolds, Huntington, Tyrrell and Reynolds1988a; Reynolds and Huntington, Reference Reynolds and Huntington1988) and only in early lactation where cows experience a decreased hepatic extraction of butyrate have there been reported arterial butyrate levels similar to those observed in the present study (0.044 mmol/l; Reynolds et al., Reference Reynolds, Aikman, Lupoli, Humphries and Beever2003). The high bioactivity of butyrate as shown by its ability to inhibit ruminal motility (Crichlow, Reference Crichlow1988) induces insulin secretion (Manns and Boda, Reference Manns and Boda1967) and its general cytotoxic effects on cells in culture (Prasad and Sinha, Reference Prasad and Sinha1976) could point to butyrate as involved in the commonly observed decrease in milk production and milk fat production of cows on spring pasture.
Net portal fluxes
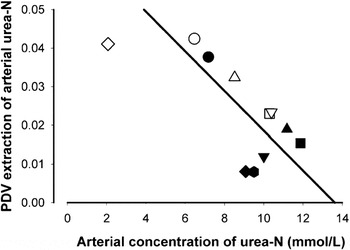
The interaction between sampling time and treatment approached significance for the net portal flux of ammonia. However, the effect was primarily related to small differences in response to supplement feeding in the few first samplings in the morning, where soya-bean hulls were followed by an immediate increase in net portal ammonia flux and barley and no supplement were not. The net portal fluxes of ammonia did not indicate major differences in ammonia absorption during grass feeding in line with the low ruminal ammonia level with all treatments. The blood to lumen flux of urea-N across the PDV accounts for a large fraction of the total recycling of urea-N to the gut (Lapierre and Lobley, Reference Lapierre and Lobley2001). Data from heifers fed variable levels of dietary N indicated that the urea transfer to the gut increased with decreasing N intake when calculated as the blood clearance rate (Marini and Van Amburgh, Reference Marini and Van Amburgh2003). The mechanism by which epithelial urea flux is regulated is unknown at present. However, it has been shown that timing of starch feeding relative to roughage feeding affects the ruminal vein extraction of urea (Rémond et al., Reference Rémond, Nozière and Poncet2002). This points to epithelial blood flow as a possible determinant of urea extraction across PDV tissues, because it is only blood passing the epithelia that supply urea to the gastro-intestinal tract. Presence of urea transporters in numerous mammalian tissues (Sands, Reference Sands2003) including ruminal epithelium (Ritzhaupt et al., Reference Ritzhaupt, Breves, Schröder, Winckler and Shirazi-Beechey1997; Stewart et al., Reference Stewart, Graham, Cattell, Smith, Simmons and Smith2005) offers a possible mechanism for regulation of epithelial permeability to urea; however, it has hitherto not been possible to show up-regulation of urea transporters in ruminal epithelium with decreasing intake of dietary N (Marini et al., Reference Marini, Klein, Sands and Van Amburgh2004). A third possibility to explain the up-regulation of PDV extraction of urea with decreasing N intake is the presence of high-affinity low-capacity transporters that are saturated at low plasma concentrations of urea. The cows in the present study were fed a diet severely deficient in rumen degradable protein and are assumed to have up-regulated the epithelial urea permeability if regulation of epithelial urea permeability is possible in dairy cows. However, despite N deficiency the PDV tissues did not extract more than 4.3% of the arterial supply of urea. Data from previous studies in lactating dairy cows support the fact that the extraction of urea by PDV tissues increases with decreasing N intake as indicated by the correlation (R = −0.69; P = 0.03) between arterial concentration of urea-N and the fractional extraction of arterial urea by the PDV (Figure 4). However, noteworthy is the fact that the very low blood urea-N level obtained in the present study were not translated into higher PDV extraction of urea-N than previously observed in cows fed diets less deficient in rumen degradable protein. Data from Raggio et al. (Reference Raggio, Pacheco, Berthiaume, Lobley, Pellerin, Allard, Dubreuil and Lapierre2004) could indicate that cows up-regulate PDV extraction even when the supply of rumen degradable protein is marginally deficient and there might be little or no further up-regulation of urea recycling when feeding diets more severely deficient in rumen degradable protein.
Portal-drained visceral (PDV) extraction of arterial urea-nitrogen in lactating dairy cows plotted against the arterial concentration of urea-N. Means from the following studies were used to establish the regression line (R 2 = 0.50) closed square (Reynolds et al., Reference Reynolds, Aikman, Lupoli, Humphries and Beever2003); closed triangle up (Benson et al., Reference Benson, Reynolds, Aikman, Lupoli and Beever2002); closed triangle down (Blouin et al., Reference Blouin, Bernier, Reynolds, Lobley, Dubreuil and Lapierre2002); closed diamond (Delgado-Elorduy et al., Reference Delgado-Elorduy, Theurer, Huber, Alio, Lozano, Sadik, Cuneo, De Young, Simas, Santos, Nussio, Nussio, Webb and Tagari2002a); closed hexagon (Delgado-Elorduy et al., Reference Delgado-Elorduy, Theurer, Huber, Alio, Lozano, Sadik, Cuneo, De Young, Simas, Santos, Nussio, Nussio, Webb and Tagari2002b); open square (Casse et al., Reference Casse, Rulquin and Huntington1994); open triangle down (Bach et al., Reference Bach, Huntington, Calsamiglia and Stern2000); open triangle up (Berthiaume et al., Reference Berthiaume, Thivierge, Patton, Dubreuil, Stevenson, McBride and Lapierre2006); closed circle (Reynolds et al., Reference Reynolds, Huntington, Tyrrell and Reynolds1988b); and open circle (Raggio et al., Reference Raggio, Pacheco, Berthiaume, Lobley, Pellerin, Allard, Dubreuil and Lapierre2004). The mean PDV extraction of urea-N observed in the present study is indicated as an open diamond. All data points are presented as means within a study.

For most SCFA (propionate, butyrate, valerate and caproate), diurnal changes in net portal fluxes were observed and for all SCFA except for acetate correlations were observed (P < 0.001) between ruminal SCFA concentrations and the net portal fluxes (r = 0.17, 0.67, 0.42, 0.73, 0.26, 0.61 and 0.86 for acetate, propionate, isobutyrate, butyrate, isovalerate, valerate and caproate, respectively). Stirring the ruminal contents is necessary for transport of solutes to the epithelial surface for absorption (Dobson, Reference Dobson1984) and we hypothesised that the frequency of primary ruminal contractions would represent stirring of the ruminal contents. The simplest possible model was used to describe absorptive concentrations of ruminal SCFA concentrations by multiplying ruminal concentrations of SCFA with the frequency of primary ruminal contractions raised to the power of 0.7. After correction for frequency of ruminal contractions, the calculated correlations were significant for all SCFA and were 0.37, 0.79, 0.62, 0.82, 0.49, 0.79 and 0.90 for acetate, propionate, isobutyrate, butyrate, isovalerate, valerate and caproate, respectively. Further inclusion of ruminal pH or use of ruminal pH as the only factor did not improve the correlation between ruminal SCFA and portal net flux of SCFA. The net portal flux of ammonia was correlated (P < 0.001; R = 0.60) with the ruminal concentration of ammonia, but the correlation was not changed by correcting for frequency of primary ruminal contractions. The generally strong correlations between ruminal concentrations and net portal flux are in agreement with SCFA largely being absorbed by non-ionic diffusion (Gäbel and Aschenbach, Reference Gäbel and Aschenbach2006) and in agreement with the previously observed correlations between the intraruminal productions of the three major SCFA measured by isotopic dilution and their ruminal concentrations (Sutton et al., Reference Sutton, Dhanoa, Morant, France, Napper and Schuller2003). Although the use of primary ruminal contractions improved the correlation between net portal flux and description of ruminal SCFA, this effect need to be interpreted with caution, because ruminal fill and other variables not accounted for could be correlated with the frequency of primary ruminal contractions.
Net hepatic flux and hepatic extraction ratios
The net hepatic flux of urea tended to increase with SBPM in line with the increase in arterial concentration and the increased net portal flux of ammonia. We assume that the ammonia absorption would have been considerably larger with SBPM, i.e. no supplemental carbohydrate before grass feeding if the clover grass had contained more N; however, the low N content of clover grass in the present study prevents a proper evaluation of the potential of strategic carbohydrate feeding to capture grass N in grazing animals. The hepatic oxygen uptake tended to increase after the morning feeding because of increased blood flow and increased hepatic oxygen extraction. The oxygen might partly be used for the increase in gluconeogenesis from propionate after feeding. A remarkable decrease in the hepatic extraction of butyrate and isovalerate was observed after the morning feeding (Figure 3). The sharply increasing butyrate absorption to the portal blood in combination with the depression in hepatic extraction led to an increased net splanchnic flux of butyrate followed by a large increase in the arterial concentration of butyrate (see above). The observed decrease in the hepatic butyrate extraction and the increased valerate extraction with increasing net portal flux of butyrate and valerate, respectively, are in line with previous observations in steers (Kristensen and Harmon, Reference Kristensen and Harmon2004). These data could indicate that management strategies that allow only short intensive grazing periods might induce large ruminal butyrate bursts that challenge the metabolic capacity of the liver and induce butyrate loads on peripheral tissues. The butyrate fermentation following intake of grass with high sugar content might be part of the explanation for the typical decreasing milk production and milk fat production experienced when cows start to graze in the spring. In an experiment with intraruminal infusion of butyrate, Huhtanen et al. (Reference Huhtanen, Miettinen and Ylinen1993) found increasing milk production, however, these authors infused butyrate continuously into the rumen and the cows did not experience the dramatic diurnal changes in peripheral butyrate concentration as in the present study.
Urea-N kinetics
Dietary factors influence the recycling of urea in ruminants (Kennedy et al., Reference Kennedy, Clarke and Milligan1981). One factor is dietary N intake affecting plasma urea concentration that again influences the urea content of saliva (Bailey and Balch, Reference Bailey and Balch1961). However, at low N intakes where the plasma concentration of urea is low, the bulk of the recycled urea is transported directly from blood across gastro-intestinal epithelia (Huntington, Reference Huntington1989). This is in agreement with data from the present study showing that dairy cows fed a diet severely deficient in rumen degradable protein transferred 86% of the total recycled urea by direct transfer across epithelial membranes and only 14% of the total recycled urea via saliva. In the present study, the cows recycled 70% of urea produced in the liver to the gastro-intestinal tract, which is in the upper range of previously reported values (Lapierre and Lobley, Reference Lapierre and Lobley2001). However, this is in good agreement with the low N content of the diet. Nonetheless, it is noteworthy that the estimated renal extraction of urea in the present study was 5.1% (100 × urea-N excretion in urine/(blood urea-N × renal blood flow)) where the renal blood flow was estimated from the steady-state concentration of pAH in blood plasma and correction for haematocrit in blood, renal blood flow = ((pAH infusion rate/plasma pAH concentration)/(1 − (haematocrit/100)). The renal extraction ratio of plasma urea was therefore higher than the PDV extraction ratio (4.3%, see above) despite the fact that the cows were severely undersupplied with rumen degradable protein. This suggests an inability of the cows to further decrease renal urea extraction and limits the potential utilisation of urea by recycling to the gut. Another limitation to N efficiency is the urinary excretion of non-urea-N. In this study, urea-N accounted for only 32% of the total N excretion in urine, and at low levels of dietary N intake, excretion of N-containing metabolites other than urea will affect the overall N efficiency of the cow more than at high N intake. Urine from cattle contains, in addition to urea-N, variable amounts of N in purine derivatives, hippuric acid (glycine conjugate of benzoic acid), creatine/creatinine, free amino acids and ammonia (Bristow et al., Reference Bristow, Whitehead and Cockburn1992). Factors such as benzoic acid intake, ruminal bypass protein and intestinal absorption of purines will therefore be of importance to further increase the N efficiency of dairy cows following reduction in intake of rumen degradable protein.
Conclusions
Spring clover grass fed in a zero-grazing experiment induced high ruminal butyrate concentrations, high portal butyrate uptake, a reduced hepatic butyrate extraction and large variation in peripheral blood concentrations of butyrate during the day. The butyrate load of the cows might partly explain the underperformance of cows on pasture during the spring. The spring grass had low N content, and the cows were undersupplied with rumen degradable protein. The cows were capable of transferring 70% of the hepatic urea production to the gastro-intestinal tract, and the urinary urea-N excretion accounted for only 8% of N intake. The cows in the present study were not able to extract more urea form the blood passing the PDV than previously observed in cows fed diets only moderately deficient in rumen degradable protein. Better understanding of the mechanism involved in the regulation of urea-N recycling and factors affecting urinary excretion of both urea- and non-urea-N will be of importance to improve N utilisation in dairy cattle.
Acknowledgements
We gratefully acknowledge Hans Christian Christiansen, Janne Adamsen and Anne-Mette Edith Olsen for skilful technical assistance and the staff of the intensive care unit at the Faculty of Agricultural Sciences for taking care of the cows. We also thank Anne Sievers, DVM, PhD, Christian Albrechts University, Germany for assistance in measuring ruminal motility. Funding for the present study was provided by the Directorate for Food, Fisheries and Agri Business (no. 3304-VMP-05-005-01) and the Faculty of Agricultural Sciences, University of Aarhus.