Type 2 diabetes is the main cause of end-stage renal disease (ESRD) in Germany and the United States (Reference Frei and Schober-Halstenberg15;52). Diabetic nephropathy leads to a gradual decline of the renal function and is initially characterized by micro- or macroalbuminuria. Diabetic nephropathy may progress to ESRD. In Germany, the cost of ESRD treatment is approximately €40,000 per patient year (Reference Frei and Schober-Halstenberg15;27;Reference Nebel35;44;45). Hence, prevention of ESRD is also important from an economic viewpoint.
Angiotensin-converting enzyme (ACE) inhibitors slow down the progression of diabetic nephropathy independent of an elevated blood pressure (Reference Ahmad, Siddiqui and Ahmad1;Reference Lewis, Hunsicker and Bain31). Angiotensin II receptor blockers (ARBs) have similar effects on renal outcomes in diabetic patients (Reference Barnett, Bain and Bouter3), but are more expensive. Evidence suggests that the only major clinical difference between these classes of drugs is a higher risk of dry cough associated with ACE inhibitors (Reference Matchar, McCrory and Orlando33).
Several clinical practice guidelines recommend starting ACE inhibitor therapy in diabetic patients with (micro)albuminuria (21;Reference Hasslacher, Gandjour, Scherbaum, Lauterbach and Renner22). However, physician compliance in Germany is rather low (Reference Gandjour, Kleinschmit and Lauterbach16;Reference Steines, Piehlmeier and Schenkirsch47). Cost-effectiveness models conducted in the United States by Golan et al. (Reference Golan, Birkmeyer and Welch19) and Rosen et al. (Reference Rosen, Hamel and Weinstein39) suggest that the best starting point is immediately after diagnosis of diabetes. However, results may not be transferable to the German setting, particularly due to differences in prices. Furthermore, the model by Golan et al. (Reference Golan, Birkmeyer and Welch19) was criticized for presenting limited evidence on the transitions between the different renal disease stages (Reference Cook and Guyatt13) (this criticism equally applies to Rosen et al.) (Reference Rosen, Hamel and Weinstein39). Moreover, both models do not consider that 9.9 percent of patients develop cough as a side effect of ACE-inhibitor therapy (Reference Matchar, McCrory and Orlando33) and thus are eligible for more expensive ARB therapy as a well-tolerated alternative (Reference Matchar, McCrory and Orlando33).
The goal of this study was to present a cost-effectiveness model which determines the best time to start an ACE inhibitor in newly diagnosed patients with type 2 diabetes and without hypertension or heart failure in Germany. The analysis was conducted from the perspective of the German statutory health insurance (SHI), which covers approximately 90 percent of the German population. In our model, we included ARBs as an alternative for patients who experience ACE-inhibitor-induced cough. In the base case, we used 50 years as the age of diagnosing type 2 diabetes (Reference Koopman, Mainous and Diaz29;51). In contrast to Golan et al. (Reference Golan, Birkmeyer and Welch19) and Rosen et al. (Reference Rosen, Hamel and Weinstein39), we considered broader evidence for the transition between the different renal disease stages, based on two Cochrane reviews (Reference Strippoli, Bonifati and Craig48;Reference Strippoli, Craig and Craig49).
METHODS
Overview and Model Design
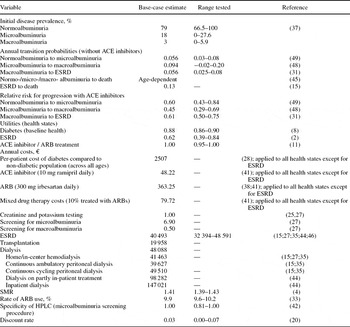
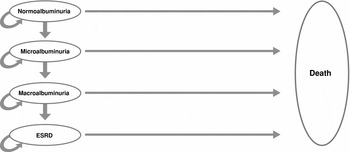
We conducted a cost-utility analysis and measured health outcomes in terms of quality-adjusted life-years (QALYs). We developed a Markov model to simulate the course of a cohort of 1,000 patients at the age of 50 years as it progresses to microalbuminuria, macroalbuminuria, ESRD, and death. A Markov model is an iterative process where patients are assumed to stay in one cycle (i.e., a defined health state) for a certain time and then make a transition to another cycle. Markov models are useful when a decision problem involves risk that is continuous over time, when the timing of events is important, and when important events may happen more than once. We chose a cycle length of 1 year for the health states defined by the Markov model because all transition probabilities gathered from the literature referred to a duration of at least 1 year (see Table 1). Our Markov model contains the following five health states (Figure 1), which represent the occurrence of events after model entry: (i) type 2 diabetes, with normoalbuminuria (excretion <30 mg/d); (ii) type 2 diabetes, with microalbuminuria (excretion 30–300 mg/d); (iii) type 2 diabetes, with macroalbuminuria (excretion >300 mg/d); (iv) ESRD (treated with dialysis or renal transplantation); (v) death.
Data Used to Determine the Cost-effectiveness of ACE Inhibitors (ARBs) in Newly Diagnosed Type 2 Diabetes

ACE = angiotensin-converting enzyme; ARB = angiotensin II receptor blocker: ESRD = end-stage renal disease; SMR = standardized mortality ratio; HPLC = high performance liquid chromatography.
Schematic representation of the Markov decision model.

We assumed that diabetic nephropathy progresses without skipping any stage. Furthermore, patients may transit to death at any time. During each cycle, patients accumulate utility (measured by QALYs) and costs. A half-cycle correction was applied to both costs and outcomes to allow for transition events occurring mid-way through each 12-month cycle.
The simulation was done until the age of 100. Hence, the time horizon is 50 years. The age of 100 was chosen as a cutting point as there are no mortality data available beyond this age. Regardless, 99.4 percent of patients in the simulation are dead at this age.
Clinical Strategies
Three starting points for ACE inhibitors were considered (Reference Golan, Birkmeyer and Welch19;Reference Rosen, Hamel and Weinstein39). In the “screen for microalbuminuria” strategy, patients are screened for microalbuminuria once a year and treatment is started if the test result is positive. In the “screen for macroalbuminuria” strategy, patients are screened for macroalbuminuria once a year and treatment is also started if the test result is positive. In the “treat all” strategy, no screening is performed at all and patients start on ACE inhibitor therapy at the time of diagnosing type 2 diabetes. The states of albuminuria were defined according to the recommendations of the American diabetes Association (21). In addition, we considered a no-screening and no-treatment alternative representing the status quo. To find information on the distribution of health states at the time of diagnosis, we used the following search strategy in PubMed (1966–2007): (newly diagnosed[All Fields]) AND macroalbuminuria[All Fields] AND microalbuminuria[All Fields] AND prevalence[All Fields] AND (albumin excretion [All Fields]) NOT (type 1 diabetes [All Fields]). We found two studies. One study was excluded because it was conducted among Pima Indians. The other one is a Finnish prospective observational study (Reference Niskanen, Penttila and Parviainen37) which was conducted from 1982 to 1992. In this study, the distribution of health states at the time of diagnosis (average age: 58 years) was as follows: 79 percent normoalbuminuria, 18 percent microalbuminuria, and 3 percent macroalbuminuria. We tested the impact of the distribution on results in a sensitivity analysis.
Transition Probabilities
To identify studies on the effectiveness of ACE inhibitor or ARB therapy on the prevention of diabetic kidney disease, we searched in the Cochrane Database of Systematic Reviews using the search strategy normoalbuminuria OR microalbuminuria OR macroalbuminuria. We found two meta-analyses proving evidence that ACE inhibitors halt the transition from normo- to microalbuminuria and micro- to macroalbuminuria (Reference Strippoli, Bonifati and Craig48;Reference Strippoli, Craig and Craig49). These meta-analyses pooled studies on patients with type 1 and type 2 diabetes, as heterogeneity did not appear to be significant. Compared with placebo, ACE inhibitors significantly reduced the development of microalbuminuria (six trials, 3840 patients; relative risk [RR] = 0.60; 95 percent confidence interval [CI], 0.43–0.84), and the progression from microalbuminuria to macroalbuminuria (17 trials, 2036 patients; RR = 0.45; 95 percent CI, 0.29–0.69).
To identify studies on the effectiveness of ACE inhibitors or ARBs on the transition from macroalbuminuria to ESRD, we checked evidence-based clinical practice guidelines on the prevention of diabetic nephropathy (Reference Hasslacher, Gandjour, Scherbaum, Lauterbach and Renner22;Reference McIntosh, Hutchinson and Marshall34;53). We found one randomized clinical trial (Reference Lewis, Hunsicker and Bain31) which was rated as a well-designed randomized controlled trial (Reference Hasslacher, Gandjour, Scherbaum, Lauterbach and Renner22;53), providing high grade evidence. In this trial, captopril significantly reduced the development of ESRD compared with placebo (409 patients; RR = 0.61; 95 percent CI, 0.50–0.75).
All input parameters including transition probabilities and the effectiveness of ACE inhibitor therapy are shown in Table 1. To determine annual transition probabilities, we first calculated a total probability for each arm, by dividing the number of events (ESRD) during the trial period by the number of patients. Next, we determined annual transition probabilities by assuming a constant annual hazard rate over the study time horizon (Reference Kuntz, Weinstein, Drummond and McGuire30). A constant hazard rate yields an exponential survival curve.
In patients with normo-, micro-, and macroalbuminuria, mortality is a function of age and was calculated by multiplying age-specific mortality rates of the general population with a standardized mortality ratio for patients with diabetes compared with the general population (Reference Bertoni, Krop and Anderson4;Reference Lewis, Hunsicker and Clarke32). For patients with normo-, micro-, and macroalbuminuria, we assumed that mortality is stage-independent as there are no valid data showing that a significant difference exists. For ESRD patients, we calculated the annual mortality rate based on 87,151 patients in Germany (Reference Frei and Schober-Halstenberg15), by dividing the annual number of decedents by the total number of pat ients.
Preference Weights
We took preference weights of diabetic patients (Table 1) from a published cross-sectional study (Reference Briggs, Ades and Price7). Adult diabetic patients (n = 292) with a disease duration of at least 1 year and a mean age of 62 years (range, 21–85 years) were interviewed by the time trade-off (TTO) method. We assumed that patients with normo-, micro-, or macroalbuminuria do not suffer from an additional reduction in health-related quality of life (Reference Brown, Brown and Sharma8). The preference weight for ESRD was taken from a systematic review of empirical studies in which TTO weights were provided by patients (Reference Arnesen and Trommald2). The TTO is the most commonly used method to elicit quality-of-life weights for QALYs (Reference Bleichrodt and Johannesson5;Reference Dolan, Gudex and Kind14).
Costs
Given the perspective of the German SHI, only direct costs relevant to the SHI were considered. Furthermore, a portion of drug expenditures needs to be paid out of pocket. Costs were inflated to year 2006 Euros using data on the consumer price index (46). Costs of ACE inhibitors, ARBs, annual screening procedures, and treatment for ESRD as well as healthcare expenditures related and unrelated to diabetes were taken into account. For ACE inhibitor therapy, we used a daily dose of 10 mg of the most frequently prescribed ACE inhibitor, which is ramipril (Reference Glaeske and Jahnsen18). In particular, we used the cheapest generic version of ramipril (41). A daily dose of 10 mg is at the high end of the therapeutic range (23;Reference Kasiske, Kalil and Ma26;50). In a sensitivity analysis, we applied the reference price of ramipril. For ARBs, we applied 300 mg irbesartan daily (41), which is more effective in renal protection than a dose of 150 mg (Reference Parving, Lehnert and Brochner-Mortensen38). As irbesartan is not a generic drug and still protected by patent, patients have to pay €37.24 per year out of pocket (Reference Braun, Prenzler and Mittendorf6). In addition, we included costs for biannual monitoring of serum creatinine and potassium levels due to ACE inhibitor or ARB therapy (25;27). For microalbuminuria screening, we preferred a quantitative screening test (high performance liquid chromatography) over a semiquantitative one (e.g., Micral-Test®) (Reference Comper, Osicka and Jerums12) because it has a higher sensitivity (100 percent) (Reference Comper, Osicka and Jerums12) and specificity (81–98 percent) (Reference Scheid, McCarthy and Lawler42) and is also recommended by a recently published health technology assessment report (Reference Schroeder, Heiderhoff and Koebberling43). In the base-case analysis, we assumed a specificity of 100 percent, which is conservative because treating false positives (i.e., patients with normoalbuminuria) leads to cost savings. In the sensitivity analysis, we applied a specificity of 81 percent (Reference Scheid, McCarthy and Lawler42). To screen for macroalbuminuria, we used a dipstick test applied in a primary care physician's office (Reference Schroeder, Heiderhoff and Koebberling43). For patients without renal failure, we included age-specific healthcare expenditures unrelated to diabetes (9) as well as healthcare expenditures related to diabetes as an average across all ages (Reference Koester, von Ferber and Ihle28). We validated the use of average-expenditure data against the use of age-specific expenditures data in patients diagnosed at the age of 60 years (these age-specific data were not available below the age of 60 years). We also assessed whether explicitly modeling the costs of survivors and decedents (as opposed to using average-cost data) changes the cost-effectiveness of ACE inhibitors. This approach accounts for the fact that the high costs of those who die dominate age-specific costs. Hence, when the last year of life is postponed, average age-specific costs fall. Age-related expenditure data of diabetic patients were available from a large German statutory health insurer (unpublished data).
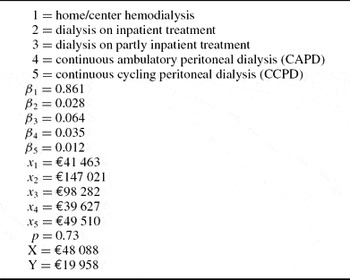
Annual costs of patients with ESRD were calculated as a weighted average of the costs of patients with different types of dialysis as well as renal transplantation (Reference Nebel35) and include costs unrelated to dialysis and renal transplantation. In detail, the following calculations were made: (i) cost of dialysis = β 1x 1 + β 2x 2 + β 3x 3 + β 4x 4 + β 5x 5 = X, where x n = annual cost of dialysis treatment n = 1,2, . . . ., 5, β n = prevalence weight of the dialysis treatment, and β 1 + β 2 + β 3 + β 4 + β 5 = 1. (ii) cost of ESRD = pX + (1 – p)Y, where Y = cost of renal transplantation and p = proportion of ESRDs treated by dialysis treatment.
Prevalence data (Reference Frei and Schober-Halstenberg15;44) served as weights. Data on the cost of continuous ambulatory peritoneal dialysis and continuous cycling peritoneal dialysis were obtained from an empirical survey by Nebel (Reference Nebel35). To determine the cost of home/in-center hemodialysis, we used the German fee schedule “Uniform value scale” (27) to calculate costs of the dialysis itself and the survey by Nebel (Reference Nebel35) to determine all other expenditures for dialysis patients. Healthcare expenditures related and unrelated to diabetes were both included. See Table 2 for parameters used in the analysis.
Parameters Used for Calculating the Cost of End-Stage Renal Disease (See Cost Section Under “Methods”)

Costs and benefits were discounted at an annual rate of 3 percent (Reference Gold, Siegel and Russell20).
Sensitivity Analysis
To address uncertainty around mean incremental costs and effectiveness, we conducted univariate sensitivity analyses. Whenever possible, we ran the analysis using the upper and lower bound of the 95 percent CI of the mean. For the annual cost of ESRD, we did not have information on the 95 percent CI and thus varied costs by 20 percent (see Table 1 for uncertainty ranges).
To assess how a simultaneous change of several variables affects the incremental cost-effectiveness ratio (ICER), we performed a Monte Carlo simulation, a type of multivariate sensitivity analysis. This technique runs a large number of simulations (here: 1000) by repeatedly drawing samples from probability distributions of input variables. Thus, it provides a probability distribution for the output variables, that is, incremental costs and effectiveness. Probabilities and relative risks were assumed to follow a beta distribution Beta (α, β) because they are restricted to take on values between 0 and 1. Because the distribution of health states at the time of diagnosis had more than two outcomes, we assumed a Dirichlet distribution Dirichlet (α1, α2, . . ., αk) (Reference Briggs, Ades and Price7). Cost data were assumed to follow a gamma distribution Gamma (a, b) because they are normally distributed but restricted to take on values between 0 and 1. The standard deviation of probabilities and relative risks was calculated according to the following formula (Reference John, Whitaker and Johnson24):

Given the ambiguous interpretation of negative ICERs, we transformed ICERs into net monetary benefits (NMBs). We generated a cost-effectiveness acceptability curve based on the distribution of NMBs for each value of the willingness to pay per QALY gained. A cost-effectiveness acceptability curve allows a decision maker to consider whether a prevention strategy is cost-effective in relation to the maximum amount a decision maker is willing to pay for a QALY. At each ceiling value for the willingness to pay for a QALY, the cost-effectiveness acceptability curve shows the probability that treatment is cost-effective.
RESULTS
Base-Case Analysis
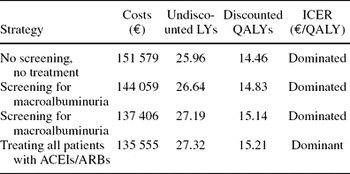
The base-case analysis, which applies to 50-year-old patients, shows that “no screening and treatment,” “screening for macroalbuminuria,” and “screening for microalbuminuria” are all dominated by the “treat all” strategy, which is associated with the lowest costs and highest benefit (Table 3). Treating all patients with ACE inhibitors at the age of 60 years also leads to savings. Comparing the use of average-expenditure data with age-specific expenditure data and separate expenditure data for survivors and decedents yields little difference in cost savings compared with screening for microalbuminuria (−€1,852, −€1,875, and −€1,982, respectively).
Results of the Base-Case Analysis

ACEI = angiotensin-converting enzyme inhibitor; ARB = angiotensin II receptor blocker; LYs = life-years; QALY = quality-adjusted life-years; ICER = incremental cost-effectiveness ratio.
Sensitivity Analysis
In the univariate sensitivity analysis, variables with the largest impact on incremental costs and effectiveness are the discount rate, the absolute risk for progression from micro- to macroalbuminuria without ACE inhibition as well as the relative risk for progression from normo- to microalbuminuria with ACE inhibitor therapy (Supplementary Table 1, which is available online at www.journals.cambridge.org/thc2010005). When assuming a low progression rate from micro- to macroalbuminuria without ACE inhibition, screening for microalbuminuria dominates the treat-all strategy. A threshold sensitivity analysis shows that at an annual drug cost of €309.40 (base case: €75.72) the breakeven point is reached.
Changing the distribution of health states at the time of diagnosis to all patients being normoalbuminuric yields little difference in cost savings (−€2 344 versus −€1 852) and QALYs gained (0.10 versus 0.08).
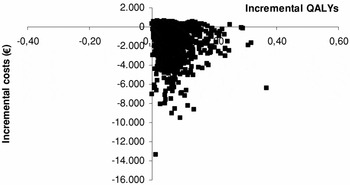
Supplementary Figure 1, which is available online at www.journals.cambridge.org/thc2010005 shows the cost-effectiveness acceptability curve, which considers uncertainty in cost-effectiveness. The probability of savings of the “treat all” strategy compared with screening for microalbuminuria is 89 percent (see also Figure 2 for the scatterplot).
Cost-effectiveness plane showing 1,000 replications from a distribution of cost and quality-adjusted life-year (QALY) differences (angiotensin-converting enzyme inhibitor versus microalbuminuria screening).

DISCUSSION
This modeling study shows that treating all patients with type 2 diabetes with ACE inhibitors (and more expensive ARBs in the event of cough) immediately after diagnosis is cost-effective and even reduces healthcare expenditures. Our results were robust to a variety of different assumptions of uncertainty. Although a significant number of newly diagnosed type 2 patients may receive blood pressure medications, it has not been shown that these patients are primarily prescribed an ACE inhibitor, which underlines the significance of this analysis.
Our model is far from being perfect, but in modeling studies, this is rarely the case due to constraints of resources, time, and information availability. Savings by treating all diabetic patients with ACE inhibitors may be even underestimated for several reasons. First, we did not model that ACE inhibitors and ARBs reduce the risk for cardiovascular events (23), which leads to additional savings. Second, we did not consider that some patients discontinue ACE inhibitor therapy and thus incur no drug costs. The reason is that information on compliance was unavailable from the trials on ACE inhibitors. On the other hand, the rate of compliance is incorporated in the effectiveness data (thus reducing effectiveness). Third, patients may also be sufficiently treated by a smaller dose of ramipril than in our analysis. We used a dose of 10 mg, which is at the high end of the therapeutic range in studies investigating the effect of ACE inhibitors on renal outcomes (23;Reference Kasiske, Kalil and Ma26;50). Fourth, for patients who receive dialysis on an inpatient basis (2 percent of all patients with renal replacement therapy), we were not able to consider healthcare costs unrelated to dialysis due to a lack of available data. This underestimates the savings from preventing ESRD. Fifth, costs of dialysis treatment will likely continue to rise in the future, thus increasing the potential for savings by preventing ESRD. In the past 10 years, dialysis costs have increased by approximately 25 percent (27;Reference Nebel35;Reference Neubauer, Breu and Pommer36;46) and we expect this trend to continue due to stricter regulations concerning dialysis safety, technological advancement of dialysis machines, and better-tolerated dialysis solutions. Alleviating this trend may be lower prices of erythropoietin and lower reimbursement of physicians. Finally, we calculated annual transition rates based on trial duration instead of follow-up time as data concerning follow-up time were unavailable for most trials. As follow-up time is generally shorter than trial duration this might have underestimated transition probabilities as well as cost savings.
Further limitations of the model relate to the data sources. First, when calculating the weighted average cost of treating ESRD, we used prevalence data on intermittent and automated peritoneal dialysis (IPD/APD) to weigh the cost of continuous cycling peritoneal dialysis (CCPD). Second, the model uses some epidemiological data from Western countries other than Germany. For example, we used a Finnish study (Reference Niskanen, Penttila and Parviainen37) as the source of the distribution of health states at the time of diagnosis. However, changing the initial distribution of health states had little impact on the results. Third, transition rates from macroalbuminuria to ESRD with and without ACE inhibitors were not available for patients with type 2 diabetes. Therefore, we used a randomized controlled trial in patients with type 1 diabetes as the source (Reference Lewis, Hunsicker and Bain31). Fourth, the standardized mortality ratio (SMR) we applied to diabetic patients without ESRD (Reference Bertoni, Krop and Anderson4) includes patients with ESRD. Excluding these patients would lower the SMR, but only to a minor degree, as less than 1 percent of the German diabetic population receives renal replacement therapy (Reference Frei and Schober-Halstenberg15;Reference Giani, Janka, Hauner, Scherbaum and Kiess17). Fifth, we assumed that the SMR is the same for patients with normo-, micro-, and macroalbuminuria as there are no valid data showing that a significant difference exists. The slightly higher mortality ratio in microalbuminuric patients in the HOPE study (23) was most likely the result of prior cardiovascular events. There is no evidence in the literature that mortality rates increase only on the basis of the level of albumin in the urine. Sixth, having microalbuminuria or macroalbuminuria might cause disutility from anxiety. However, standard preference measures such as the standard gamble method or the TTO method are not able to capture anxiety over future events as both evaluation methods assume a constant (!) health state over the remaining period of life. Seventh, the definition of hypertension was not consistent in the studies we incorporated in our model. Cutoff values varied between 130/80 and 160/90 mm Hg. Finally, it is unclear whether a societal perspective leads to larger or smaller savings than a SHI perspective: on the one hand, ACE inhibitors and ARBs avoid productivity loss and copayments due to renal failure. On the other hand, drug copayments lead to additional costs.
Compared with previous cost-effectiveness models, which were conducted by Golan et al. (Reference Golan, Birkmeyer and Welch19) and Rosen et al. (Reference Rosen, Hamel and Weinstein39) based on U.S. data, we considered a much broader evidence base for the transition between normo- to microalbuminuria and micro- to macroalbuminuria. In addition, we considered that patients who are noncompliant with ACE inhibitors due to cough may receive more expensive ARBs. We did not consider that a small proportion of patients on ARBs (3.2 percent) also develop cough (Reference Matchar, McCrory and Orlando33) and thus may discontinue treatment. The reason is that noncompliance with treatment is already incorporated in the relative risk of treatment (thus lowering the relative risk), as in randomized clinical trials a certain proportion of patients discontinued treatment. We assumed equal effectiveness of all ACE inhibitors and ARBs, as meta-analyses do not suggest any independent effect of single renin-angiotensin-system agents (Reference Casas, Chua and Loukogeorgakis10;Reference Strippoli, Bonifati and Craig48). Still, similar to the model by Rosen et al. (Reference Rosen, Hamel and Weinstein39), our model shows that treating all newly diagnosed type 2 patients with ACE inhibitors saves costs. In contrast to Rosen et al., we did not consider the preventive effect of ACE inhibitors on cardiovascular outcomes, which would have increased savings. An important reason for the large savings potential in Germany is the low price of ramipril, which has significantly gone down during the past few years (40;41). ARBs are still protected by patent for a few additional years. Irbesartan, which we included in our study, is protected until March 2012. Assuming that prices of ARBs will decline after expiration of the patent protection would further strengthen our conclusion.
POLICY CONSIDERATIONS
We recommend that all patients with type 2 diabetes covered by the SHI receive an ACE inhibitor at the higher end of the therapeutic dose range immediately after diagnosis. In case of cough, patients should be prescribed an ARB. This is a major step from current practice, which is not to screen for microalbuminuria. Finally, the transferability of the conclusion of this study to other countries is limited given differences in costs, clinical management, and epidemiology (e.g., with regard to the incidence of unrelated diseases).
SUPPLEMENTARY MATERIALS
Supplementary Table 1
Supplementary Figure 1 www.journals.cambridge.org/thc2010005
CONTACT INFORMATION
Charles Christian Adarkwah, MD (adarkwah@gmx.de; cadarkwah@ukaachen.de), Institute of Health Economics and Clinical Epidemiology, University of Cologne, Cologne, Germany, Gleuelerstr. 176–178, 50935 Cologne, Germany; Postdoctoral Research Fellow, Department of Medicine III, RWTH-University Hospital Aachen, Pauwelsstr. 30, 52074 Aachen, Germany
Afschin Gandjour, MD, PhD, MA (Afschin.Gandjour@pbrc.edu), Associate Professor of Health Economics, Pennington Biomedical Research Center/Louisiana State University, 6400 Perkins Road, Suite G3047, Baton Rouge, Louisiana 70808; The James A. Baker III Institute for Public Policy, Rice University, MS-40, P. O. Box 1892, Houston, Texas 77251–1892; Institute of Health Economics and Clinical Epidemiology, University of Cologne, Cologne, Germany, Gleuelerstr. 176–178, 50935 Cologne, Germany