Introduction
Muysken (Reference Muysken2013) recently proposed a unified framework for the explanation of language-contact phenomena across different domains such as code-switching, Pidgin and Creole languages, convergence phenomena, and the interaction of languages in bilingual individuals. In this framework, Muysken spells out the influence of linguistic and sociolinguistic factors on the choice of four types of “bilingual optimization strategies”: an L1-type (“maximize structural coherence of the first language”), an L2-type (“maximize structural coherence of the second language”), an L1/L2-type (“match between L1 and L2 patterns where possible”), and a UP-type (“rely on universal principles of language processing”). According to Muysken (Reference Muysken2013, his Figure 4), the L1-type is favored by L1 prestige, low L2 proficiency, and limited access to L2 speakers. Conversely, the L2-type is favored by L2 prestige, high L2 proficiency, and large numbers of L2 speakers. The L1/L2-type is favored by lexical similarity, typological similarity, and low normativity, and the UP-type by political distance, lexical/typological distance, and a short contact period. Both, L1/L2 and UP are favored in cases where the languages are equally dominant.
If Muysken's framework is interpreted as a theory from which predictions about contact-induced changes can be derived, it should be testable with novel data on contact-induced language changes. It is far from trivial, however, how such a test should be conducted. One difficulty concerns potential interactions between the different factors. What exactly is predicted, when two languages are typologically similar (favoring L1/L2-type), speakers are of low proficiency (favoring L1-type), there are many speakers of the dominant language (favoring L2-type), and there is a short contact period (favoring UP-type)? Another difficulty lies in the vagueness of some of the notions involved. What, for example, counts as lexical similarity? Are only cognates similar or also words that are highly translation equivalent? At present, the best answer probably is that these issues are not yet clear but could be clarified with more data on contact situations where some of these factors are constant and others vary, so that the relative impact of the latter can be evaluated. The study we report here is of this kind. We investigated contact-induced changes in two groups of Turkish–Dutch bilingual speakers. Both bilingual groups shared the linguistic relationship between the languages (typologically different, few cognates) and the contact situation (immigrants in a country with the majority language Dutch). They differed with respect to their age of arrival in the Netherlands, language proficiency, and the perceived importance of the two languages.
Our domain of investigation was the use of spatial expressions in descriptions of static topological relationships. This domain is of particular interest for several reasons. Firstly, spatial expressions reflect the typological distance between Turkish and Dutch in line with other syntactic and morphological properties of the two languages, such as main clause word order (Turkish SOV, Dutch SVO), use of subject pronouns (Turkish pro-drop, Dutch non pro-drop), and morphology (Turkish agglutinative, Dutch inflectional). In Dutch, spatial relationships are expressed with prepositions, such as in, on, under as in (1).
-
(1) op de tafel
on the table
In Turkish, static spatial relationships are expressed with spatial nominals following the noun referring to the ground object as in (2) or with a locative case suffix –DAFootnote 1 on the noun referring to the ground object as in (3).
-
(2) masa-nın üst-ün-de Footnote 2
table-GEN top-POSS.3SG-LOC
on the table
-
(3) masa-da
table-LOC
in some (canonical) spatial relationship to the table
In terms of Muysken's (Reference Muysken2013) similarity factor, the linguistic relationship between the Turkish and the Dutch constructions can thus unambiguously be characterized as typologically distant.
A second reason to investigate spatial descriptions is the lack of data on contact-related changes in this domain. Studies on contact-induced changes have largely focused on grammatical phenomena and the same holds for studies on immigrant Turkish (cf. Boeschoten, Reference Boeschoten and Mattheier2000; Doğruöz, Reference Doğruöz2007; Keim & Cindark, Reference Keim, Cindark and Neuland2003; Rehbein, Herkenrath & Karakoç, Reference Rehbein, Herkenrath and Karakoç2009; Roberts, Gullberg & Indefrey, Reference Roberts, Gullberg and Indefrey2008; Schaufeli, Reference Schaufeli, Fase, Jaspaert and Kroon1992; Treffers-Daller, Reference Treffers-Daller2005). Also Muysken (Reference Muysken2013) mainly considered contact-induced grammatical change, so that testing predictions derived from his framework in a novel domain will be informative with respect to the strength and generalizability of his theory.
Finally, we considered spatial descriptions to be of particular interest, because in this domain conceptual representations can be relatively well assessed by studying the extensions of spatial expressions across a range of possible topological relations. In principle it is, therefore, possible to assess in which way potential changes in the use of spatial expressions are related to changes in the way topological relations are conceptualized. More specifically, we wanted to know whether the preferred uses of TRMs in the bilingual groups fall outside of the monolingual extensions or are marginal but possible uses for monolinguals. Whereas in the former case one would have to assume that the conceptual representations of spatial expressions differ between bilinguals and monolinguals, no – or at least much more subtle –conceptual changes would have to be assumed in the latter case.
In a recent corpus study, Doğruöz and Backus (Reference Doğruöz and Backus2009) analyzed a range of unconventional constructions in immigrant Turkish in the Netherlands and concluded that there is little evidence for violations of Turkish syntax and that the main source of unconventionality seems to be the translation of “lexically complex individual units into Turkish”. The authors emphasize that the perceived semantic equivalence between Dutch and Turkish units is important for such translations to occur. The results of Doğruöz and Backus (Reference Doğruöz and Backus2009) suggest that translation equivalence could also play a role for possible contact-induced changes in the use of spatial expressions. We therefore planned our study such that we could assess the extensions of both Dutch and Turkish TRMs, and hence their degrees of translation equivalence, in monolingual speakers and use that information to test whether translation equivalence affected the use of TRMs by bilingual speakers.
Predictions
All of Muysken's (Reference Muysken2013) conditions for an L2-type of bilingual optimization strategy (L2 prestige, high L2 proficiency, and large numbers of L2 speakers) held for our Dutch-dominant bilingual group. In this group, we therefore predicted asymmetric contact-induced changes with the Dutch use of spatial expressions influencing the Turkish use. More specifically we expected a higher congruence between translation-equivalent Turkish and Dutch TRM pairs due to the Turkish TRMs being used for topological relations they would typically not be used for by monolingual Turkish speakers. By ‘congruence’ we mean the proportion of the common extension of a Dutch and a Turkish TRM relative to the overall extensions of the two TRMs. Notice that congruence defined in this way is different from the notion of convergence, which usually indicates the shift of a bilingual's two languages towards each other, thereby increasing their similarity wherever possible (e.g., Ameel, Malt, Storms & Van Assche, Reference Ameel, Malt, Storms and Van Assche2009; Backus, Reference Backus2004; Bullock & Toribio, Reference Bullock and Toribio2004; Clyne, Reference Clyne2003; Pavlenko, Reference Pavlenko and Pavlenko2009). The term convergence sometimes refers to the end product of this shift, sometimes to the process or the mechanism bringing it about. There is no agreement in the field on this. Moreover, different types of convergence can be identified, for example a resulting reduced (often labelled ‘simplified’) system where distinctions are lost in one language; a richer cumulative system where distinctions are introduced; or a redistributed system, where the frequency of structures found in one language may shift under the influence of the other (Alferink, Reference Alferink2015; Alferink & Gullberg, Reference Alferink and Gullberg2014). Further, although convergence is clearly a manifestation of crosslinguistic influence, the directionality and overt-covert status of the effects will depend on complex interactions between linguistic domain considered, the types of bilinguals examined and their patterns of language use, dominance, etc. (cf. Alferink, Reference Alferink2015; Alferink & Gullberg, under review-b; Treffers-Daller & Mougeon, Reference Treffers-Daller and Mougeon2005). Increased congruence as used in this paper should be viewed as the result of convergence.
For the Turkish-dominant bilingual group the predictions were not so straightforward. Whereas the contact situation with large numbers of L2 speakers was the same for this group, our questionnaire data (see below) showed that both languages had equal prestige and L2 proficiency was still high but lower than in the Dutch-dominant group. This group, therefore, might still show the L2-type of optimization strategy or one of the two types (L1/L2 and UP) that the framework predicts to be favored in cases where the languages are equally dominant. In the latter case, a UP-type seemed more likely based on the typological distance between the languages. Although it is not obvious what would be a ‘universal’ strategy in the domain of spatial expressions, the use of the Turkish locative case might be a case in point. Levinson & Meira (Reference Levinson and Meira2003) hypothesize (in analogy to the diachronic development of color terms) that a general locative marker may constitute the initial universal TRM, from which more specific TRMs are subsequently fractionated out. Following their hypothesis we expected Turkish-dominant bilinguals to increase the use of locative case on ground objects compared to monolingual speakers.
Methods
Participants
Four groups with a total of 60 adults participated in the study. The first two groups consisted of native speakers of Turkish (‘Turkish monolinguals’, Group TM, n = 15) and Dutch (‘Dutch monolinguals’, Group DM, n = 15) who did not speak Dutch or Turkish as a second language. The participants of two further groups were Turkish–Dutch bilingual speakers. Participants of Group TM were tested in Antalya, Turkey. All other participants were tested in Nijmegen, The Netherlands. All participants were paid a small fee for their participation.
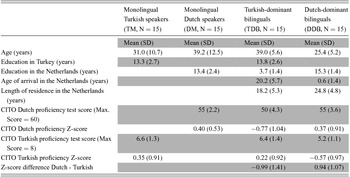
For the group of Turkish-dominant bilinguals (TDB) we recruited participants who had arrived in the Netherlands as adolescents or young adults. For the group of Dutch-dominant bilinguals (DDB) we recruited participants who were born in the Netherlands or had arrived before the age of 4. Table 1 shows details of age, education, language exposure, and proficiency for all groups. Please note that our labels ‘monolingual’ and ‘bilingual’ only refer to the languages Dutch and Turkish. Participants of all groups had learned at least English as a second or third language at school.
Characteristics of the four participant groups

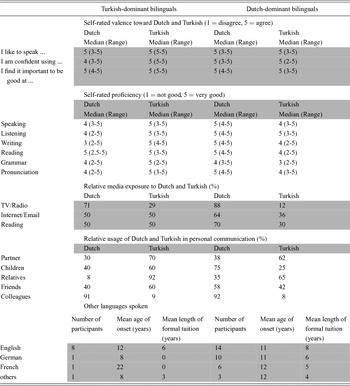
The participants completed a detailed language background questionnaire (Gullberg & Indefrey, Reference Gullberg and Indefrey2003) and standardized language proficiency tests (Centraal Instituut voor Toetsontwikkeling, CITO) in their native language (Groups TM and DM) or both languages (Groups TDB and DDB). Because the proficiency tests were to be applied after the experimental session in the respective language we chose available short (20 minutes) tests that could not cover all language skills but nonetheless provided some objective basis for comparison between groups. For Dutch we used a written cloze test of Dutch as a second language. For Turkish we used a test of text comprehension for Turkish native speakers. The scores of bilingual participants in their dominant language did not differ significantly from that of monolingual participants (independent t-tests, group TDB vs. group TM and group DDB vs. group DM: t < 1, see Table 1). The scores of bilingual participants in their non-dominant language were significantly below the scores of monolingual participants of the same language (TDB vs. DM Dutch: t (one-sided) = −3.892, df = 28, p = .000; DDB vs. TM Turkish: t (one-sided) = −3.143, df = 28, p = .002) and below the proficiency of bilingual participants in their dominant language (TDB vs. DDB Dutch: t (one sided) = −3.166, df = 28, p = .002; DDB vs. TDB Turkish: t (one sided) = −2.702, df = 28, p = .006). The group medians of self-rated proficiency (Table 2) showed the same pattern. Individual comparisons of standardized Dutch and Turkish test scores (Z-scores) showed four participants of group TDB to be more proficient in Dutch than they were in Turkish. Two participants of group DDB were more proficient in Turkish than they were in Dutch. In four of these cases the self-rated proficiencies showed the opposite pattern. In two cases (one in each group) the participants rated their proficiencies in both languages as equal. Our labels ‘Turkish-dominant’ and ‘Dutch-dominant’ thus refer to the language dominance pattern of the two groups but not necessarily to every member of the two groups.
Language background of bilingual participants

As shown in Table 2, both bilingual groups used both languages on a daily basis and showed similar general exposure and personal communication patterns. Both groups preferred Dutch over Turkish TV and radio but had a more balanced exposure to both languages on the internet and with print media. Both groups communicated more in Turkish than in Dutch with their partners and relatives and predominantly in Dutch with colleagues. The patterns differed with respect to communication with their children and friends. Dutch-dominant participants reported a more frequent use of Dutch and Turkish-dominant participants a more frequent use of Turkish. The bilingual groups did not differ in their attitude toward Dutch but Turkish dominant participants gave themselves significantly (Mann-Whitney-U-Test, exact-significance, one-sided) higher ratings for liking Turkish (p = .003), being confident in Turkish (p = .008), and finding Turkish important (p = .021) than Dutch-dominant bilinguals did.
Elicitation tool
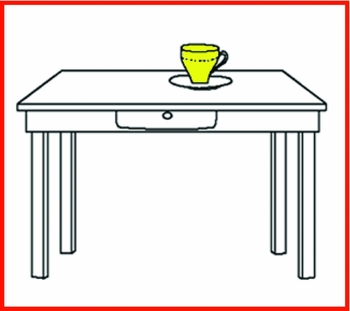
We elicited descriptions of static spatial configurations using the Topological Relations Picture Series (TRPS, Bowerman & Pedersen, Reference Bowerman, Pederson and Levinson1992a). This elicitation tool has been applied for the crosslinguistic study of spatial descriptions in many Indo-European and non-Indo-European languages (see Bowerman & Choi, Reference Bowerman, Choi, Bowerman and Levinson2001; Levinson & Meira, Reference Levinson and Meira2003). The booklet consists of 71 pages with a fixed order of line-drawings/pictures which depict a broad range of topological relations between Figure and Ground objects (see Figure 1 for an example). The order of topological relations (‘support from below’, ‘attachment’, ‘inclusion’ etc.) is randomized. The Figure is colored in yellow and the experimenter asks the participants to describe its location relative to the Ground object by answering the question “Where is the (Figure)?”
Example item from the Topological Relations Picture Series (Bowerman & Pedersen, Reference Bowerman, Pederson and Levinson1992a)

Procedure
Participants were individually tested in a quiet setting. They were exclusively addressed in Turkish or Dutch, both preceding and during the experiment, to make certain they were in a monolingual language mode (Grosjean, Reference Grosjean1982). The experimenter showed one picture at a time in a printed version of the booklet and asked that participants provide a description of the spatial relationship between the Figure object and the Ground object. Questions and answers were audio-taped for coding and analysis.
For mostFootnote 3 bilingual participants, the Dutch and Turkish tests were conducted on the same day with a one hour interval. The order of tests was counterbalanced across participants.
Data analysis
All responses were transcribed and encoded in the digital audio-video annotation software ELAN (Wittenburg, Brugman, Russel, Klassman & Sloetjes, Reference Wittenburg, Brugman, Russel, Klassman and Sloetjes2006) by a native speaker of the relevant language. Responses were analyzed using the following conventions:
-
1. Prepositions were coded for all Dutch responses containing a prepositional phrase composed of a simple (e.g., in, op, naast, ‘in, on, next to’) or complex (in het midden van, ‘in the middle of’) preposition plus a noun referring to the intended Ground object. Responses containing a copula (e.g., Het kopje is op de tafel. ‘The cup is on the table.’) or a full verb (e.g., Het kopje staat op de tafel. ‘The cup stands on the table.’; De ladder steunt tegen de muur. ‘The ladder is leaning against the wall.’) as well as responses using different but adequate nouns for the intended Ground object (e.g., vloerkleed/karpet/tapijt/mat ‘carpet (various kinds)’ were treated alike.
-
2. Postpositions and case marking suffixes were coded for all Turkish responses containing a noun referring to the intended ground object followed by a spatial nominal (e.g., içinde, üstünde, yanında, ortasında ‘in, on, next to, in the middle of’) or a noun referring to the intended Ground object marked with a locative (-DA) or dative case (-A) suffix. Responses containing no verb (e.g., Fincan masanın üstünde. ‘The cup is on the table.’) or a full verb (e.g., Fincan masanın üstünde duruyor. ‘The cup stands on the table.’; Merdiven duvara yaslanmış. ‘The ladder is leaning against the wall.’) as well as responses using different but adequate nouns for the intended Ground object were treated alike. The variants üzerinde/üstünde and içerisinde/içinde that are used interchangeably (see Göksel & Kerslake, Reference Göksel and Kerslake2005, p. 223) were coded as üst and iç Footnote 4 .
-
3. Responses, in which the figure was not located relative to the intended ground object but relative to a different object (e.g., The lamp is hanging from the ceiling. instead of The lamp is hanging above the table.) or part of the intended ground object (e.g., The apple is on the bottom of the bowl. instead of The apple is in the bowl.), and responses, in which no ground object was mentioned, were coded as invalid responses (1.7 % of all responses).
-
4. In cases of more than one answer, we only took the first answer into account.
Results
Our presentation of results is organized such that we will first present general properties of the spatial descriptions, such as the overall frequencies of the different TRMs and the variability of TRM usage in the four groups. The purpose of these sections is to evaluate to what extent possible between-group differences might simply be due to different answering styles rather than genuine changes in the extensions of TRMs.
We will then report on the extensions of TRMs in monolingual speakers with a focus on the congruence of TRMs in Dutch and Turkish monolingual speakers as these data are the baseline against which we will examine the predicted changes in the bilingual groups.
Finally, we will present the extensions of TRMs in bilingual speakers. We will first describe the commonalities and changes in TRM usage between monolinguals and bilinguals. In this section we identify two factors potentially influencing changes in TRM usage and formally assess their influence in the two bilingual groups. In a separate section, we then evaluate the predicted changes in congruence both at a group level, comparing the bilingual groups to the monolingual groups, and at the level of individual speakers within the bilingual groups.
Frequencies of TRMs
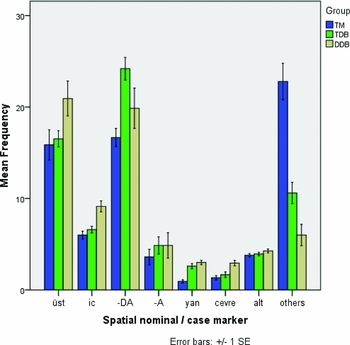
In Turkish descriptions of the location of the seventy-one Figure objects (Figure 2), participants used most frequently the locative case marker –DA followed by the spatial nominals üst (‘on’; please note that from here on we will use the bare stem to refer to all spatial nominals), and iç (‘in’), the dative case marker –A, and the spatial nominals alt (‘under’), yan (‘next to’), and çevre (‘around’). Infrequently used spatial nominals (orta ‘in the middle of’, dış ‘outside’, sol ‘to the left of’, uç ‘at the tip of’, ön ‘in front of’, ara ‘between’, kenar ‘to the side of’) added up to a considerable proportion of ‘others’, in particular for monolingual Turkish participants.
Mean frequencies of the spatial nominals and case markers used in the Turkish descriptions of spatial relations by monolingual Turkish speakers (TM), Turkish-dominant bilingual speakers (TDB), and Dutch-dominant bilingual speakers (DDB).

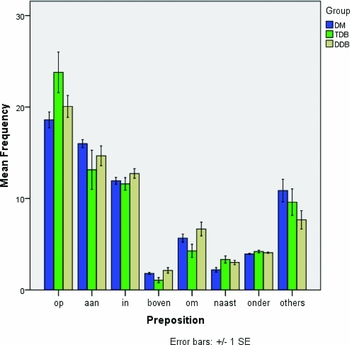
In Dutch descriptions (Figure 3), participants used most frequently the preposition op (‘on’) followed by aan (‘on’), in (‘in’), om (‘around’), onder (‘under’), naast (‘next to’), and boven (‘above’). Less frequently used prepositions summarized as ‘others’ were over (‘across’), tussen (‘between’), in het midden van (‘in the middle of’), tegen (‘against’), rondom (‘around’), onderaan (‘under’), door (‘through’), bij (‘near’), buiten (‘outside’), binnen (‘inside’), achter (‘behind’), bovenop (‘above’), voor (‘in front of’), langs (‘along’), links van (‘to the left of’), and rond (‘around’).
Mean frequencies of the prepositions used in the Dutch descriptions of spatial relations by monolingual Dutch speakers (DM), Turkish-dominant bilingual speakers (TDB), and Dutch-dominant bilingual speakers (DDB).

In both languages, there were differences between groups in their use of some TRMs. Given that the frequencies of most TRMs were not normally distributed we tested for significant differences between groups with a non-parametric test (Mann-Whitney-U-Test, two-sided, exact significance). Turkish monolingual participants differed from Dutch-dominant bilinguals in their less frequent use of üst, iç, and çevre, from Turkish-dominant bilinguals in their less frequent use of the case marker –DA, and from both bilingual groups in their less frequent use of yan and more frequent use of other spatial nominals (all p = .000). The two bilingual groups differed with respect to a more frequent use of iç (p = .001) and çevre (p = .004) in the Dutch-dominant compared to the Turkish-dominant group and a more frequent use of other spatial nominals in the Turkish-dominant compared to the Dutch-dominant group (p = .001). Differences in the use of üst and the case marker –DA were only marginally significant (both p = .095).
Dutch monolingual participants differed from Turkish-dominant bilinguals in their more frequent use of boven (p = .021), from Dutch-dominant bilinguals in their more frequent use of other prepositions (p = .025) and from both bilingual groups in their less frequent use of naast (DM-TDB p = .014; DM-DDB p = .025). The two bilingual groups differed with respect to a more frequent use of boven (p = .013) and om (p = .029) in the Dutch-dominant compared to the Turkish-dominant group.
Variability of TRM usage
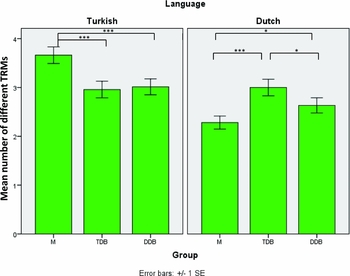
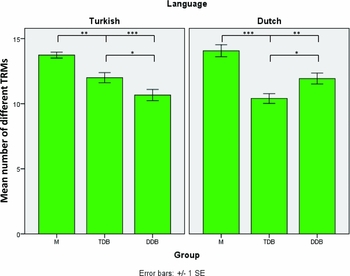
To assess how far the observed differences in TRM usage were due to genuine shifts in the preference for certain TRMs or simply due to more or less variable TRM usage between languages and groups, we calculated the mean number of different TRMs used per picture (Figure 4) and participant (Figure 5). Turkish monolingual participants used on average a wider range of TRMs for any particular picture than the two bilingual groups used in their Turkish description. By contrast, Dutch monolingual participants used on average a smaller range of TRMs for any particular picture than the two bilingual groups used in their Dutch descriptions. Whereas monolingual speakers of the two languages thus differed with respect to the relative range of prepositions they used for any particular picture, the same did not hold for the range of TRMs used by any particular participant across pictures. As can be seen in Figure 5, both Dutch and Turkish monolingual speakers used a wider range of TRMs across the 71 pictures than the bilingual groups. Moreover, dominant bilinguals used a wider range of TRMs than non-dominant bilinguals in both languages.
Mean number of different TRMs per item used in the Turkish (left panel) and Dutch (right panel) descriptions of spatial relations by monolingual speakers (M), Turkish-dominant bilingual speakers (TDB), and Dutch-dominant bilingual speakers (DDB). (*p < .05, ***p < .001, Wilcoxon-Test, exact significance, two-sided)

Mean number of different TRMs per participant used in the Turkish (left panel) and Dutch (right panel) descriptions of spatial relations by monolingual speakers (M), Turkish-dominant bilingual speakers (TDB), and Dutch-dominant bilingual speakers (DDB). (*p < .05, **p < .01, ***p < .001, Mann-Whitney-U-Test, exact significance, two-sided)

In sum, most between-group differences in TRM frequencies can be accounted for by the fact that participants with a better command of the language used a wider range of TRMs. The more different TRMs the larger the proportion of less frequently used TRMs (summarized as ‘others’ in Figures 2 and 3) and the smaller the proportions of the most frequently used TRMs. There are, however, two differences that cannot be accounted for in this way. Despite their wider range of TRMs, Turkish-dominant bilinguals used the locative case marker more often than Dutch-dominant bilinguals did and Dutch monolinguals used boven (‘above’) more often than Turkish-dominant bilinguals did. These observations suggest that there are also genuine qualitative between-group differences in the use of TRMs. To identify such differences, we will now turn to the patterns of TRM use across the different kinds of spatial relationships.
Extensions of TRMs in monolingual Turkish and Dutch speakers
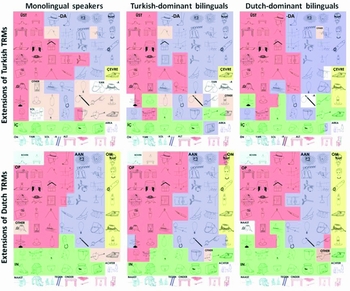
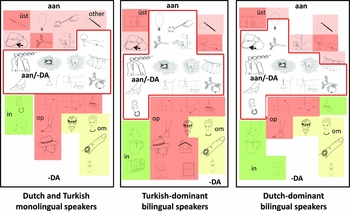
For every group and language we determined the most frequently used TRM for each of the 71 pictures. Following Bowerman (Reference Bowerman, Bloom, Peterson, Nadel and Garrett1996), Bowerman and Choi (Reference Bowerman, Choi, Bowerman and Levinson2001) and Levinson and Meira (Reference Levinson and Meira2003), we then constructed language and group extensional maps to show the groupings of pictures assigned a particular TRM. To facilitate visual inspection of the maps, we arranged the pictures in the maps such that the contiguity of regions of pictures described with the same TRM was maintained as well as possible for all groups and languages. Figure 6 provides an overview of the most frequently used TRMs for all 71 pictures in both languages for all groups. We color-coded the extensions of those Turkish and Dutch TRMs (üst and op, -DA and aan, iç and in, alt and onder) that showed correspondences for larger numbers of pictures. With the exception of –DA/aan, these pairs of Turkish and Dutch TRMs are listed as translation equivalents in Turkish–Dutch dictionaries.
Extension maps of TRMs for all 71 pictures of the Topological Relations Picture Series. Items that were most often described with a particular TRM are given identical background colors (red = üst/op, dark blue = -DA/aan, green = iç/in, yellow = çevre/om, light blue = boven, pink = others) or object colors (red = alt/onder). Items that were equally often described with two TRMs are given the two corresponding background colors. Remaining items are labeled with the TRM most frequently used for their description. (TM, DM = monolingual Turkish and Dutch speakers, TDB = Turkish-dominant bilingual speakers, DDB = Dutch-dominant bilingual speakers)

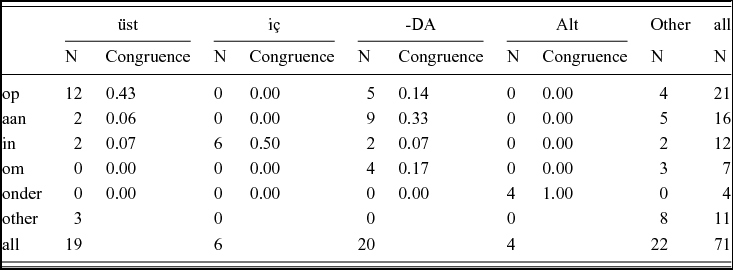
To obtain an unbiased metric of the congruence of two TRMs between Turkish and Dutch, we quantified the degree of extension overlap in the monolingual groups for all pairs of TRMs by calculating the proportion of congruent pictures (Congruence = the number of pictures for which the two TRMs were most frequently used in Turkish and Dutch divided by the number of pictures for which at least one of the two TRMs was most frequently used in Turkish or Dutch). The congruence values in Table 3 show that in our sample of pictures only alt and onder were fully congruent2, whereas –DA/aan, üst/op, and iç/in showed values between 0.33 and 0.5 indicating a certain extension overlap but also a considerable number of spatial relations for which only one of the two TRMs was most frequently used.
Matrix of congruence values* of the most frequently used TRMs

*Congruence = DTj/(Dj+Tj-DTj) (j = pair of Dutch and Turkish TRMs; DTj = number of items for which both TRMs of pair j were most frequently used in the Turkish and Dutch descriptions; Dj = number of items for which the Dutch TRM of pair j was most frequently used in the Dutch descriptions; Tj = number of items for which the Turkish TRM of pair j was most frequently used in the Turkish descriptions)
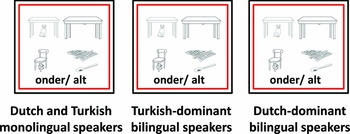
The leftmost panels in Figures 7–10 show extensional maps for the TRM pairs alt/onder, iç/in, üst/op, and -DA/aan as used by Turkish and Dutch monolingual speakers. As already indicated by the congruence value of 1.0, the extensions of Dutch onder and Turkish alt fully overlap (Figure 7) comprising all pictures in which the figure object is with or without contact in part or completely under the ground object.
Extension maps of the TRMs alt and onder. The red border marks the common extension of the two TRMs.

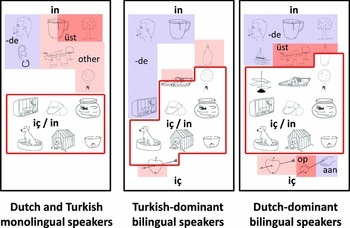
Extension maps of the TRMs iç and in. The red border marks the common extension of the two TRMs. The items above were described with in in Dutch and the indicated TRMs in Turkish. The items below were described with iç in Turkish and the indicated prepositions in Dutch. Items that were equally often described with two TRMs are given the two corresponding background colors.

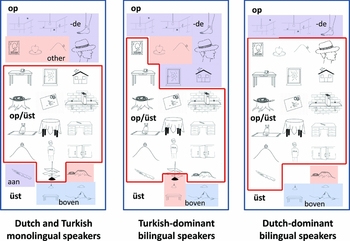
Extension maps of the TRMs üst and op. The red border marks the common extension of the two TRMs. The items above were described with op in Dutch and the indicated TRMs in Turkish. The items below were described with üst in Turkish and the indicated prepositions in Dutch. Items that were equally often described with two TRMs are given the two corresponding background colors.

Extension maps of the locative case marker -DA and the preposition aan. The red border marks the common extension of the two TRMs. The items above were described with aan in Dutch and the indicated TRMs in Turkish. The items below were described with -DA in Turkish and the indicated prepositions in Dutch. Items that were equally often described with two TRMs are given the two corresponding background colors.

The extensions of Dutch in and Turkish iç (congruence value = 0.5, Figure 8) overlap for most pictures with partial or full inclusion of the figure objects in the ground objects. Whereas all uses of iç fell into the common extension of Dutch and Turkish, the use of in was broader than the common extension. Dutch speakers used in for partial inclusion relationships with body parts as ground objects whereas Turkish speakers preferred the locative suffix –DA in these cases. Only two Turkish speakers used iç to describe the cigarette in the mouth, no-one to describe the earring in the ear lobe. For the picture ‘owl in tree’, some Turkish speakers used iç when locating the owl relative to the tree but most speakers located it relative to a different ground object (hole, tree trunk) marked for locative case. For the pictures showing a crack in a cup and a hole in a towel, Turkish speakers never used iç but preferred the TRMs meaning ‘in the middle of’ and ‘on the left side of’.
The extensions of Dutch op and Turkish üst (congruence value = 0.43, Figure 9) overlap for most pictures where the figure object is higher than the ground object and supported by it. The extension of op also included a number of spatial relationships that were preferentially marked with locative case by Turkish speakers, such as support from below with a body part (head) as the ground object and ‘clingy attachment’ relationships (fly on the ceiling/wall, band aid on leg). The extension of op also included spatial relations where Turkish speakers preferred other TRMs such as ‘in the middle of’ and ‘on the right side of’. In all these cases up to three out of the fifteen Turkish speakers used üst. The extension of the preferred use of üst included spatial relations that were described with aan (butter on knife), over (hose across tree trunk) and boven (lamp above table, cloud above mountain) by Dutch speakers. Up to five Dutch speakers used op instead of aan or over. By contrast, Dutch speakers never used op to describe the two pictures showing figure objects that were higher than but not supported by the ground object. For these pictures they unanimously used the preposition boven (‘above’).
The extensions of Dutch aan and Turkish –DA (congruence value = 0.33, Figure 10) overlap for many spatial relationships involving some kind of fixed attachment. Whereas Dutch speakers also used aan for attachment of the figure object to a point or the end of the ground object, most Turkish speakers preferred the more explicit spatial nominal uç (‘at the tip of’) but –DA was used by one or two speakers. As already reported above, Turkish speakers preferred to use –DA over the spatially explicit spatial nominals iç and üst whenever the ground object was a body part. As shown in Figure 10, this observation can be generalized to ‘around’ relationships that Dutch speakers described using the preposition om.
To summarize, all TRM pairs showed a relatively clearly defined extension overlap. Language-specific uses seemed to be mainly due to
-
(a) Turkish speakers distinguishing between body part and other ground objects by using the locative suffix for (predictable) relations between figure objects and body part ground objects and spatially explicit spatial nominals for other kinds of ground objects,
-
(b) a preference in Turkish speakers to name the location area (left, right, middle) of the figure object in some cases and to name a contact point in all cases,
-
(c) Dutch speakers distinguishing between fixed (aan) and other kinds of attachment (op)
-
(d) Dutch speakers distinguishing between ‘higher than’ relationships involving contact/support (op) or not (boven).
Extensions of TRMs in bilingual speakers
The middle and right panels in Figures 7–10 show the extensions of the four pairs of TRMs in the Turkish and Dutch descriptions of the bilingual groups.
The patterns of differences in the extensions of Dutch-dominant bilinguals compared to monolingual speakers of both languages are relatively straightforward. For all TRM pairs, the common extension of Dutch-dominant bilinguals almost completely included the common extension of the monolingual speakers. In other words, where monolingual speakers used translation-equivalent TRMs, Dutch-dominant bilinguals did the same, but described a varying number of additional spatial relationships with these TRM pairs.
For the TRMs alt and onder that showed fully overlapping extensions in monolingual speakers, these extensions were the same in Dutch-dominant bilinguals.
For iç and in, the larger common extension in Dutch-dominant bilinguals was mainly due to pictures that neither Dutch nor Turkish monolinguals preferred to describe using iç or in (one Dutch and three Turkish monolinguals used in/iç to describe the house within the fence, five Dutch and no Turkish monolinguals used in/iç to describe the cork on the bottle).
For üst and op, by contrast, the larger common extension in Dutch-dominant bilinguals did not contain ‘new’ items but mainly pictures that were preferentially described with op by Dutch monolinguals and for which most Dutch-dominant bilinguals but only a minority of Turkish monolinguals used üst. The extension of the preferred use of op by Dutch-dominant bilinguals included one additional item (butter on knife) for which also a relatively large minority of five Dutch monolinguals used op instead of aan.
Also for aan and –DA, the larger common extension in Dutch-dominant bilinguals was mainly due to items that were preferentially described with aan by Dutch monolinguals and for which Dutch-dominant bilinguals but not Turkish monolinguals preferred the locative case marker –DA. The extension of the preferred use of aan by Dutch-dominant bilinguals included one additional item (earring in ear lobe) for which also a relatively large minority of four Dutch monolinguals used aan instead of in.
In sum, the descriptions of Dutch-dominant bilinguals differed from those of monolinguals in that there were larger common extensions of Turkish and Dutch TRMs. In almost all cases this increase was due to the bilinguals using description options that were not most frequently but at least occasionally used by monolingual speakers. It is worth mentioning some properties of the descriptions of Dutch-dominant bilinguals that did not differ from the description of monolinguals:
-
(a) Dutch-dominant bilinguals did not adopt the Dutch distinction of kinds of attachment for Turkish or the lack of such a distinction for Dutch.
-
(b) They did not adopt the Turkish distinction of ground objects for Dutch (with the possible exception of the ‘earring in the ear lobe’ item) or the lack of such a distinction for Turkish (with the exception of the ‘hat on the head’ item)
-
(c) They did not adopt the Turkish lack of a distinction between ‘on’ and ‘above’ relations for Dutch.
The patterns of differences between the TRM extensions of Turkish-dominant bilinguals and those of the other groups were more complex. Whereas the common extension of alt and onder was not different from that of monolingual speakers, the common extension of –DA and aan was considerably larger. The common extensions for üst/op and iç/in did not much differ from those of monolinguals in size but, unlike for Dutch-dominant bilinguals, did not always include the common extensions of the monolingual speakers. For some items (rain on window, man on roof, rabbit in cage) that Turkish monolinguals described with üst or iç Turkish-dominant bilinguals preferred the locative suffix. The main difference between the Turkish descriptions of the Turkish-dominant bilinguals and those of the other groups was a much broader use of the locative suffix (28 items, see Figure 10) covering many of the point attachment relations that Turkish monolinguals preferred to describe with uç as well as the ‘in’ and ‘on’ relations mentioned above. Note that for all these items there were between one and four monolinguals who also used the locative suffix in their descriptions.
In sum, the descriptions of Turkish-dominant bilinguals differed from those of monolinguals for some items but there was no general increase in the common extensions of Turkish and Dutch TRMs. A general preference for the use of the locative marker resulted in a larger common extension of aan and –DA but non-congruent uses of –DA increased as well.
Similar to Dutch–dominant bilinguals,
-
(a) Turkish-dominant bilinguals did not adopt the Dutch distinction of kinds of attachment for Turkish or the lack of such a distinction for Dutch.
-
(b) They did not adopt the Turkish distinction of ground objects for Dutch (with the possible exception of the ‘earring in the ear lobe’ item) or the lack of such a distinction for Turkish.
-
(c) They did not adopt the Turkish lack of a distinction between ‘on’ and ‘above’ relations for Dutch. Note, however that for the item ‘lamp above table’ most participants located the lamp relative to the ceiling rather than the table.
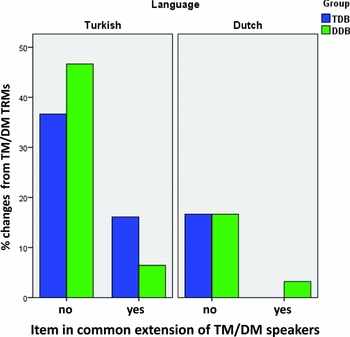
As the extension maps suggested that the items in the common extensions of the TRM pairs alt/onder, iç/in, üst/op, and –DA/aan in monolingual participants were less prone to differences between the participant groups than items in the language-specific parts of the extensions of the TRMs, we calculated the proportions of changes in TRM use between monolingual and bilingual speakers for the two kinds of items. Of the 61 items that monolingual speakers described using any of the eight TRMs, 31 were common-extension items and 30 were not. Figure 11 shows that the majority of differences were due to changes in the TRMs used in the Turkish descriptions and mainly occurred for items that were not in the common extensions of monolingual participants.
Proportions of changed TRMs in the spatial descriptions of the two bilingual groups for items that were in the common (‘yes’) or the language-specific (‘no’) extensions of TRMs in the spatial descriptions of the two monolinguals groups.

Based on our observation that in the majority of cases the TRMs used by the bilingual participants had in fact also been used by at least some monolingual speakers we, furthermore, reasoned that there might be a relationship between the consistency (or lack thereof) with which monolingual speakers used a particular TRM and the likelihood that bilingual speakers used the same or a different TRM. This was indeed the case. As can be seen in Figure 12, the average number of monolingual speakers using the preferred TRMs of a monolingual group was lower for those TRMs that changed in the bilingual groups.
Relationship between consistency of TRM use in monolingual speakers (mean number of speakers using the most frequently used TRM, max = 15) and change in TRM use in bilingual speakers.

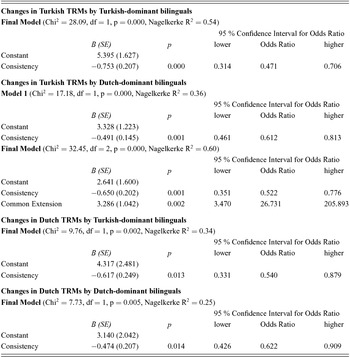
We conducted separate stepwise (forward model) logistic regressions for the four Language by Group combinations to assess the predictive values of the predictors Common Extension (item was in common extension of monolingual groups or not) and Consistency (number of monolingual participants using preferred TRM for this item) for the binary outcome Change (same or different TRM used by monolingual and bilingual participants for this item). For all four Language by Group combinations, including the predictor Consistency significantly improved the models (see Table 4), suggesting that items with lower consistency (i.e., a higher number of monolingual speakers deviating from the most frequently used TRM) were more likely to be described with a different TRM by bilingual speakers. As indicated by similar Odds Ratios, this effect was of comparable magnitude for the four Language by Group combinations. Adding the additional predictor Common Extension only improved the model for changes in Turkish TRMs by Dutch-dominant bilinguals significantly (There was a non-significant trend for Turkish-dominant bilinguals, p = .074). This result confirms that Dutch-dominant bilinguals were more likely to change the Turkish TRMs for items outside the common extensions of the monolingual groups. Common Extension had no significant influence on changes of Dutch TRMs. Adding the interaction term Common Extension-by-Consistency improved none of the four models.
Regression analyses of predictors for changes in Turkish and Dutch TRM use

Congruence of TRMs in Turkish and Dutch
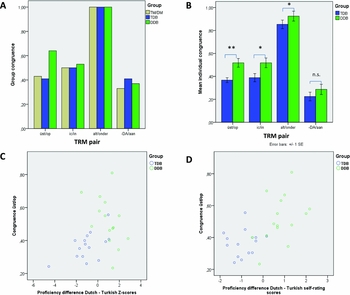
So far, we have identified some factors influencing changes in the choice of TRMs between monolingual and bilingual speakers but still need to assess whether such changes resulted in a greater congruence of the use of Turkish and Dutch TRMs. We calculated the congruence of the four TRM pairs in the Dutch and Turkish descriptions of the two bilingual groups in the same way as for the monolingual participant groups. As shown in Figure 13 A, compared to the Dutch and Turkish descriptions of the monolingual groups and the Turkish-dominant bilinguals, the descriptions of Dutch-dominant bilinguals had a considerably higher congruence value for the TRMs üst and op and a slightly higher value for the TRMs iç and in. Turkish-dominant bilinguals had a higher congruence value for the TRMs –DA and aan.
(A) Congruence values based on most frequently used TRM per group. (B) Mean congruence values of individual participants. (C,D) Individual congruence values for the TRM pair üst/op plotted against (C) individual Dutch – Turkish proficiency differences (Z-score CITO Dutch test – Z-score CITO Turkish test) and (D) individual self-rated Dutch – Turkish proficiency differences. See main text for the calculation of group-wise (p. 15) and individual (p. 22) congruence values. (n.s. = not significant, * p < .05, ** p < .01; üst/op, iç/in, and –DA/aan: independent t-tests, df = 28, one-sided; alt/onder: Mann-Whitney-U-Test, exact significance, one-sided)

These congruence values indicate increases in extension overlap for the TRMs that were most frequently used by a participant group as a whole. They do, however, not indicate to what extent individual speakers used corresponding Turkish and Dutch TRMs for the same pictures. In principle, group-wise congruence increases could have occurred without corresponding increases in the congruent usage by individual speakers. In an extreme case, a particular item might have been described with üst by half of the speakers of a group and with op by the other half. At the group level, this item would then belong to the common extension of üst and op without any single individual using both TRMs to describe it. Thus, although the assessment of group-wise congruence was necessary to compare the bilingual groups to the monolingual groups (for which, of course, no individual congruence was available), group-wise congruence increases are at best an indirect measure of what goes on in a bilingual individual and could be misleading.
For the two bilingual groups we, therefore, additionally calculated individual congruence values (Congruencei = the number of pictures for which participant i used the two TRMs in Turkish and Dutch divided by the number of pictures for which participant i used one of the two TRMs in Turkish or Dutch). These values allowed for statistical comparisons between the two bilingual groups. The mean individual congruence values of Dutch-dominant bilinguals (see Figure 13 B–D) were significantly higher than those of Turkish-dominant bilinguals in the use of üst and op as well as iç and in. In the group of Turkish-dominant bilinguals, there was a weak but significant correlation between the degree of Turkish dominance and individual congruence values for the TRM pair üst/op (r = .57, p = .026). Participants with more balanced language proficiency or even higher scores in the Dutch compared to the Turkish proficiency test tended to have higher congruence values. In contrast, there was no significant relationship when the degree of dominance was assessed on the basis of self-rated proficiency in the two languages. There were no significant correlations between language dominance and congruence for the TRM pair iç/in in this group or for any TRM pair in the group of Dutch-dominant bilinguals.
Even for the TRMs alt and onder that already showed full congruence at the group level for Turkish-dominant bilinguals (see left panel) there was a significant increase in individual congruence values for Dutch-dominant bilinguals indicating a higher proportion of congruent items per participant. By contrast, there was no significant difference between Turkish- and Dutch dominant bilinguals in the individual congruence of aan and –de, suggesting a special status of this TRM pair.
Discussion
In this study, we investigated the use of TRMs in elicited Turkish and Dutch descriptions of static topological relations in Turkish–Dutch bilinguals and native speakers of the two languages that did not know the other language (‘monolingual speakers’). Our results for monolingual speakers are informative with respect to differences in the expression of static spatial relations between Dutch and Turkish. As these differences are the background against which our hypotheses about changes in the spatial descriptions of bilingual participants can be evaluated, we will first discuss the monolingual data.
Spatial descriptions in Turkish and Dutch monolingual speakers
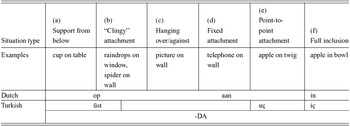
The spatial descriptions we elicited from native Turkish speakers in Turkey complement the corresponding data on almost fifty languages collected by Bowerman and Pederson (Reference Bowerman and Pederson1992b, summarized in Bowerman & Choi, Reference Bowerman, Choi, Bowerman and Levinson2001) and Levinson and Meira (Reference Levinson and Meira2003) using the same elicitation tool. Based on observed implicational hierarchies, Bowerman and Pederson (Reference Bowerman and Pederson1992b) ordered the different kinds of spatial relations on a scale from prototypical ‘on’ situations to prototypical ‘in’ situations (see Table 5). If, for example, a language uses a particular TRM for (a) and (c) situations, then it uses that TRM also for (b) situations. Languages differ with respect to the number of TRMs used to cover the scale and with respect to the border positions. English, for example, uses on for (a)–(e) and in for (f). Bowerman and Choi (Reference Bowerman, Choi, Bowerman and Levinson2001) mention Dutch as having a rather exceptional pattern with op for (a) and (b), aan for (c)–(e), and in for (f). Our data on Dutch confirm this pattern. Another pattern found, for example, in Japanese and Korean uses
Extensions of Dutch and Turkish TRMs on the ‘on-in’ scale (Bowerman & Choi, Reference Bowerman, Choi, Bowerman and Levinson2001)

one term for (a) and another for (f). Neither term is used for (b)–(e); these situations are covered instead by a general locative word or inflection – also applicable to (a) and (f) – that indicates only that there is some spatial relationship between the Figure and the Ground, normally understood as the most canonical one for the objects in question. (Bowerman & Choi, Reference Bowerman, Choi, Bowerman and Levinson2001, p. 486).
Our data suggest that Turkish is close to this pattern, using üst for (a) and iç for (f) and the locative case marker –DA for (b)–(d). Note, however, some differences: Firstly, the locative inflection does not just seem to be applicable in all kinds of situations (even a prototypical ‘on’ situation, such as ‘hat on head’) but its application was always preferred, when the ground object was a body part. The second slight deviation from the described pattern is that üst was used for some ‘clingy’ attachment situations (raindrops on window, butter on knife) but not for others (spider on wall or ceiling), so that the borderline between the preferred use of a spatial nominal and the use of a general locative inflection does not seem to be between (a) and (b), but between different kinds of ‘clingy’ attachment situations (This is actually also the case for Dutch but with different distinctions; see Van Staden, Bowerman & Verhelst, Reference Van Staden, Bowerman, Verhelst, Levinson and Wilkins2006). Finally, the locative inflection was not preferred for situations of type (e), i.e., point-to-point attachment. Instead our Turkish speakers used the spatial nominal uç (‘at the tip of).
As can be seen in Table 5, the distributions of Dutch and Turkish spatial terms are similar in that they overlap for situation types (a), (c), (d), and (f). The common extension of üst and op (see also Figure 9) covers type (a) situations and some type (b) situations, the common extension of iç and in (Figure 8) covers type (f) situations, and the common extension of –DA and aan (Figure 10) type (c) and (d) situations. The main differences are a broader use of op compared to üst for type (b) situations, a special term for type (e) situations in Turkish, and the existence of a locative marker in Turkish. Although the locative marker shares the use for situation types (c) and (d) with the Dutch preposition aan, unlike aan it can be used in all other types of situations, suggesting that it does not denote a particular type of spatial relationship between Figure and Ground. It is therefore best characterized as a general locative word (Bowerman & Choi, Reference Bowerman, Choi, Bowerman and Levinson2001) or general locative marker (Levinson & Meira, Reference Levinson and Meira2003; see also Feist, Reference Feist2008, for a more in-depth discussion of ‘general spatial terms’).
Turkish and Dutch spatial descriptions by bilingual speakers
Based on the recent framework of Muysken (Reference Muysken2013) we predicted that bilingual speakers would differ from monolingual speakers mainly in their use of TRMs in Turkish. For Dutch-dominant bilinguals we expected an increase in the congruence of Turkish and Dutch translation-equivalent TRMs. For Turkish-dominant bilinguals we could not derive a single prediction from Muysken (Reference Muysken2013), but considered an increase in the use of the Turkish locative marker one possibility. Our findings generally confirmed these predictions. Whereas for Dutch-dominant bilinguals TRM changes resulted in a higher congruence of the TRM pairs üst/op and iç/in, the predominant change pattern in Turkish-dominant bilinguals was a more extensive use of the spatially non-explicit locative case marker –DA.
We further identified a number of factors influencing the likelihood of TRM changes. Dutch-dominant bilinguals were more likely to change a TRM that was outside the common extension of a Dutch and Turkish TRM pair. Both bilingual groups were more likely to change the preferred TRMs of items for which there was relatively little consistency in the descriptions of monolinguals. Finally, and most importantly, bilinguals predominantly shifted to TRMs that were also used by (a minority of) monolingual speakers.
For Dutch-dominant bilinguals, the pattern of results is consistent with the predicted L2 type of bilingual optimization strategy. The observed convergence is asymmetric and largely due to changes that made the extensions of Turkish TRMs more similar to their Dutch translation equivalents. However, given that the TRMs used by the bilinguals were also used by some monolingual speakers, the bilinguals’ usage cannot be considered as being outside of the extension of the TRM in the Turkish spoken in Turkey. To the extent that the extensions reflect the intensions or meanings of the TRMs, there is thus no reliable evidence for a change in meaning or ‘conceptual transfer’ (Pavlenko, Reference Pavlenko and Pavlenko2011). Using a distinction from Treffers-Daller and Mougeon (Reference Treffers-Daller and Mougeon2005), the observed changes are better characterized as being of a quantitative rather than of a qualitative nature and hence may be termed ‘covert transfer’ (Treffers-Daller & Mougeon, Reference Treffers-Daller and Mougeon2005). It is also similar to the notion of redistributive convergence (Alferink & Gullberg, Reference Alferink and Gullberg2014; Clyne, Reference Clyne2003; Toribio, Reference Toribio2004).
For Turkish-dominant bilinguals, the evidence for an L2 type of optimization strategy is much weaker. Although they also mainly changed the TRMs used in the Turkish descriptions, the lack of an increase in congruence suggests that the changes are not readily explained as reflecting an L2 influence and seem to be rather due to an alternative optimization strategy. Muysken (Reference Muysken2013) suggests that in cases of bilingual communities or individuals without a clear dominance relation between the two languages either an L1/L2 strategy (i.e., a mutual influence of both languages) or a ‘universal’ (UP) strategy may be applied. In the case of Turkish-dominant bilinguals living in the Netherlands our results favor the latter option. The spatially non-explicit case marker –DA can be seen as a general locative marker in the sense of Levinson and Meira (Reference Levinson and Meira2003). In consequence, the observed more extensive use of the locative case would indeed constitute some kind of ‘universal’ strategy.
Conclusions
The two groups of Turkish–Dutch bilinguals used different bilingual optimization strategies with Dutch-dominant bilinguals enhancing the congruence between Turkish and Dutch TRMs and Turkish-dominant bilinguals increasing the use of a topologically neutral locative marker. The kinds of strategies our two groups of bilinguals adopted are in line with predictions from Muysken's (Reference Muysken2013) recent framework for the interpretation of language contact phenomena. Interestingly, both strategies result in a reduction of a possible perceived conflict between the Dutch and Turkish TRMs used for certain spatial situations. It is at least plausible that this kind of conflict increases a speaker's processing load and hence our results are consistent with the idea that contact-induced changes may serve a reduction in processing load in bilingual speakers (Matras, Reference Matras2009). At the same time our data suggest that the extent to which bilingual optimization strategies are employed by speakers of immigrant Turkish is constrained by a counteracting tendency to avoid what one might call within-language conflict: The observed changes in TRM use are all licensed (albeit not preferred) in the Turkish spoken in Turkey.