1 Introduction
The Sonority Sequencing Principle (SSP; Sievers Reference Sievers1881, Jespersen Reference Jespersen1904, Steriade Reference Steriade1982, Selkirk Reference Selkirk, Aronoff and Oerhle1984, Clements Reference Clements, Kingston and Beckman1990) defines a scale characterising cross-linguistic syllable well-formedness. The SSP favours syllables whose onsets rise in sonority toward the nucleus and fall in sonority from nucleus to coda. As shown in (1), the SSP prefers greater sonority rises for complex onsets, favouring large rises [bl[ over plateaus [bd[, which are in turn preferred to sonority falls [lb[.
-
(1)


Recent studies employing a variety of behavioural tasks across multiple languages have consistently found that the SSP is active in speakers’ grammars (Davidson Reference Davidson2006, Berent et al. Reference Berent, Steriade, Lennertz and Vaknin2007, Berent Reference Berent2008, Berent et al. Reference Berent, Lennertz, Jun, Moreno and Smolensky2008, Ren et al. Reference Ren, Gao and Morgan2010, Berent et al. Reference Berent, Harder and Lennertz2011, Daland et al. Reference Daland, Hayes, White, Garellek, Davis and Norrmann2011, Berent et al. Reference Berent, Lennertz and Rosselli2012, Tamási & Berent Reference Tamási and Berent2014, Zhao & Berent Reference Zhao and Berent2016). Because the effects of SSP are found for novel clusters that are unobserved in the speakers’ language input, these effects have been termed sonority projection (see also Hayes Reference Hayes, Lee and Zee2011). In English, with the exception of [s]-initial clusters (e.g. [st sk sn sm]), only clusters with large sonority rises are permitted (e.g. [pl gw ∫ɹ]). For English, sonority-projection effects have been demonstrated with both adults and children for various tasks, including production, perception and non-word acceptability. For example, Berent et al. (Reference Berent, Steriade, Lennertz and Vaknin2007) show that English speakers are more likely to perceptually repair severe SSP violators like [lbif] than moderately violating forms like [bdif], which in turn are repaired more often than mildly violating forms like [bnif]. This occurs despite the fact that English speakers have no direct experience with word-initial [lb], [bd] or [bn]. Sonority projection is also observed in Korean and Mandarin, which have a more restricted inventory of initial clusters than English. Both languages lack syllable-initial clusters entirely, except for obstruent–glide–vowel sequences, which are sometimes analysed as complex onsets (Lee Reference Lee and Kim-Renaud1994, Duanmu Reference Duanmu2000) and sometimes as combinations of simple onsets with complex nuclei (Hockett Reference Hockett1947).
That the SSP is active in speakers’ grammars is largely uncontroversial. What is actively debated, however, is the source of this knowledge. How do phonotactic generalisations like the SSP come to be part of speakers’ grammars? Must the SSP be provided to the learner as a universal principle or phonetic bias, or could speakers induce generalisations about the SSP from their language input? On the one hand there are proponents of a strong universalist interpretation of these results (Berent et al. Reference Berent, Steriade, Lennertz and Vaknin2007, Berent Reference Berent2008, Berent et al. Reference Berent, Lennertz, Jun, Moreno and Smolensky2008, Ren et al. Reference Ren, Gao and Morgan2010, Berent et al. Reference Berent, Harder and Lennertz2011, Berent et al. Reference Berent, Lennertz and Rosselli2012, Tamási & Berent Reference Tamási and Berent2014, Zhao & Berent Reference Zhao and Berent2016). On the other, however, the need to invoke universal principles or phonetic biases to explain these effects has been questioned, for example by Daland et al. (Reference Daland, Hayes, White, Garellek, Davis and Norrmann2011) and Hayes (Reference Hayes, Lee and Zee2011), who argue that they are predictable from the input, given the right kinds of computational models.
There is abundant evidence that speakers’ knowledge and learning of phonology and phonotactics are sensitive to the statistical properties of the language input. A substantial body of research indicates that gradient phonotactic acceptability (Coleman & Pierrehumbert Reference Coleman, Pierrehumbert and Coleman1997, Vitevitch et al. Reference Vitevitch, Luce, Charles-Luce and Kemmerer1997, Frisch et al. Reference Frisch, Large and Pisoni2000, Bailey & Hahn Reference Bailey and Hahn2001, Kager & Pater Reference Kager and Pater2012) and productive knowledge of phonological alternations (Zuraw Reference Zuraw2000, Ernestus & Baayen Reference Ernestus and Baayen2003, Hayes & Londe Reference Hayes and Londe2006) mirror statistical trends in the lexicon. Phonological acquisition is also shaped by the statistical structure of the input. For example, infants below the age of one are sensitive to phonotactic probability in their native language, and this sensitivity affects speech production, speech perception and word segmentation (Jusczyk et al. Reference Jusczyk, Luce and Charles-Luce1994, Saffran et al. Reference Saffran, Aslin and Newport1996, Mattys & Jusczyk Reference Mattys and Jusczyk2001, Coady & Aslin Reference Coady and Aslin2004, Zamuner Reference Zamuner2009). The effects of frequency are also evident in the acquisition order of phonological patterns, with developmental order varying cross-linguistically, depending on input statistics (Ingram Reference Ingram1988, Vihman Reference Vihman1993, Levelt et al. Reference Levelt, Schiller and Levelt2000, Edwards & Beckman Reference Edwards and Beckman2008, Jarosz Reference Jarosz2010).
Although clusters like [nb bd bn] are absent word-initially in English, Mandarin and Korean, speakers of these languages do experience patterns with varying degrees of abstract phonological similarity to these clusters. There is a growing literature demonstrating the impressive abilities that computational models with minimal representational assumptions have to induce phonological generalisations predicting speakers’ performance in various behavioural tasks (Coleman & Pierrehumbert Reference Coleman, Pierrehumbert and Coleman1997, Bailey & Hahn Reference Bailey and Hahn2001, Frisch et al. Reference Frisch, Pierrehumbert and Broe2004, Hayes & Wilson Reference Hayes and Wilson2008, Albright Reference Albright2009, Daland et al. Reference Daland, Hayes, White, Garellek, Davis and Norrmann2011). Recent studies have shown that these models are more successful when they rely on richer phonological representations, such as features, syllables, tiers and metrical grids (Frisch et al. Reference Frisch, Pierrehumbert and Broe2004, Hayes & Wilson Reference Hayes and Wilson2008, Albright Reference Albright2009, Daland et al. Reference Daland, Hayes, White, Garellek, Davis and Norrmann2011, Hayes Reference Hayes, Lee and Zee2011, Kager & Pater Reference Kager and Pater2012). Most pertinent to the current investigations, recent findings reveal that models with certain properties correctly predict sonority-projection effects not only for English (Daland et al. Reference Daland, Hayes, White, Garellek, Davis and Norrmann2011), but also for languages likes Korean and Mandarin, and, in principle, CV languages (Hayes Reference Hayes, Lee and Zee2011), without the need to posit a built-in SSP principle. If sonority projection can be inferred by the learner with the right representational assumptions, this undermines the strong universalist interpretation of these findings.
At the same time, much research on phonological learning suggests that reference to universal principles or phonetic biases may be necessary. Sonority projection is just one example of a wider range of studies demonstrating poverty of the stimulus effects, where speakers exhibit preferences among novel structures that follow universal scales. Such effects are also observed in second language acquisition and loanword adaptation (Broselow & Finer Reference Broselow and Finer1991, Broselow et al. Reference Broselow, Chen and Wang1998), and a number of studies show that these effects are not reducible to basic lexical statistics (see e.g. Davidson Reference Davidson2006, Berent et al. Reference Berent, Steriade, Lennertz and Vaknin2007). Surfeit of the stimulus effects, on the other hand, demonstrate that language learners may fail to learn or learn more poorly generalisations that do not conform to universal principles or phonological naturalness, even when the patterns supporting those generalisations are robustly represented in the input (Hayes et al. Reference Hayes, Zuraw, Siptár and Londe2009, Becker et al. Reference Becker, Ketrez and Nevins2011, Becker et al. Reference Becker, Nevins and Levine2012, Hayes & White Reference Hayes and White2013). Many of the most striking arguments for the role of universal biases come from findings demonstrating remarkable consistency in developmental trajectories across languages. It has long been observed that typologically rare and marked structures tend to be acquired later by children, regardless of the input (Jakobson Reference Jakobson1968, Stampe Reference Stampe1969). For example, research on the development of basic syllable structure across languages consistently finds that children acquire more marked syllable shapes (e.g. CVCC) later than less marked syllables shapes (e.g. CV) (Fikkert Reference Fikkert1994, Demuth Reference Demuth1995, Levelt et al. Reference Levelt, Schiller and Levelt2000, Jarosz Reference Jarosz2010). Once again, these developmental progressions are often not directly derivable from the statistics of the input (see e.g. Levelt et al. Reference Levelt, Schiller and Levelt2000). One concrete example is the basic CV syllable in English, which is not the most frequent syllable shape in English child-directed speech (Jarosz Reference Jarosz2010); nevertheless, studies have found that children generally acquire open syllables before closed syllables (Fee & Ingram Reference Fee and Ingram1982, Demuth Reference Demuth1995). Studies of phonological development also show that systematic preferences observed in children's errors can be attributed to universal principles. For example, when children reduce complex onsets, there is a tendency to retain the lower-sonority consonant (Pater & Barlow Reference Pater and Barlow2003, Gnanadesikan Reference Gnanadesikan, Kager, Pater and Zonneveld2004).
Thus, while the role of statistics is indisputable, the necessity, nature and strength of any universal biases are unclear, and actively debated. Complicating the picture is the fact that universal principles are often mirrored by language-particular statistics (Levelt & van de Vijver Reference Levelt, van de Vijver, Kager, Pater and Zonneveld2004, Zamuner et al. Reference Zamuner, Gerken and Hammond2005, Jarosz Reference Jarosz2010, Jarosz et al. Reference Jarosz, Calamaro and Zentzto appear), which makes it difficult to disentangle the independent contribution of universal biases and statistics in any particular case. What remains controversial, then, is the extent to which linguistic knowledge can be reduced to experience with the language input. With respect to the SSP, is the language input sufficient to support sonority projection? If not, what kind of restrictions or biases must be present to constrain learning? The present paper frames these questions by considering hypotheses falling along an increasingly universalist hierarchy, as schematised in (2).
-
(2)
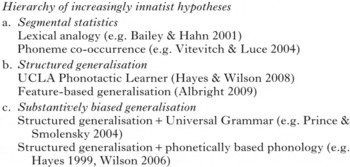
The weakest assumptions about innate constraints are made by the segmental statistics class of models, which posits sensitivity to statistics of unstructured segmental representations. At the next step of the continuum, structured generalisation posits statistical learning coupled with rich phonological representations (such as features, syllables, tiers and grids) and the capacity to state generalisations over these abstract representations. Finally, the class of models making the strongest assumptions, substantively biased generalisation (a term inspired by Wilson Reference Wilson2006), posits, in addition to structured generalisation, learning biases that reflect substantive phonetic or phonological preferences. Note that the category ‘lexicalist’ used elsewhere (e.g. Daland et al. Reference Daland, Hayes, White, Garellek, Davis and Norrmann2011) subsumes both segmental statistics and structured generalisation, and that substantively biased generalisation does not necessarily imply innate substance. Substantively biased generalisation is also compatible with the view that the SSP is phonetically grounded, and learned from universally shared experience with speech perception and articulation (e.g. Hayes Reference Hayes, Darnell, Moravcsik, Newmeyer, Noonan and Wheatley1999). The present paper abstracts away from many important differences within each of these levels, focusing primarily on evidence that can differentiate models falling into the structured generalisation class, as opposed to the substantively biased generalisation class.
After briefly reviewing the existing evidence that the segmental statistics hypothesis is inadequate, this paper focuses on pushing structured generalisation to its limits, and ultimately argues for its inadequacy. The test case is the SSP in Polish, examined through a computational analysis of acquisition. There are several contributions. First, §2 shows that Polish lexical statistics contradict the SSP, while the same statistics in English, Mandarin and Korean mirror the SSP. This establishes Polish as a strong test case for the structured generalisation hypothesis in the domain of sonority sequencing. Second, §3 examines the role of the SSP in the development of initial clusters of four children acquiring Polish, showing that SSP is a robust predictor of cluster production accuracy. Next, §4 shows that the SSP effect cannot be reduced to lexical statistics of Polish, and that the predictions of structured generalisation for Polish do not derive the SSP effect.Footnote 1 Finally, §5 presents the conclusions.
Before we delve in to the lexical statistics of Polish, the following sections take a closer look at how structured generalisation can successfully model sonority-projection effects in other cases.
1.1 Existing sonority-projection modelling findings
After demonstrating sonority projection in English experimentally using Likert and head-to-head acceptability ratings tasks, Daland et al. (Reference Daland, Hayes, White, Garellek, Davis and Norrmann2011) evaluate six lexicalist computational models’ abilities to capture sonority-projection effects. They trained all models on a corpus of both syllabified and unsyllabified phonetically transcribed words to explore the effect of syllable structure. Three of the models fall within the segmental statistics class outlined above. The classical bigram model (Jurafsky & Martin Reference Jurafsky and Martin2009) assigns probability to novel forms on the basis of the phoneme bigrams it contains. It has no notion of phonological structure, nor does it rely on features. The Phonotactic Probability Calculator (Vitevitch & Luce Reference Vitevitch and Luce2004) is similar, except that it maintains counts for bigrams and unigrams separately, according to the serial position within the word in which they occur. It also has no inherent notion of features or phonological structure. Finally, the Generalised Neighbourhood Model (Bailey & Hahn Reference Bailey and Hahn2001) is an analogical model that assigns scores to novel words on the basis of their similarity to existing lexical items. Similarity in this model is computed in terms of whole-phoneme insertions, deletions or substitutions. Insertions and deletions have a fixed context-free cost, while the cost of substitutions depends on the number of shared natural classes, resulting in a limited sensitivity to phonological features.
The other three models which Daland et al. consider fall to at least some degree within the structured generalisation class. The syllabic parser (Coleman & Pierrehumbert Reference Coleman, Pierrehumbert and Coleman1997) relies on syllable structure and stress, but it treats phonemes (and indeed entire onsets and rhymes) as atomic units, and has no capacity to generalise using phonological features. The UCLA Phonotactic Learner (Hayes & Wilson Reference Hayes and Wilson2008) constructs and weights constraints on sequences of natural classes. The featural bigram model (Albright Reference Albright2009) also relies on natural classes, assigning a score to novel strings on the basis of the most probable combinations of natural classes they contain. Both of these models are capable of generalising on the basis of phonological similarity, as measured by shared featural representations.
Daland et al. show that only the last two models, the UCLA Phonotactic Learner and the featural bigram model, are able to provide a good fit to the participants’ ratings on unattested clusters, with the Phonotactic Learner performing substantially better. All models perform better when trained on syllabified data, although the Phonotactic Learner does quite well with unsyllabified data as well. They conclude that two properties are essential for successful sonority projection: (i) the ability to generalise on the basis of phonological features, in particular features that can represent relative sonority, and (ii) the ability to represent and utilise phonological context or syllable structure to differentiate among clusters in different syllabic positions. On the basis of these results and the earlier reported findings that segmental statistics and lexical analogy cannot capture the behavioural results (Davidson Reference Davidson2006, Berent et al. Reference Berent, Steriade, Lennertz and Vaknin2007), it is clear that the segmental statistics class of hypotheses must be rejected and that at least structured generalisation is necessary.
What about Mandarin and Korean? Hayes (Reference Hayes, Lee and Zee2011) shows that, given appropriate representations, the UCLA Phonotactic Learner can produce sonority projection when trained on toy languages with distributions like those in Mandarin and Korean, and even on a toy language with strict CV syllables. Hayes equips the UCLA Phonotactic Learner with a ‘modest’ UG (Daland et al. Reference Daland, Hayes, White, Garellek, Davis and Norrmann2011: 226–227, Hayes Reference Hayes, Lee and Zee2011: 836) of 32 constraints referring to binary combinations of single-feature natural classes defined in terms of the features [syllabic, consonantal, approximant, sonorant], such as *[+son][−approx]. These constraints effectively militate against sequences of sonority thresholds. The toy language Bwa has only CV and OGV syllables, while the toy language Ba has only CV syllables.Footnote 2 Hayes shows that in both cases the learner is able to project SSP preferences on the basis of the input. The basic intuition behind why this is possible is that the learner generalises broadly on the basis of observed sonority-sequencing patterns at the beginnings of words, including the rise from a singleton onset into the vowel. The input provides support for word-initial sonority rises of varying degrees, with nearly all words providing positive support for sequences like #[…syllabic][…consonantal], some words providing support for larger rises like #[…sonorant][…consonantal] and none providing support for reverse sequences like #[…consonantal][…sonorant]. Therefore, without stipulating the direction of sonority-sequencing preferences, learners with these representations can detect that Ba and Bwa favour rises at the beginnings of words. Notice, however, that these simulations are set up to focus the learner's attention on word-initial sequences up to the vowel, in effect providing syllabic context and a universal bias to treat prevocalic sequences separately from postvocalic sequences, which is part of the substantive content of the SSP. Nonetheless, the fact remains that a model with no built-in preference about sonority sequencing in initial position per se, other than to base these preferences on the onset + vowel combination, can detect a lexical preference consistent with the SSP.
To summarise, existing modelling results on sonority projection in Mandarin, Korean and English support rejection of the segmental statistics class of hypotheses, showing that sensitivity to syllabic context and the ability to generalise using features is essential, while the success of structured generalisation shows there is lexical evidence for the SSP in these languages at an abstract level.
1.2 Pushing structured generalisation to its limits
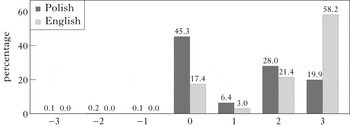
The fact that lexicalist models succeed in projecting SSP preferences in English, Mandarin and Korean means these languages do not provide a true poverty of the stimulus test for sonority projection. Indeed, Hayes’ Ba example reveals there can be no (natural) poverty of the stimulus test case for sonority projection. Cross-linguistically, languages that allow smaller sonority rises also allow larger sonority rises, which forms an essential part of the empirical foundation for the SSP. This means that the more impoverished the inventory of consonant clusters in a language, the more skewed the distribution in that language must be toward favouring sonority rises. The light bars in Fig. 1 depict this distributional skew for English, showing the relative proportion of various sonority-rise degrees in word-initial clusters in the English lexicon. These proportions are based on the type frequencies of English word-initial clusters, estimated from the CMU Pronouncing Dictionary, as reported by Hayes & Wilson (Reference Hayes and Wilson2008). They utilise a coarse-grained five-level sonority scale, vowel > glide > liquid > nasal > obstruent (Clements Reference Clements, Kingston and Beckman1990), also used by Daland et al. (Reference Daland, Hayes, White, Garellek, Davis and Norrmann2011) and Hayes (Reference Hayes, Lee and Zee2011) in their simulations.Footnote 3 The lexical support for the SSP is evident in this figure: relative frequency dramatically increases with the rise in sonority. At a more abstract level, the lexicon shows substantial support for rises (82.6%), minimal support for plateaus (17.4%) and no support whatsoever for falls (0%). The analogous distribution for Mandarin and Korean is easy to imagine: the entirety of the distribution (100%) would be concentrated on large sonority rises, also providing lexical bias in support of SSP.
Relative frequency of sonority rises in Polish and English.

If even an impoverished input distribution with purely CV syllables supports SSP projection, how can the predictions of structured generalisation be disentangled from those of the SSP? The answer is that the models must be tested on cases where the statistical trends in the lexicon actually contradict those of the SSP, and for that to be possible, the language input must be rich in SSP violators. The next section shows that Polish provides such a test case. Since Polish allows all sonority combinations, it is possible to examine the phonological development of various sonority profiles in Polish, to determine whether evidence of a preference for higher rises can be observed. As discussed above, some of the strongest arguments for the necessity of universal biases come from developmental findings that demonstrate children's sensitivity to generalisations that are apparently unsupported by their language input. For lexicalist models to subvert the need for universal biases, they not only have to account for the evidence of universal bias in adults’ grammars, but they also have to contend with the evidence of biases in development.
To summarise, the specific questions addressed in the present work are: (i) does structured generalisation predict sonority-projection effects for Polish, (ii) do children acquiring Polish exhibit sensitivity to the SSP and (iii) do predictions of structured generalisation capture children's sonority preferences? The paper argues that the answers (respectively no, yes and no) provide evidence to reject unbiased structured generalisation.
2 The input
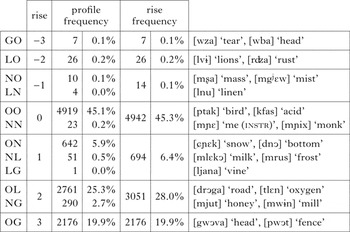
Polish is well known for allowing SSP-violating clusters falling along all points of the scale in (1). Examples are given in Table I below, and a list of initial clusters is provided in Table VIII in the online supplementary materials. While it is often acknowledged that sonority falls and other more complex configurations (e.g. trapped sonorants) are rare, often found in only a few lexical items, there is no shortage of obstruent-initial clusters with varying degrees of rise in Polish. Nonetheless, formal analyses of syllable structure show that the SSP is active in the phonology of Polish (Bethin Reference Bethin1984, Reference Bethin1987, Rubach & Booij Reference Rubach and Booij1990, Gussmann Reference Gussmann1992, Jarosz Reference Jarosz2006). There are a number of productive phonological and morphological processes that depend on sonority sequencing. For example, voicing assimilation is normally blocked by a sonorant, unless that sonorant is flanked on both sides by obstruents ([krfi] ‘blood’) or is word-final preceded by an obstruent ([vjadr#vɔjεnnɨ] ‘war wind’), exactly where SSP violations are relevant (Bethin Reference Bethin1984, Rubach & Booij Reference Rubach and Booij1990, Gussmann Reference Gussmann1992). There are also two morphophonological alternations, involving comparative and imperative allomorphy, where the choice of the allomorph is driven by sonority-sequencing considerations (Bethin Reference Bethin1987, Rubach & Booij Reference Rubach and Booij1990).
Sonority profile and sonority rise type frequency in CDS.

To determine the relative frequency of initial clusters and sonority profiles in Polish, counts were estimated from the largest available frequency dictionary of child-directed speech in Polish (Haman et al. Reference Haman, Etenkowski, ńuniewska, Szwabe, Dąbrowska, Szreder and ńaziÑski2011). This corpus includes about 800,000 word tokens and about 44,000 word types of speech directed at 128 children aged 0;10–6;11. About 34,000 of these word tokens come from a sample of speech directed at the four children in the Weist-Jarosz corpus whose phonological development is analysed in the next section (Weist et al. Reference Weist, Wysocka, Witkowska-Stadnik, Buczowska and Konieczna1984, Weist & Witkowska-Stadnik Reference Weist and Witkowska-Stadnik1986, Jarosz Reference Jarosz2010, Jarosz et al. Reference Jarosz, Calamaro and Zentzto appear). The Polish CDS dictionary was manually culled to remove misspellings, abbreviations and acronyms (e.g. USB), exclamations (e.g. mhmmmm) and a small number of unassimilated foreign words (e.g. huckleberry). Removing these items resulted in a corpus of about 43,000 word types.
This sample of child-directed speech was then transcribed phonetically, using automatic methods based on standard pronunciation in Polish, whose orthography is highly regular (Demenko et al. Reference Demenko, Wypych and Baranowska2003). The transcription conventions were adapted to match those used in the child-speech corpus analysed in the following section. Similar automatic methods have been used to construct many other child-directed speech corpora in a variety of languages (see e.g. Batchelder Reference Batchelder2002, Blanchard et al. Reference Blanchard, Heinz and Golinkoff2010, Jarosz & Johnson Reference Jarosz and Johnson2013).
This process produced a corpus with nearly 11,000 word types and 115,000 word tokens beginning with biconsonantal clusters. The primary focus of the analyses of the following sections is on type frequency, as it is type frequency that has been most fruitfully used for modelling phonotactic and phonological generalisation learning in previous work (Albright & Hayes Reference Albright, Hayes and Maxwell2002, Becker et al. Reference Becker, Ketrez and Nevins2011). However, because many prior studies examining spontaneous production in children find token frequency to be predictive of developmental trends (Roark & Demuth Reference Roark, Demuth, Howell, Fish and Keith-Lucas2000, Stites et al. Reference Stites, Demuth, Kirk, Brugos, Micciulla and Smith2004, Kirk & Demuth Reference Kirk and Demuth2005, Zamuner et al. Reference Zamuner, Gerken and Hammond2005), including an earlier analysis of the child speech examined here (Jarosz et al. Reference Jarosz, Calamaro and Zentzto appear), token frequency was also calculated, and is considered in §1.1 of the online supplementary materials. The analysis focuses primarily on the coarse-grained SSP assumed in previous sonority-projection modelling studies. However, the corpus is also used to estimate frequencies for a finer-grained version of the sonority scale, and the consequences of this choice are explored in §1.2 of the supplementary materials. Finally, the corpus is used to estimate the type and token frequencies of the nearly 200 segmental combinations occurring in biconsonantal initial clusters and other word-initial onsets that are used for training computational models in §4.2.
Table I summarises the type-frequency estimates for sonority profiles (e.g. ON) and sonority rises (e.g. Rise = −2). The relative frequency of the sonority rises is also depicted graphically in Fig. 1 above, alongside the statistics already discussed for English. Clearly, sonority falls are indeed quite rare in Polish, accounting for less than 0.5% of the input combined. On the other hand, the input is rich with obstruents. Nearly all the input (96.4%) consists of obstruent-initial clusters, which is in principle compatible with the SSP; however, nearly half (45.1%) of these are OO combinations. Viewed alongside the English distribution, it is not obvious how the Polish distribution could give rise to an SSP preference. If anything, it appears that the input distribution most strongly favours the middle of the SSP scale, i.e. sonority plateaus.
3 Sonority-sequencing effects in acquisition
There have been several studies of syllable-structure development in Polish (ńukaszewicz Reference ńukaszewicz2006, Zydorowicz Reference Zydorowicz2007, Jarosz Reference Jarosz2010, Jarosz et al. Reference Jarosz, Calamaro and Zentzto appear). Jarosz (Reference Jarosz2010) examines the development of basic CV syllable structure, in particular the relative timing of the development of initial and final clusters, but does not examine the role of sonority sequencing. ńukaszewicz (Reference ńukaszewicz2006) does examine sonority-sequencing effects, but her focus is on extrasyllabic sonorants (sonorants that cannot be syllabified consistently with the SSP) and on processes that depend on it, like voicing. Consistent with the present arguments, she demonstrates that the SSP plays a role in children's development of these particularly marked configurations. However, since extrasyllabic sonorants are both rare and marked, her findings are not specifically relevant to the research questions being examined here. Zydorowicz (Reference Zydorowicz2007) examines cluster acquisition in all positions in the development of one child; her focus is primarily on whether the morphological complexity of clusters affects development. She identifies developmental trends for clusters of varying sonority profiles, but does not identify any general patterns concerning the role of the SSP. Finally, Jarosz et al. (Reference Jarosz, Calamaro and Zentzto appear) examine the acquisition of syllable structure and how it relates to input frequency, showing developmental trends for onset clusters at the sonority level, but they do not systematically explore the role of the SSP. In sum, while there are a number of studies of cluster acquisition in Polish, the role of the SSP in initial cluster development is not well understood.
The data for the analysis in this paper comes from the Weist-Jarosz corpus of spontaneous child speech (Weist et al. Reference Weist, Wysocka, Witkowska-Stadnik, Buczowska and Konieczna1984, Weist & Witkowska-Stadnik Reference Weist and Witkowska-Stadnik1986, Jarosz Reference Jarosz2010, Jarosz et al. Reference Jarosz, Calamaro and Zentzto appear), available via CHILDES (MacWhinney Reference MacWhinney2000). The corpus includes 2303 phonetically transcribed spontaneous productions of biconsonantal initial clusters spoken by four typically-developing children aged 1;7 to 3;2. The corpus provides word-by-word alignment between children's actual productions and their target pronunciations. All word-initial clusters are considered in the analysis, with the following exceptions: utterances involving onomatopoeia, wordplay, child-specific forms, incomplete word tokens, wholly or partially unintelligible word tokens, continuations of adult prompts and repetitions and memorised passages. These cases are systematically marked in the corpus as such, and can be removed automatically.
Since the corpus aligns each word with its target pronunciation, it is straightforward to determine whether the initial cluster is produced accurately. Because the focus in this analysis is on the acquisition of sonority-sequencing patterns word-initially, accuracy is coded after translating both the target and actual pronunciations to their respective sonority classes. This means that substitutions along other dimensions like place or voice (e.g. substituting [ɕ] for [»], a common pattern) do not count as errors, as long as the child produced the target sonority profile for the initial cluster.
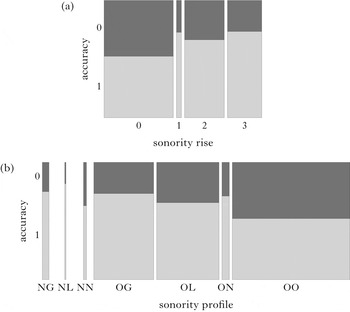
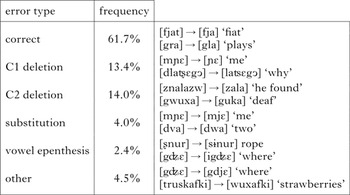
The children targeted seven sonority profiles in their productions.Footnote 4 4Given the rarity of sonority falls in adult speech and in the lexicon, it is not surprising that young children's spontaneous productions include hardly any attempts at these clusters. Nonetheless, the data provides a representative sample of plateaus and rises of various degrees. Overall, children produce clusters with the target sonority profile 61.7% of the time. Error types, their relative frequencies and example productions are shown in Table II. The vast majority of errors are deletions of the first (13.4%) or second consonant (14%), or changes in sonority of one or both consonants (4%). Vowel epenthesis occurs in only 2.4% of the cases, and other scattered errors occur in the remaining cases (4.5%).Footnote 5 The mosaic plots in Fig. 2 show the proportion of accurate responses for each sonority rise degree and sonority profile. These figures reveal that accuracy depends on the sonority sequencing of the cluster, with more accurate productions for higher sonority rises, and that this occurs despite children's more frequent attempts to produce lower sonority rises.
Accuracy by (a) sonority rise; (b) sonority profile. Shading indicates the proportion of accurate responses for each category, and the width of each bar is proportional to the number of tokens in the children's production data corresponding to each cluster type.

Error types and frequencies.

Since the spontaneous production corpus is not balanced, logistic regression was used to determine whether the effect of SSP is significant after controlling statistically for a number of potentially confounding variables. This approach follows a number of recent studies utilising regression-modelling strategies to analyse spontaneous corpus data (Jaeger Reference Jaeger2010, Jarosz & Johnson Reference Jarosz and Johnson2013, Bane et al. Reference Bane, Graff and Sonderegger2014, Jarosz et al. Reference Jarosz, Calamaro and Zentzto appear). The logistic regression models were fitted using the lrm() function in the RMS package for R (Harrell Reference Harrell2017), which provides convenient methods for validating the resulting models.
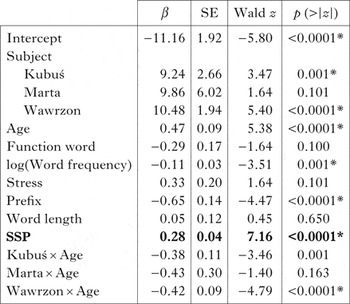
The dependent variable is Accuracy, and the predictor of interest is SSP. The data are also coded for a number of control predictors. Age (a continuous variable measured in months) is included to account for developmental progression over time. To account for individual differences in overall production accuracy, Subject is included as a four-level factor, dummy-coded with Bartosz as the reference level.Footnote 6 Because children's phonological development often proceeds at different rates, the interaction of Subject and Age is also included. To control for the possibility that mere experience with a particular word-form affects the accuracy with which it is produced, log(Word frequency) is included as a predictor.Footnote 7 Also included are four predictors to control for potential effects of the prosodic and morphological contexts in which these clusters occur. This includes Word length (counted in number of syllables), Stress (a binary variable indicating whether the syllable the cluster initiates carries primary stress),Footnote 8 Function word (a binary variable indicating whether the cluster occurs in a closed-class word) and Prefix (a binary variable indicating whether the cluster is morphologically complex, i.e. composed of a monoconsonantal fricative prefix (orthographic z or w), followed by a singleton consonant). Effects of prosodic position and prominence have been repeatedly observed in child-production studies (see e.g. Fikkert Reference Fikkert1994, Demuth Reference Demuth1995), and morphological factors have also been found to affect production (Zydorowicz Reference Zydorowicz2007), so these predictors are included to ensure the observed effects of SSP are not attributable to imbalances in the distribution of these factors.
The superset model with the SSP and the control predictors is shown in Table III. The main finding is that the SSP is positively associated with production accuracy, i.e. after statistically controlling for all of the above potential confounds, the model indicates that children produce clusters with higher sonority rises more accurately. Nested model comparison with the base model shows SSP is highly significant (χ2(1) = 52.7, p<0.0001). Although the control predictors are not the focus of this analysis, it is worth noting that their contributions to the model are sensible. Production accuracy increases with age, although the degree to which this occurs varies by child. Clusters resulting from the concatenation of monoconsonantal prefixes and singleton onsets are produced significantly less accurately. Since these prefixes express verbal aspect, this is consistent with the well-known tendency for children to omit functional, morphosyntactic markers in spontaneous speech (and indeed the only difference in the error patterns for these clusters is a higher rate of deletion of the first consonant, i.e. the prefix). Clusters at the beginnings of stressed syllables tend to be more accurate and those in closed-class items less accurate, although these effects only tend toward significance. Finally, word frequency is negatively associated with production accuracy, suggesting that children are more likely to reduce clusters in common words.
Logistic regression model predicting cluster production accuracy. * indicates significance at the p<0.05 level.

To examine the robustness of the SSP predictor to fluctuations in the data sample, the validate() function in the RMS package was used to obtain bootstrap samples, calculate model optimism and perform backwards elimination on the bootstrapped models. Out of 200 bootstrap-validation samples with backward elimination, the SSP was retained in the model 200 times. Furthermore, the model shows a small amount of shrinkage: the original Dxy is 45.5, the optimism is 0.011 and the corrected Dxy is 44.4. This is substantially higher than the corrected Dxy of the base model that excludes the SSP (40.9). While these findings depend on the particulars of this corpus, the results of the validation procedure provide some reassurance that the role of the SSP is robust in this data sample.
4 Predicting developmental effects
This section examines in detail the predictions that structured generalisation makes for sonority sequencing in Polish. Three approaches to modelling sonority projection are considered and rejected. §4.1 examines the relationship between frequency in the input, the SSP and accuracy. §4.2 generates predictions using the UCLA Phonotactic Learner in two ways: first by allowing the learner to induce its own constraints based on a corpus of segment-level word-initial onsets (§4.2.1), and second by weighting a prespecified set of sonority sequencing constraints as in Hayes (Reference Hayes, Lee and Zee2011) (§4.2.2). For sonority projection to be successful, the models must account for the developmental SSP effect and generate systematic preferences for larger rises over smaller rises, and smaller rises over plateaus. None of the models generates these predictions on the basis of the Polish input distribution.
4.1 Raw segmental and class frequency
The first step in determining whether frequency in the input could account for the developmental results presented in the preceding section is to better understand how input frequency is associated with production accuracy and the SSP. In addition to examining the type-frequency distribution over sonority profiles and rises in Table I, the section also considers the frequency of initial segmental bigrams (i.e. clusters; shown in Table VIII in the supplementary online materials).
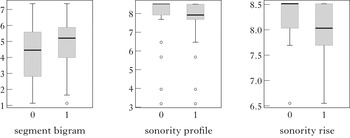
Figure 3 summarises the association between children's production accuracy and three measures of log type frequency: frequency of initial segmental bigrams, frequency of sonority profiles and frequency of sonority rises. If variation in the production accuracy of initial clusters is driven by one of these measures, higher frequency on that measure (i.e. higher placement of each box and/or line) should be associated with higher production accuracy (i.e. the 1's as opposed to the 0's in the plot). As the box and whisker plots illustrate, a positive association, with higher overall frequencies for correct productions, is found only for segmental bigrams. For sonority profiles and rises, lower frequency is associated with higher production accuracy. This is not the association one would expect if frequency of these classes were driving development directly.
Association between accuracy and log type frequency for incorrect (0) and correct (1) productions. Each plot shows the median (horizontal line), the upper and lower quartiles (the box) and the maximum and minimum (the whiskers), excluding any outliers (the circles).

Given that higher rises are predictive of higher production accuracy, this suggests that class-level frequency of sonority profiles and sonority rises is unlikely to yield sonority projection. This is confirmed by examining the rank correlation (Kendall's t) between each of these frequency measures and the SSP for all the cluster types targeted by the children. For segmental bigrams there is a weak positive correlation between frequency and the SSP (τ = 0.289), while for sonority profiles (τ = −0.657) and sonority rises (τ = −0.737) the correlations are negative. Therefore, while it is in principle possible for sonority projection to occur on the basis of segmental bigram type frequency, the class-level frequencies, at least when used directly, predict anti-SSP preferences. This is not surprising, given the earlier figures showing that sonority plateaus are the distribution mode in Polish.
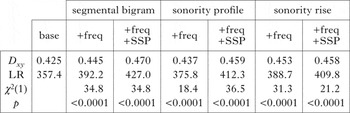
The strongest test of these raw frequency measures is a nested model comparison including all the control predictors discussed above plus each frequency measure, compared to a superset model that also includes the SSP. If the superset model provides a significantly better fit to the developmental data that warrants the extra degree of freedom (as determined by a χ2 test), this means that the frequency measure does not account for the effect of SSP on production accuracy. If, on the other hand, a measure fully accounts for the SSP effect, the SSP predictor in the superset model would be superfluous. Table IV summarises the results of these nested comparisons for each of the frequency measures. Segmental bigram frequency is a significant predictor of production accuracy after all control predictors are included in the model (χ2(1)=34.8, p<0.0001). Higher segmental frequency is associated with more accurate production (β=0.235, z=5.84, p<0.0001). However, the superset model with both segmental frequency and SSP is superior (χ2(1)=34.8, p<0.0001), indicating that segmental bigram frequency does not subsume the effect of the SSP on production accuracy. 200 bootstrap validation samples confirm that the SSP is always retained in the model.
Summary of model comparisons for type frequencies. LR=likelihood ratio statistic; D xy =Somers' rank correlation; χ2=improvement in fit as compared to the base model.

Both sonority profiles (β=−0.256, z=−4.05, p<0.0001) and sonority rises (β=…0.657, z=−5.39, p<0.0001) are predictive of accuracy, but in the wrong direction, as expected from the above discussion: lower frequency is predictive of higher accuracy. More importantly, in both cases the superset model with the SSP is superior, indicating that these measures do not subsume the SSP effect. Finally, the 200 bootstrap-validation procedure confirms that SSP is retained on all 200 samples for sonority profiles and 199 samples for sonority rises, while the frequency measures are dropped in each case, indicating they are not reliable predictors of accuracy.
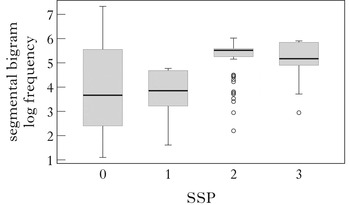
To summarise, none of these measures directly supports sonority projection. Sonority profile and sonority rise class frequency predict anti-SSP preferences. Segmental bigram frequency is predictive of production accuracy, and is weakly positively correlated with SSP. However, this measure reflects properties of clusters that are at least partially orthogonal to SSP, since both predictors remain highly significant in a superset model. The box and whisker plot in Fig. 4 shows why segmental bigrams fail to fully account for the SSP effect. While there is a noticeable upward trend as the sonority rise increases (accounting for the positive correlation), the range of frequency values for plateaus (SSP = 0) essentially overlaps the entire range of values for each of the other rise degrees, some of which overlap one another almost entirely (SSP = 2 and SSP = 3). This means it is not possible to reliably predict on the basis of these frequencies that sonority plateaus (SSP = 0) should be systematically disfavoured in comparison to all other sonority profiles. Likewise, it is not possible to predict that moderate rises (SSP = 2) should be disfavoured compared to large rises (SSP = 3).
Association between segmental bigram type frequency and SSP.

4.2 The UCLA Phonotactic Learner
This section explores whether the computational model that has shown the greatest capacity for sonority projection in previous work on other languages (Daland et al. Reference Daland, Hayes, White, Garellek, Davis and Norrmann2011, Hayes Reference Hayes, Lee and Zee2011), the UCLA Phonotactic Learner (Hayes & Wilson Reference Hayes and Wilson2008), can capture the observed developmental SSP effect in Polish.
4.2.1 Inducing constraints from scratch
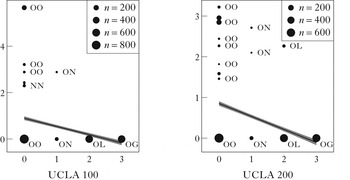
This section utilises the modelling strategy which Daland et al. (Reference Daland, Hayes, White, Garellek, Davis and Norrmann2011) used to show sonority projection for English, except that the training data are limited to initial onsets. As discussed earlier, Daland et al. found that all models performed better with syllabified data, as this enables models to state generalisations separately for onset and coda consonant sequences. Limiting the model to initial onsets simplifies the learning problem. In other respects the set-up follows Daland et al.; in particular, all initial onsets, together with their segmental type frequencies, are included in the training data, including null, singleton, biconsonantal and longer consonant sequences. The singleton onsets account for the vast majority of the data: while the type frequency of biconsonantal clusters is about 11,000, the type frequency of singleton onsets is over 26,000 and the frequency of singleton obstruents alone is over 19,000. This presumably gives the model the best possible chance to discover a preference for word-initial rises, since OV sequences represent the largest possible rise, and are abundantly represented in the data. Three models are considered, with cut-offs on the number of induced constraints at 100, 200 and 300. The trained models are tested on the biconsonantal clusters targeted by the children and evaluated on their ability to predict accuracy.
Figure 5 displays the association between the SSP and the scores assigned to biconsonantal clusters according to the 100-constraint and 200-constraint models. As explained below, the 300-constraint model results mirror those of the 200-constraint model, and are not illustrated. The scores are the summed violations of the weighted constraints, and should be interpreted as penalties. Successful sonority projection therefore requires lower scores for higher rises. The regression line plotted in the figure shows that this is indeed the direction of the association predicted by the models. This is because the models pick out particular segmental combinations to penalise, and these tend to be lower SSP clusters. However, the scatterplot also shows that the model assigns a penalty only to a small portion of the clusters targeted by the children: most of the clusters receive no penalties. Comparing the 100-constraint to the 200-constraint model reveals that the 200-constraint model induces additional constraints to penalise specific segmental combinations, and these include some constraints against larger rises as well as additional small rises and plateaus. Not surprisingly, the additional constraints in the 200-constraint model tend to penalise low-frequency clusters. As the learner induces more constraints, it penalises more and more of the attested clusters, but rather than penalising sonority plateaus as required for successful sonority projection, the model is simply inducing constraints that allow it account for the rarity of low-frequency clusters in the segmental type-frequency distribution. OO sequences in Polish have widely varying frequencies (recall the wide distribution in Fig. 4), and some are underrepresented. The fact that the correlation between the model scores and the segmental bigram type frequency increases from the 100-constraint model (τ = −0.312) to the 200-constraint model (τ = −0.426) to the 300-constraint model (τ = −0.474) is consistent with this claim. The model is doing what it is designed to do: induce constraints to penalise underrepresented patterns, and while particular sonority plateaus are underrepresented, sonority plateaus in general are not.
Association between model predictions and SSP. The y-axis shows average model scores (penalties). The size of the dots in the scatterplot is proportional to the frequency of those target clusters in the children's productions.

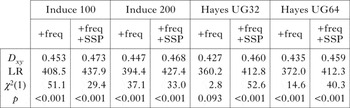
As before, the strongest test of the models is whether they can capture the SSP predictor in a nested model comparison. The results of these model comparison evaluations are summarised on the left of Table V. Qualitatively, these models show the same pattern of results as the segmental type frequency of the preceding section. Model scores are significant predictors of children's production accuracy (100: χ2(1) = 51.1; 200: χ2(1) = 37.1, p<0.0001), and higher scores (e.g. penalties) are predictive of lower accuracy for both the 100-constraint model (β = …0.276, z = …6.96, p<0.0001) and the 200-constraint model (β = …0.352, z = −6.07, p<0.0001). However, neither model can capture the SSP effect. SSP is highly significant in a nested model comparison for both the 100-constraint model (χ2(1) = 29.4; p<0.0001) and the 200-constraint model (χ2(1) = 33.0; p < 0.0001). For both models, bootstrap validation retained SSP on 200 out of 200 samples. The predictor based on the 100-constraint model was retained on all 200 samples, while the predictor based on the 200-constraint model was somewhat less reliable, retained on 193 samples. The results for the 300-constraint model are nearly identical to those for the 200-constraint model.
Summary of statistical tests for UCLA Phonotactic Learner predictions.

To characterise the models’ failure to capture SSP in alternative terms, we can consider just those clusters to which the 200-constraint model assigns no penalties whatsoever. Restricting attention just to these ‘perfect’ clusters, SSP is a significant predictor (χ2(1) = 32.5, p<0.0001). This means there are robust effects of the SSP on production accuracy that these models are failing to capture.
In sum, the UCLA Phonotactic Learner induces constraints that penalise underrepresented clusters. While children are generally less accurate on the penalised clusters, these phonotactic constraints do not reflect the SSP in general, which remains highly significant in nested model comparisons.
4.2.2 Weighting prespecified sonority threshold sequencing constraints
The previous section showed that the UCLA Phonotactic Learner induces constraints for Polish that do predict sonority projection. However, perhaps if the learner is restricted to working with Hayes’ ‘modest’ UG of 32 constraints, which worked for Ba and Bwa, it will be more successful.
Recall that Hayes’ constraint set includes constraints on combinations of sonority thresholds as defined by the features [syllabic, consonantal, approximant, sonorant]. The set includes SSP-abiding constraints like *[+son][…approx], as well as anti-SSP constraints like the reverse *[…approx][+son]. It therefore does not directly encode pro-SSP preferences: it allows the opposite preferences to be discoverable in principle. However, because the constraints refer to sonority thresholds, the constraints are in stringency relationships, substantially constraining the learner. The learner cannot reproduce arbitrary frequency distributions over sonority profiles with this constraint set. For example, there is no way for the learner to penalise (only) ON combinations, which happen to be underrepresented in Polish. It could weight *[…son][+son] heavily, but this constraint penalises all OR sequences (where R = sonorant), which are common overall.
The reader may have noticed that there are in fact 64, not 32, possible combinations of four binary features in two positions. Hayes’ set of 32 constraints includes only those constraints that penalise opposing sonority thresholds, such as *[+son][−son] and *[−son][+son] (Daland et al. Reference Daland, Hayes, White, Garellek, Davis and Norrmann2011: 226–227). It does not include constraints penalising sonority-threshold combinations that refer to the same side of the sonority scale, such as *[+son][+son] or *[…son][…son]. This means the set of 32 constraints is also restricted, in that it cannot penalise (only) combinations of high-sonority segments or (only) combinations of low-sonority segments. Returning to the ON example, the set of 32 constraints do not provide a way to penalise this low + low sonority combination: constraints such as *[…son][…approx] are not available.
To examine the consequence of this restriction, the results of simulations with both the 32-constraint set and the full 64-constraint set are presented. As in the previous section and in Hayes’ Ba and Bwa simulations, the training set includes all word-initial onsets. The test set once again contains the biconsonantal clusters targeted by the children. Since the constraints distinguish segments on only four manner features, only sonority distinctions are representable by this system. Accordingly, for these simulations, the segments in the training and test sets are represented by their respective sonority classes (O, N, L, G and V) and their frequencies collapsed.
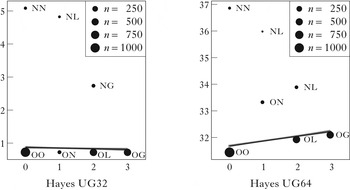
The predicted sonority-sequencing preferences of both models are depicted in Fig. 6. The model with 32 constraints primarily penalises sonorant-initial clusters. Obstruent-initial clusters receive scores close to zero. Since obstruent-initial clusters account for more than 90% of the data, it is not surprising that the regression line shows hardly any relationship to SSP. If the model has the ability to detect anti-SSP preferences, why did it not do so for Polish? The reason is that the 32-constraint set is so limited that only strong evidence of a statistical preference for word-initial sonority falls would be expected to trigger an anti-SSP generalisation. Because initial sonority falls are not common in Polish, accounting for less than 0.5% of the lexicon, the model does not predict an anti-SSP preference. Indeed, an anti-SSP preference would be expected with this constraint set only for languages that predominantly have sonority falls across all onset + vowel combinations.
Association between model predictions and SSP.

The 64-constraint model has more freedom to match the observed distribution in Polish. It penalises all observed clusters, sonorant-initial clusters most heavily, and it also manages to penalise the underrepresented ON clusters. It does this by highly weighting various constraints penalising high + high sonority combinations (ONV, OLV and OGV, but not OOV) and penalising low + low sonority combinations (OOV, ONV and NNV, but not OLV or OGV). This allows ONV to accumulate violations from both sets of constraints, while OOV and OLV violate only a subset of these. Importantly, constraints against high + high combinations are also supported by the singleton onsets, which are primarily OV. The additional ‘unidirectional’ constraints in this set are crucial for these predictions, which in this case are unwelcome. Because of the constraints’ availability, the learner incorrectly generalises from the singleton onsets that high + high combinations (e.g. GV) should be disfavoured when they occur in complex onsets (e.g. OGV). As a consequence of the improved fit to the sonority profile frequency distribution in the data, the 64-constraint model makes worse predictions from the perspective of the SSP, predicting higher penalties for higher sonority rises on average. In general, this simulation demonstrates that generalising from the singleton CV transitions does not always produce desirable consequences.
The model comparisons in Table V confirm the above conclusions statistically. The predictor based on the 32-constraint model is only marginally significant (χ2(1)=2.8, p=0.093). This weak association goes in the wrong direction, and backwards elimination using bootstrap validation drops it. The superset model with SSP included is superior (χ2(1) = 52.6, p<0.0001), and SSP is retained on all bootstrap-validation samples. Finally, the predictor based on the 64-constraint model patterns similarly, except that it is a significant predictor (in the wrong direction) in the model without SSP (β = 0.238, z = 3.6, p<0.001). In the majority of bootstrap-validation backward elimination samples, the predictor is dropped. SSP, on the other hand, is highly significant in the superset model (χ2(1) = 40.3, p<0.0001) and is retained in all bootstrap-validation backward elimination samples.
To summarise, two restricted constraint sets penalising combinations of sonority thresholds do not generate sonority projection for Polish as they did for Ba and Bwa. Indeed, the simulations demonstrate that unconstrained generalisation from CV transitions to CCV sequences can produce the unwelcome consequence of most strongly penalising complex clusters with the largest possible rises (OGV). For the learner to generalise as intended, something would have to prevent it from applying what it learns about CV transitions to the CV portion of CCV sequences. The learner would instead have to be compelled to apply these generalisations (only) to the CC portion of CCV, effectively encoding a built-in SSP bias.
5 General discussion and conclusion
To summarise, the major findings presented in this paper are as in (3).
-
(3)
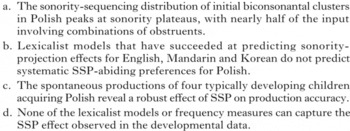
More generally, returning to the hierarchy of hypotheses laid out in the introduction, the results presented here are consistent with neither the segmental statistics nor the structured generalisation classes of hypotheses. They therefore suggest that some kind of universal pressure or bias is required to explain the robust effect of SSP on production. While the present findings support the need for universally biased phonological learning, they do not differentiate between various possible sources of this universal bias. The universal bias could be due to innate preferences of the phonological grammar, or it could be induced on the basis of phonetic difficulty. The results are as compatible with a bias that makes direct reference to the SSP as a grammatical principle as they are with a constellation of lower-level phonetic pressures that give rise to a similar preference scale. The conclusion supported by these findings is that phonological learning makes reference to substance in some way. Adjudicating between alternative notions of substance and universal bias is an important and difficult question that is beyond the scope of the present analysis.
These results significantly expand on and develop the arguments presented in previous work on sonority projection. This paper does not dispute the findings presented by Hayes (Reference Hayes, Lee and Zee2011) and Daland et al. (Reference Daland, Hayes, White, Garellek, Davis and Norrmann2011). The findings presented here are consistent with their conclusions that lexicalist models can give rise to sonority projection in English, Mandarin and Korean. Indeed, the argument put forward here is that the compatibility between the predictions of lexicalist models and the SSP for these languages is precisely why they are not the right languages to differentiate between these two hypotheses. This is not to say that the sonority-projection findings for these languages are not a significant discovery. On the contrary, the fact that sonority projection has been reliably demonstrated in numerous studies provides clear and consistent evidence differentiating between the segmental statistics and the structured generalisation classes of hypotheses, indicating that at least structured generalisation is necessary.
The primary contribution of this work is to expand the scope of this line of research to a language where the predictions of structured generalisation fall short. This opens the door to a deeper and more nuanced understanding of how universal bias may interact with structured generalisation. The developmental findings presented here provide initial evidence that reference to a universal bias of some sort is needed. Just as importantly, however, this paper highlights sonority sequencing in Polish as an important test case for further investigation. More generally, the results here highlight the importance and utility of integrating computational modelling with behavioural data on human learning. This paper has argued that at least structured generalisation is necessary to explain existing results on human learning of phonology and phonotactics, and has presented preliminary evidence that structured generalisation should be further enhanced with a universal bias. Given the complexity of these learning models, it is only by understanding the predictions of these and other explicit computational models that concrete hypotheses about learning can be tested and compared. Sonority sequencing in Polish provides an excellent example; only by generating predictions of explicit models positing a particular balance between the role of statistics, abstract representations and substantive biases can the ways in which existing models must be refined be understood.
While the present results have identified a potential universal bias at work in phonological learning in Polish, much remains to be discovered about the nature of this bias, the role it plays in various behavioural tasks and how its effects unfold over the course of phonological acquisition. Assuming that subsequent behavioural investigations confirm that the effect of SSP reliably shows up in early productions of children acquiring Polish, it remains to be determined whether or how this effect also affects perception, acceptability and other tasks, and how adult learners ultimately reconcile the preferences of the universal SSP scale with their language experience. Do adult Polish speakers exhibit sonority-projection effects for unattested, but licit clusters? Given that there is evidence that the SSP plays an active role in the phonology of Polish, these results also motivate further examination of how adult speakers’ productive knowledge of these processes depends on the combined effects of the SSP and the input statistics. A mutually informing link between computational modelling and behavioural studies is key to a further understanding of these and other essential questions about how phonological learning works.