Introduction
Chlorite, as one of the most hydroxyl-rich silicates, plays an essential role in the hydrated sections of the oceanic crust and has been hypothesized to function as a major water carrier in cold subduction zones (Peacock, Reference Peacock1990). It has been confirmed that chlorite remains stable even under high-pressure conditions exceeding 4 GPa (Fumagalli and Poli, Reference Fumagalli and Poli2005; Schmidt and Poli, Reference Schmidt and Poli1998), highlighting its capability to contribute significantly to the water supply deep within the Earth. In particular, Mg-rich clinochlore has been identified as the predominant aluminous phase in low-alkali hydrous peridotites at temperatures below 800°C (Jenkins, Reference Jenkins1981). The retention of structural OH groups and H2O within these minerals is vital for understanding their contributions to geochemical cycles and the mechanical properties of subduction zones. Thus, the study of chlorite’s properties and behaviours under various pressure and temperature conditions is crucial for elucidating water transport and storage mechanisms in subduction zones, which significantly affect the rheology and seismicity of the mantle.
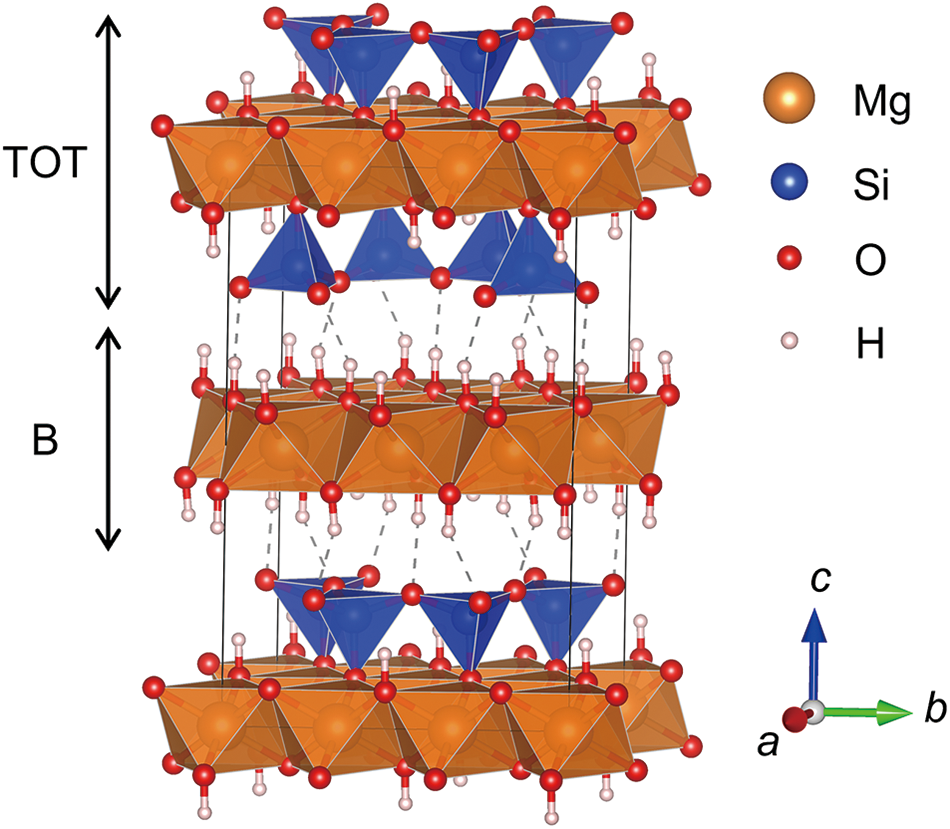
Clinochlore comprises two distinct polyhedral units: a brucite-like (B) layer formed of [MgO6] octahedra, and a talc-like (TOT or 2:1) layer consisting of two tetrahedral (T) sheets sandwiching an octahedral sheet of [MgO4(OH)2] (Fig. 1). This structural organization provides a model for studying the response of hydroxyl groups in the layer-structure silicate to external pressures in subduction zones. The general formula for clinochlore-group minerals is (Mg,Fe,Al)5–6(Si,Al)4O10(OH)8, with diversity in composition. The Mg-rich clinochlore is the most thermally stable and abundant mineral of the group, which can also incorporate a significant amount of Fe2+ in the end-member chamosite. Particularly, Brown and Bailey (Reference Brown and Bailey1962) identified 12 chlorite polytypes that arise from various stacking configurations of the TOT and B layers. These configurations differ by translations and reversals of the slant direction of the octahedral sheets within the polyhedral layers (Brown and Bailey, Reference Brown and Bailey1962). Of these, the monoclinic IIb-2 (C2/m) and triclinic IIb-4 ( $C\bar 1$) are the two most common polytypes in nature.
The structure of monoclinic C2/m clinochlore. Brucite-like (B) layers and talc-like (TOT) layers are connected by hydrogen bonds (dashed lines). Other cations similar to Mg (e.g. Al, Fe) are not shown.

Figure 1 Long description
The structure of monoclinic clinochlore, featuring alternating layers labeled as TOT and B. The TOT layer consists of two tetrahedral sheets sandwiching an octahedral sheet, while the B layer is composed of octahedra. The elements are represented by different colored spheres: magnesium as orange, silicon as blue, oxygen as red and hydrogen as white. The diagram includes a legend indicating these elements. An arrow on the left side denotes the direction of the TOT and B layers. A coordinate system at the bottom right shows the axes labeled as a, b and c.
Considerable research has been conducted on the high-pressure behaviour of chlorite, yet controversies persist regarding its phase transition under high pressures. Single-crystal studies conducted within a pressure range of 10–4 to 5.4 GPa revealed no significant structural changes in chlorite (Zanazzi et al., Reference Zanazzi, Montagnoli, Nazzareni and Comodi2006, Reference Zanazzi, Montagnoli, Nazzareni and Comodi2007). However, neutron diffraction experiments up to 5 GPa (Welch and Marshall, Reference Welch and Marshall2001) showed that while pressure does not enhance the strength of hydrogen bonds in clinochlore, it significantly narrows O–H···O angles from 170° to 155° and also reduces O–O distances. Extrapolating the data from Welch and Marshall (Reference Welch and Marshall2001) to higher pressures suggests that at ∼8 GPa, the O–O contact distance reaches a critical point of 2.7 Å, potentially leading to anomalous structural behaviour. Meanwhile, high-pressure Raman spectroscopy conducted by Kleppe et al. (Reference Kleppe, Jephcoat and Welch2003) identified an abrupt and significant increase in the δν/δP ratio for the hydrogen-bonded OH groups (Δν > 120 cm–1) at pressures between 9 and 10 GPa, suggesting a substantial reorganization of interlayer hydrogen bonding (Kleppe et al., Reference Kleppe, Jephcoat and Welch2003). Welch et al. (Reference Welch, Kleppe and Jephcoat2004) employed powder synchrotron X-ray diffraction (XRD) to study synthetic clinochlore, reporting a phase transition to a more compressible structure at 9–10 GPa (Welch et al., Reference Welch, Kleppe and Jephcoat2004). In conjunction with Raman spectroscopy data from Kleppe et al. (Reference Kleppe, Jephcoat and Welch2003), it was proposed that this transition was probably due to a distortion in the low-pressure IIb polytype, driven by unconventional behaviour in the interlayer hydrogen bonding rather than a polytypic phase transition. However, the recent single-crystal XRD study of clinochlore up to ∼20 GPa indicates a polytypic phase transition from IIb-4 to IIa-1 (Soldavini et al., Reference Soldavini, Comboni, Hanfland and Merlini2024). Overall, the high-pressure phase transition and the behaviour of hydrogen bonding and hydroxyl groups remain a subject of debate. For a deeper understanding of the structural variation underlying this behaviour, further high-pressure XRD and spectroscopic studies are necessary.
Our investigation into clinochlore is motivated not only by its potential role in transporting water into the upper mantle but also by the fundamental physical processes affecting hydroxyl groups under pressure. To fully comprehend the characteristics of hydrogen bonding in minerals under deep-Earth conditions, it is essential to integrate spectroscopic data with direct structural data obtained from diffraction experiments at high pressures. Though infrared (IR) spectroscopy serves as a critical tool for studying the arrangement of hydroxyl groups within mineral structures, high-pressure IR spectroscopic data have not yet been reported for clinochlore. Therefore, we have conducted high-pressure XRD and micro-IR spectroscopy on clinochlore in a diamond anvil cell (DAC) up to ∼20 GPa at 300 K, to elucidate the effects of pressure on chlorite structure and hydroxyl groups.
Materials and methods
Sample characterization and preparation
The sample of IIb-2 type clinochlore was supplied by the Geological Museum of Peking University. Powder X-ray diffraction (PXRD) measurements at ambient conditions were performed at the Analytical Instrumentation Center of Peking University (AIC-PKU). The experiment was conducted using PANalytical X’Pert3 Powder diffractometer equipped with a CuKα radiation source (λ = 1.5406 Å). Diffraction data were collected over the 2θ range of 3–70° with a step size of 0.02° and a total acquisition time of 10 minutes (Supplementary Fig. S1). The determined unit-cell parameters are: a = 5.362(1) Å, b = 9.258(2) Å, c = 14.428(1) Å, β = 96.970(17)°, and V = 710.9(3) Å3 (space group C2/m).
The bulk composition of clinochlore was obtained using an Inductively Coupled Plasma Optical Emission Spectrometer (ICP-OES, Agilent 720ES) at AIC-PKU. Prior to the measurement, ∼100 mg of clinochlore powder was subjected to acid digestion using nitric acid (HNO3) in Teflon beakers under controlled heating at 80°C for 12 hours. The resulting solution was diluted with deionized water to a fixed volume and filtered to remove any undissolved residues. The prepared solutions were introduced into the plasma via a concentric nebulizer operated at a sample uptake rate of 1.0 mL·min–1. The plasma power was set to 1.2 kW. Emission intensities were measured at the characteristic wavelengths (e.g. Mg: 279.553 nm, 285.213 nm; Fe: 239.563 nm, 259.940 nm; Al: 308.215 nm, 394.401 nm, 396.152 nm; Si: 250.690 nm, 251.611 nm, 288.158 nm) (Supplementary Table S1). Calibration was performed using multi-element standard solutions with concentrations of 0.5, 1.0, 5.0 and 10.0 mg·L–1, and a blank solution to ensure accurate background correction. Internal standards (Sc, Y) were used to monitor and correct for instrumental drift. The elemental concentrations obtained were converted to molar proportions and normalized accordingly, ensuring charge balance and consistency with the known structural framework of clinochlore. The stoichiometry of the sample is given as (Mg3.18Fe2+1.74Al1.07)(Si2.56Al1.44)O10(OH)8.
Prior to the high-pressure experiments, the sample was finely ground in an agate mortar and then heated at 120°C in a constant temperature furnace for 24 h to remove absorbed water. In the high-pressure XRD and IR experiments, compacted clinochlore powder was mounted in a symmetric-type DAC together with two ruby balls for pressure calibration. Culets with 400 μm in diameter and a stainless steel gasket preindented to 50 μm with a 200 μm hole were used. Clinochlore itself was used as the pressure-transmitting medium. The pressure was determined by the R1 fluorescence peak of ruby (Mao et al., Reference Mao, Xu and Bell1986).
High-pressure XRD experiments
High-pressure XRD experiments were conducted at the beamline 15U in Shanghai Synchrotron Radiation Facility (SSRF). The radiation spot size on the sample was < 3×4 μm in SSRF with wavelength λ = 0.6199 Å. The distance between the sample and the detector was calibrated using a CeO2 standard for all runs. Two-dimensional images were processed using Dioptas software (Prescher and Prakapenka, Reference Prescher and Prakapenka2015) to obtain the one-dimensional diffraction spectra. The powder diffraction patterns were analysed using the Rietveld method (Rietveld, Reference Rietveld1969) using the General Structure Analysis System (GSAS) program as implemented in the EXPGUI package (Toby, Reference Toby2001).
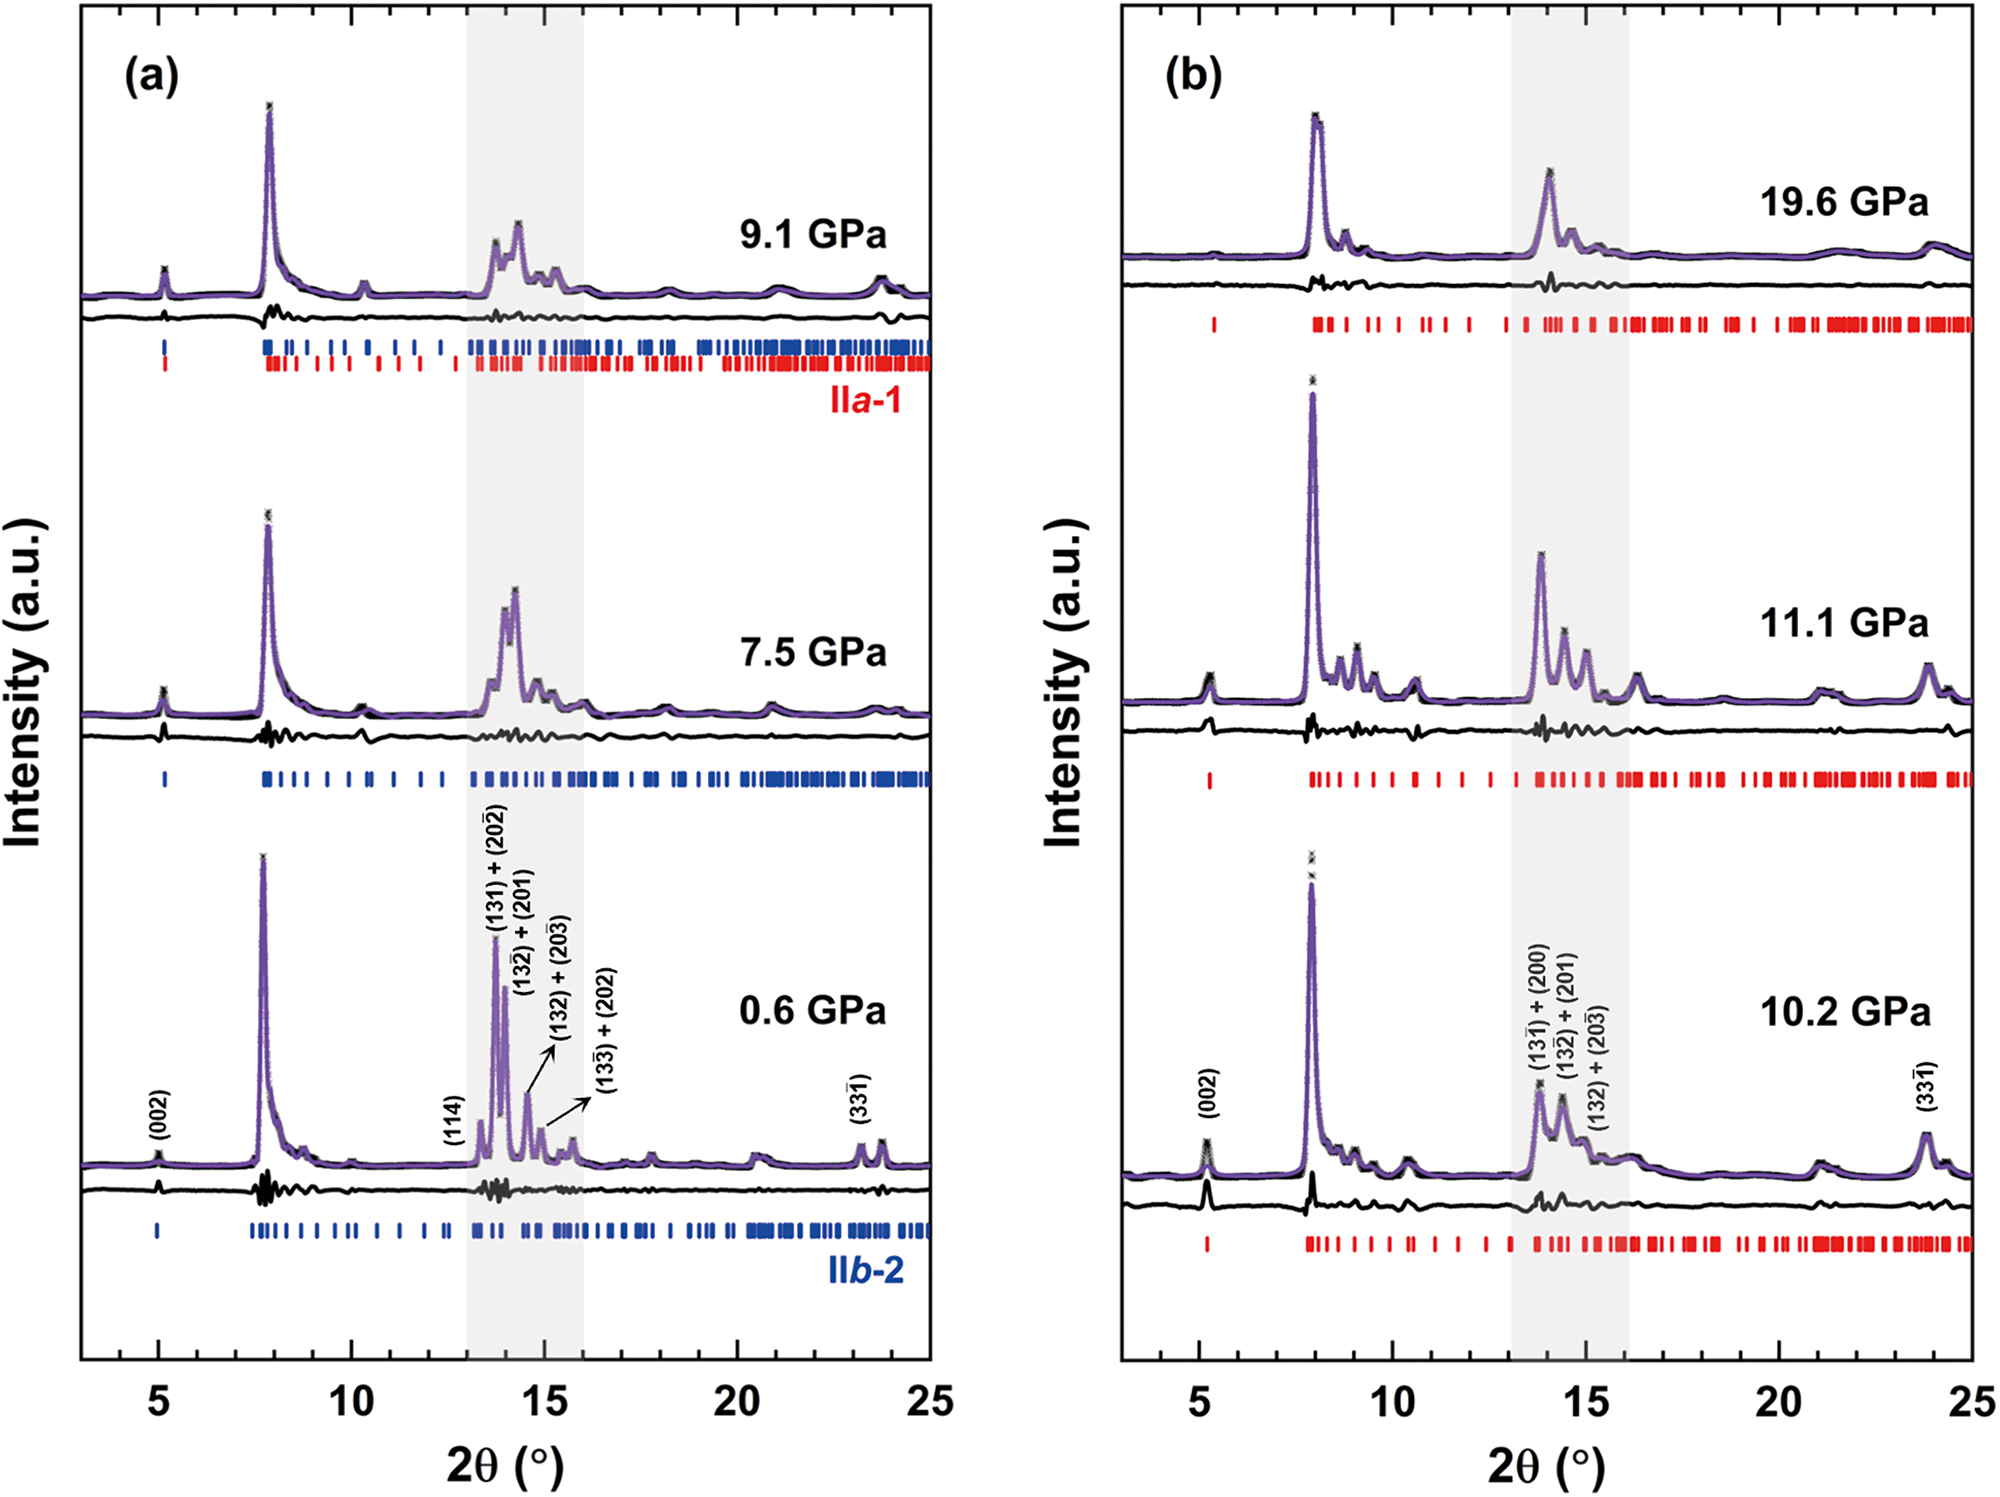
Selected X-ray diffraction patterns of (a) IIb-2 type clinochlore and (b) IIa-1 type clinochlore at high pressures. Rietveld refinements (purple curves) of observed XRD data (black dots) were carried out after background subtraction. The grey box highlights the 2θ range of 13–16° (d = 2.74–2.23 Å).

Figure 2 Long description
Three X-ray diffraction line traces at different pressures. The x-axis label is, 2 theta, open parenthesis degree close parenthesis, with tick labels at 5, 10, 15, 20 and 25. The y-axis label is, Intensity, open parenthesis a.u. close parenthesis. A vertical shaded band marks a 2 theta interval between the tick labels 10 and 15. Pressure labels on the three traces are 0.6 GPa, 7.5 GPa and 9.1 GPa. Each trace shows a dominant peak near 2 theta about 7. Each trace also shows multiple smaller peaks between 2 theta about 13 and 16 within the shaded band. The 0.6 GPa trace includes several printed peak labels around the 13 to 16 region. Rows of short vertical reference markers appear beneath each trace. The image B showing three X ray diffraction line traces at different pressures. The x-axis label is, 2 theta, open parenthesis degree close parenthesis, with tick labels at 5, 10, 15, 20 and 25. The y-axis label is, Intensity, open parenthesis a.u. close parenthesis. A vertical shaded band marks a 2 theta interval between the tick labels 10 and 15. Pressure labels on the three traces are 10.2 GPa, 11.1 GPa and 19.6 GPa. Each trace shows a dominant peak near 2 theta about 7. Peaks between 2 theta about 13 and 16 are present within the shaded band, with fewer distinct peaks in the 19.6 GPa trace than in the 10.2 GPa and 11.1 GPa traces. Rows of short vertical reference markers appear beneath each trace.
High-pressure IR experiments
High-pressure infrared spectra were recorded at infrared beamline BL01B of Hefei Light Source (HLS). The IR radiation is extracted from a bending magnet with a superior acceptance angle of 65 mrad × 55 mrad (H × V) and high flux of ∼1013 photons s–1. An advanced Bruker 70v FTIR spectrometer (Bruker Corporation, Ettlingen, Germany) with a KBr beam-splitter and various detectors (a liquid-nitrogen-cooled MCT detector was used here) is available at this IR endstation. Coupled with an infrared Bruker Hyperion 3000 microscope, it covers a broad range of 650–4000 cm–1 and a high spectral resolution of 0.25 cm–1 for IR spectroscopy measurements at the micrometre scale.
Results
High-pressure X-ray diffraction of clinochlore
High-pressure synchrotron XRD investigations on clinochlore reveal a polytypic phase transition at ∼9 GPa (from IIb-2 to IIa-1, with space group C2/m unchanged) based on diffraction patterns as pressure increases (Fig. 2). Notably, major differences are observed in the 2θ range of 13–16° (d = 2.74–2.23 Å, λ = 0.6199 Å) and involve reflections that are very sensitive to small amounts of shear of β (Fig. 2): the diffraction pattern of low-pressure IIb-type structure displays five distinct and well-resolved diffraction peaks ((114), (131)+( $20\bar 2$), (
 $13\bar 2$)+(201), (132)+(
 $20\bar 3$), and (
 $13\bar 3$)+(202)) (Fig. 2a); whereas the diffraction pattern of the high-pressure IIa-type structure at this range is characterized by only three broader peaks ((
 $13\bar 1$)+(200), (
 $13\bar 2$)+(201), (132)+(
 $20\bar 3$)) (Fig. 2b). Furthermore, we observe a coherent transition sequence across the pressure range: from a pure IIb-type pattern at low pressures, through a mixed-phase regime, to a dominant IIa-type pattern above 9 GPa. The high-pressure structure is consistent with the single-crystal observations reported by Soldavini et al. (Reference Soldavini, Comboni, Hanfland and Merlini2024), who identified a similar transition from triclinic IIb-4 to monoclinic IIa-1 under pressure.
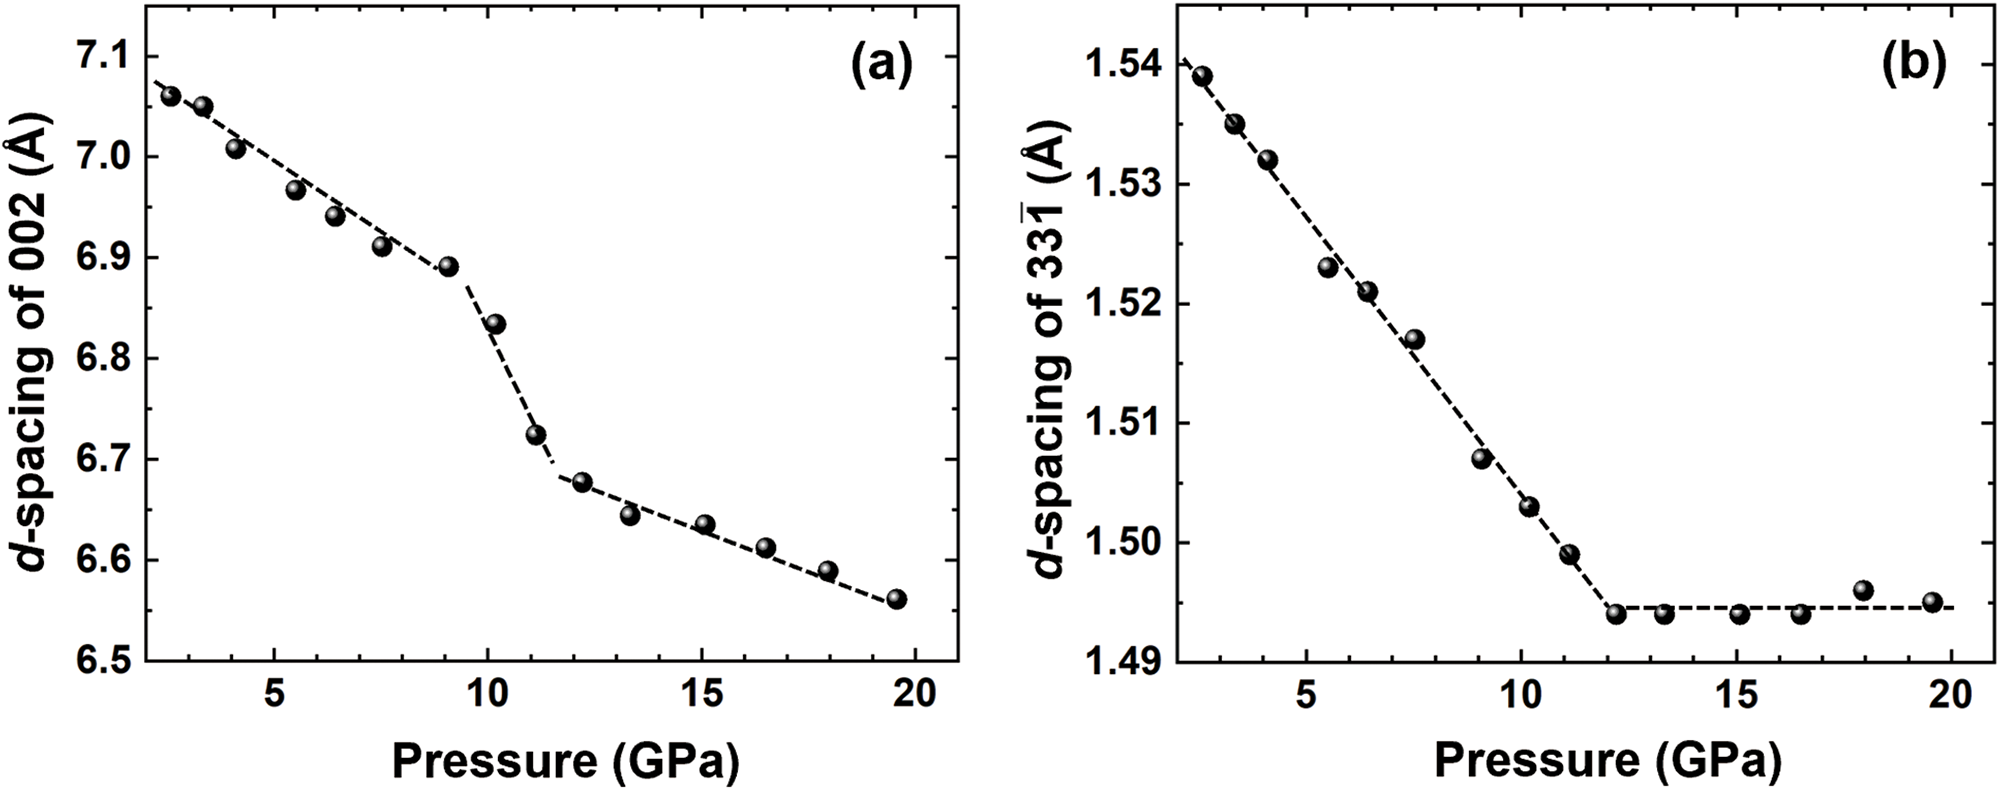
The weakening of diffraction peak intensity and broadening of the full width at half maximum (FWHM) in the IIa-1 phase suggest potential amorphization at pressures above 19 GPa (Fig. 2b). The pressure dependence of key d-spacing is detailed in Fig. 3. The d 002 spacing at ∼7.09 Å (2θ ≈ 5°) provides the most precisely determined index of the interlayer contraction, and the  ${d_{33\bar 1}}$ spacing at ∼1.54 Å (2θ ≈ 23°) is a sensitive index of the deformation of a and b lattice parameters (Welch et al., Reference Welch, Kleppe and Jephcoat2004). Also, the d*
 $_{33\bar 1}$ ˄ d*001 angle is almost perpendicular (84°), thus, d
 $_{33\bar 1}$ is largely insensitive to contraction perpendicular to the structural layering. Figure 3a clearly shows the specific impact on the d 002 spacing, exhibiting an abrupt decrease of ∼0.214 Å from 9.1 GPa to 12.2 GPa (0.025 Å/GPa below 9.1 GPa; 0.069 Å/GPa at 9.1 GPa–12.2 GPa). In contrast, the d
 $_{33\bar 1}$ spacing decreases smoothly through the polytypic phase transition without abrupt dropping (Fig. 3b). Above 12.2 GPa, the pressure-induced reduction of the d 002 spacing becomes significantly less pronounced, decreasing from 0.069 Å/GPa to 0.016 Å/GPa (Fig. 3a). The d
 $_{33\bar 1}$ spacing remains constant at ∼1.495 Å (Fig. 3b). Diffraction patterns collected at the start and end of the experiment show identical peak positions (Fig. S2), which confirms the reversibility of the transformation (Kleppe et al., Reference Kleppe, Jephcoat and Welch2003; Soldavini et al., Reference Soldavini, Comboni, Hanfland and Merlini2024).
Variation of d-spacings of key reflections (a) d 002 and (b)  ${d_{33\bar 1}}$. Dashed lines represent the linear pressure dependence of d-spacings.

Structural parameters and BM-EoS of clinochlore
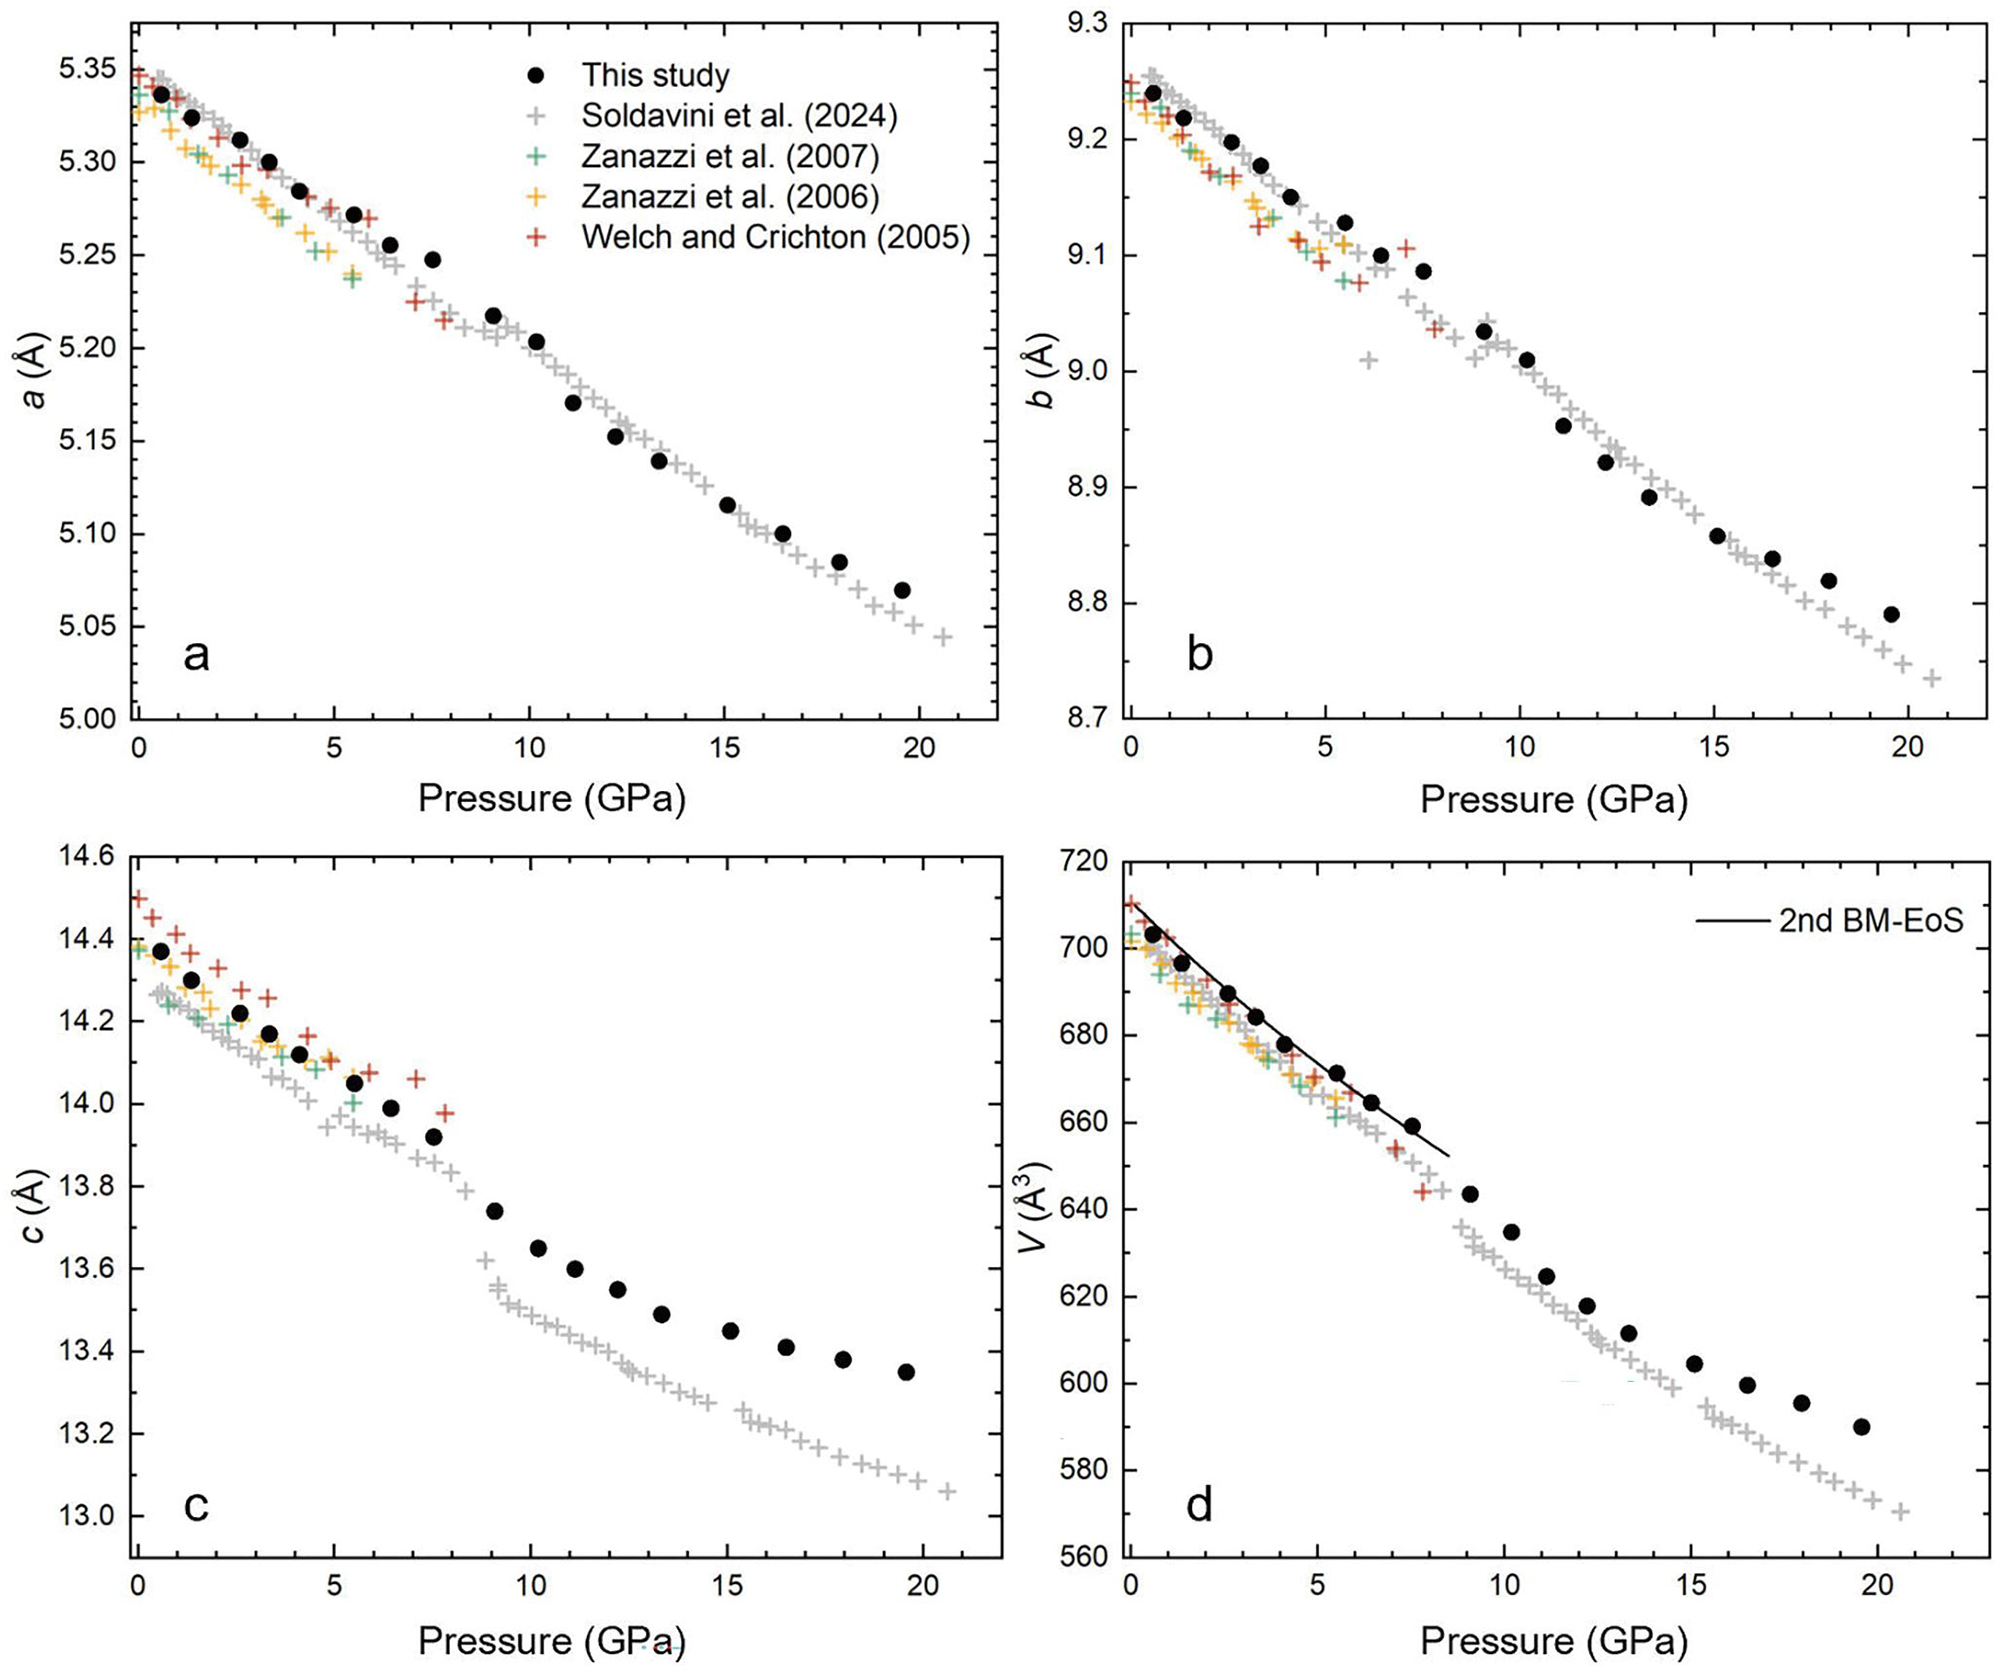
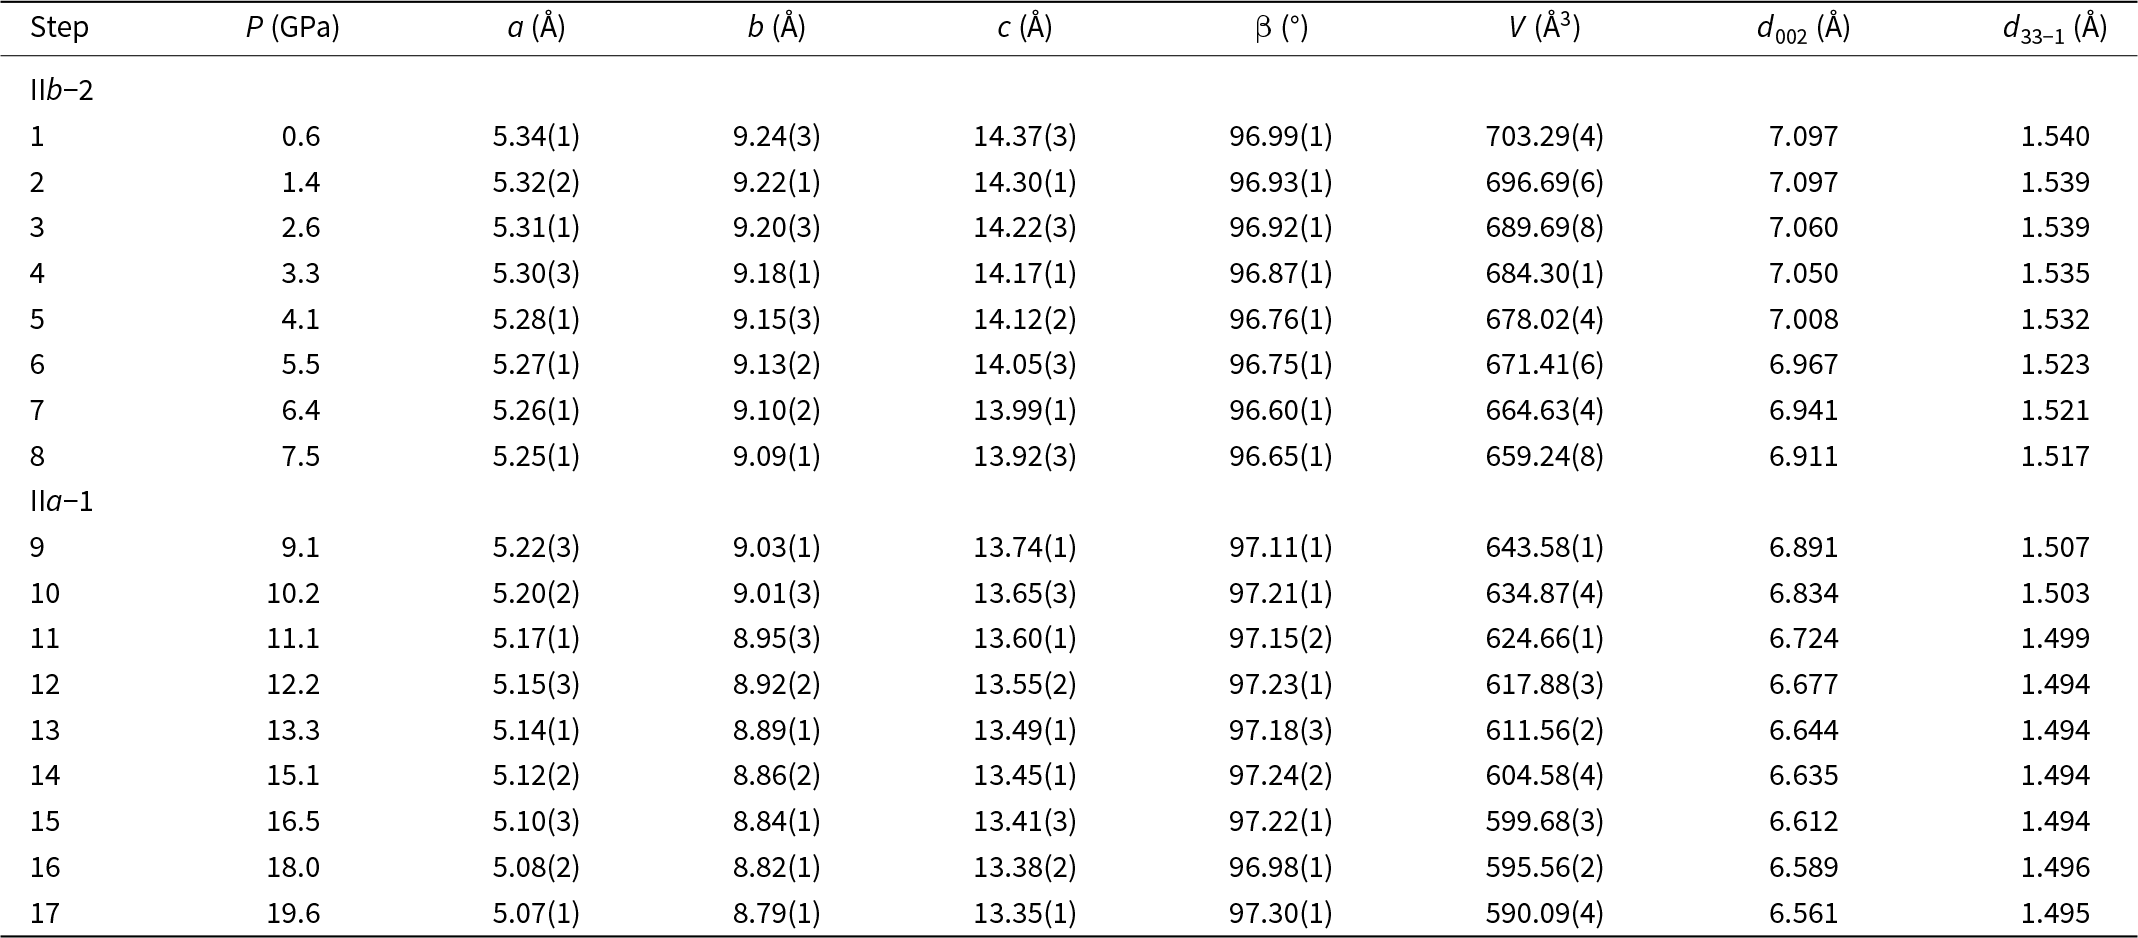
The relative variation of unit-cell parameters derived from high-pressure experiments on clinochlore are shown in Fig. 4 and Table 1. The unit-cell parameters begin to deviate significantly from linear behaviour at ∼9 GPa. As shown in Fig. 4, the a and b parameters show a nearly smooth and continuous trend with increasing pressures, whereas the c parameter, which aligns perpendicular to the layering, displays an abrupt and discontinuous decrease during the compression process. The unit-cell volume also exhibits considerable variation, decreasing from V = 659.2(1) Å3 to V = 643.6(2) Å3 as pressure increases from 7.5 to 9.1 GPa. A small increase in the β angle could also be observed (96.65° at 7.5 GPa and 97.11° at 9.1 GPa) across the phase transition. According to the chlorite structural configuration, this small variation in β angle may be associated with a rotation/translation of the superimposing layers. Above 10 GPa, the β angle stabilises at ∼97.2° (Table 1), maintaining this value up to ∼20 GPa across the entire pressure range studied.
Unit-cell parameters for clinochlore as a function of pressure compared with previous studies. (a, b, c) Variations of structural parameters of a, b, c with pressure. Discontinuity is observed at ∼9 GPa, which shows good agreement with previous results. (d) The unit-cell volume as a function of pressure. The volume data of low-pressure structure (< 9 GPa) of clinochlore is fitted to second-order Birch-Murnaghan equations of state for which V 0 = 710.9(3) Å3 and K 0 = 83.4(8) GPa. Data from Welch and Crichton (Reference Welch and Crichton2005), Zanazzi et al. (Reference Zanazzi, Montagnoli, Nazzareni and Comodi2006, Reference Zanazzi, Montagnoli, Nazzareni and Comodi2007) and Soldavini et al. (Reference Soldavini, Comboni, Hanfland and Merlini2024).

Figure 4 Long description
A scatter plot with a legend listing, This study, Soldavini et al. 2024, Zanazzi et al. 2007, Zanazzi et al. 2006 and Welch and Crichton 2005. The x-axis is labeled, Pressure (GPa), ranging from 0 to 20. The y-axis is labeled, a (Å), ranging from 5.00 to 5.35. Points form a downward trend from about 5.35 near 0 pressure to about 5.05 near 20. The image B showing a scatter plot with the x-axis labeled, Pressure (GPa), ranging from 0 to 20. The y-axis is labeled, b (Å), ranging from 8.7 to 9.3. Points form a downward trend from about 9.3 near ambient pressure to about 8.8 near 20. The image C showing a scatter plot with the x-axis labeled, Pressure (GPa), ranging from 0 to 20. The y-axis is labeled, c (Å), ranging from 13.2 to 14.6. Points decrease from about 14.6 near ambient pressure to about 14.0 by about 8 to 9, then show a lower cluster around about 13.6 to 13.4 from about 10 to 20. The image D showing a scatter plot with the x-axis labeled, Pressure (GPa), ranging from 0 to 20. The y-axis is labeled, V (Å3), ranging from 560 to 720. A line is labeled, 2nd BM-EoS. Points decrease from about 710 near ambient pressure to about 590 near 20.
Variations of lattice parameters and key d-spacings of clinochlore with pressure

Table 1 Long description
Measurements are listed by Step for pressure P in GPa, lattice parameters a, b, and c in angstroms, beta in degrees, unit cell volume V in cubic angstroms and d-spacings d 002 and d_{33\overline1} in angstroms. Two section labels appear in the Step column, IIb minus 2 before steps 1 to 8 and IIa minus 1 before steps 9 to 17, with blank numeric cells on those label rows. In steps 1 to 8, P increases from 0.6 to 7.5 GPa while a decreases from 5.34(1) to 5.25(1), b from 9.24(3) to 9.09(1), c from 14.37(3) to 13.92(3), beta ranges from 96.99(1) down to 96.60(1) then 96.65(1), and V decreases from 703.29(4) to 659.24(8). Over the same steps 1 to 8, d002 changes from 7.097 to 6.911 and d33 minus 1 changes from 1.540 to 1.517. In steps 9 to 17, P increases from 9.1 to 19.6 GPa while a decreases from 5.22(3) to 5.07(1), b from 9.03(1) to 8.79(1), c from 13.74(1) to 13.35(1), beta varies between 96.98(1) and 97.30(1), and V decreases from 643.58(1) to 590.09(4). Across steps 9 to 17, d002 decreases from 6.891 to 6.561, while d33 minus 1 ranges from 1.507 down to 1.494 and ends at 1.495.
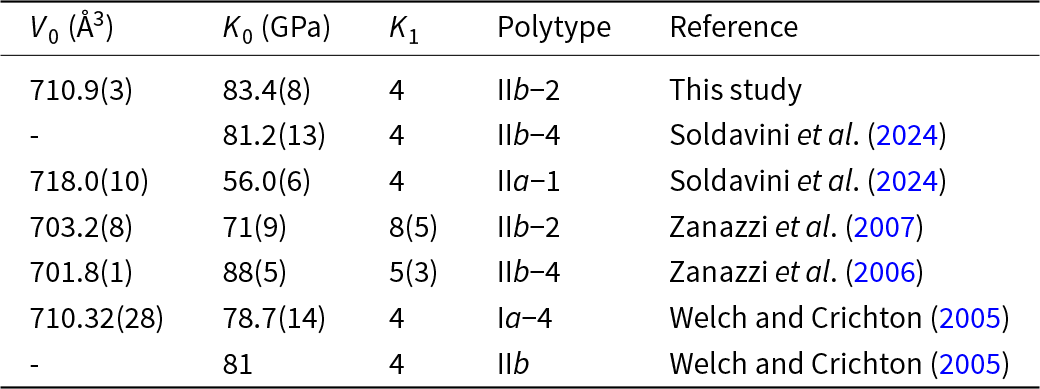
Pressure-volume data (Fig. 4d) can be fitted with the Birch-Murnaghan equation of state (BM-EoS) (Birch, Reference Birch1947) with EosFit7 software (Gonzalez-Platas et al., Reference Gonzalez-Platas, Alvaro, Nestola and Angel2016) up to 9 GPa, while the data collected at > 9 GPa couldn’t be fitted because of the complicated structural distortion according to the change in d  $_{33\bar 1}$ and d 002. A second-order fit gives V 0 = 710.9(3) Å3, K 0 = 83.4(8). These values are consistent with those reported in previous studies on chlorite using both second-order (K 1 = 4) and third-order BM-EoS (Table 2). The bulk modulus (K 0) of the high-pressure phase (IIa-1) shows a significant decrease of ∼40%, indicating the substantial changes of the compressibility after the phase transition.
BM-EoS parameters of chlorite comparing with previous results

Table 2 Long description
Columns list V0 in cubic angstroms, K0 in gigapascals, K1, polytype, and reference. Seven rows compare chlorite polytypes with different parameter sets. This study reports V0 710.9(3), K0 83.4(8), K1 4, polytype IIb minus 2. Soldavini et al. 2024 reports polytype IIb minus 4 with K0 81.2(13) and K1 4, with V0 not given, and polytype IIa minus 1 with V0 718.0(10), K0 56.0(6), K1 4. Zanazzi et al. 2007 reports polytype IIb minus 2 with V0 703.2(8), K0 71(9), K1 8(5), and Zanazzi et al. 2006 reports polytype IIb minus 4 with V0 701.8(1), K0 88(5), K1 5(3). Welch and Crichton 2005 reports polytype Ia minus 4 with V0 710.32(28), K0 78.7(14), K1 4, and a polytype IIb row with K0 81 and K1 4, with V0 not given.
Infrared spectroscopy of clinochlore at ambient and high-pressure conditions
Infrared spectroscopy of clinochlore at ambient conditions aligns well with previous studies on chlorite (Kloprogge and Frost, Reference Kloprogge and Frost2000; Welch et al., Reference Welch, Barras and Klinowski1995; Yang et al., Reference Yang, Ye, Han, Ren, Han and Zhang2018). The IR spectrum is characterised by a series of vibration modes of Si–O and O–H ranging from 600 to 1100 cm−1, and stretching modes of O–H spanning from 3400 to 3700 cm−1, as shown in Fig. S3 and Table S2. Specifically, the OH-stretching bands between 3400 and 3600 cm−1 are attributed to hydrogen-bonded interlayer OH (Prieto et al., Reference Prieto, Dubessy and Cathelineau1991; Serratosa and Vinas, Reference Serratosa and Vinas1964; Shirozu, Reference Shirozu1980). For instance, the 3407 cm–1 mode arises from OH-stretching vibrations of (SiAl)O···O–H, while the band at 3572 cm−1 is associated with OH-stretching vibrations of (AlAl)O···O–H. The highest frequency of OH band at 3659 cm−1, identical to the frequency of the talc OH band, is assigned to the non-hydrogen-bonded hydroxyl groups of the talc-like 2:1 layer (Inner O–H stretch). Aluminium substitution for Mg and Fe typically results in shifts of OH-stretching modes towards lower frequencies, which are influenced both by direct chemical effects on bond strength and by charge compensation through vacancies in dioctahedral clusters of the octahedral layer, thereby strengthening OH bonding (Velde, Reference Velde1980).
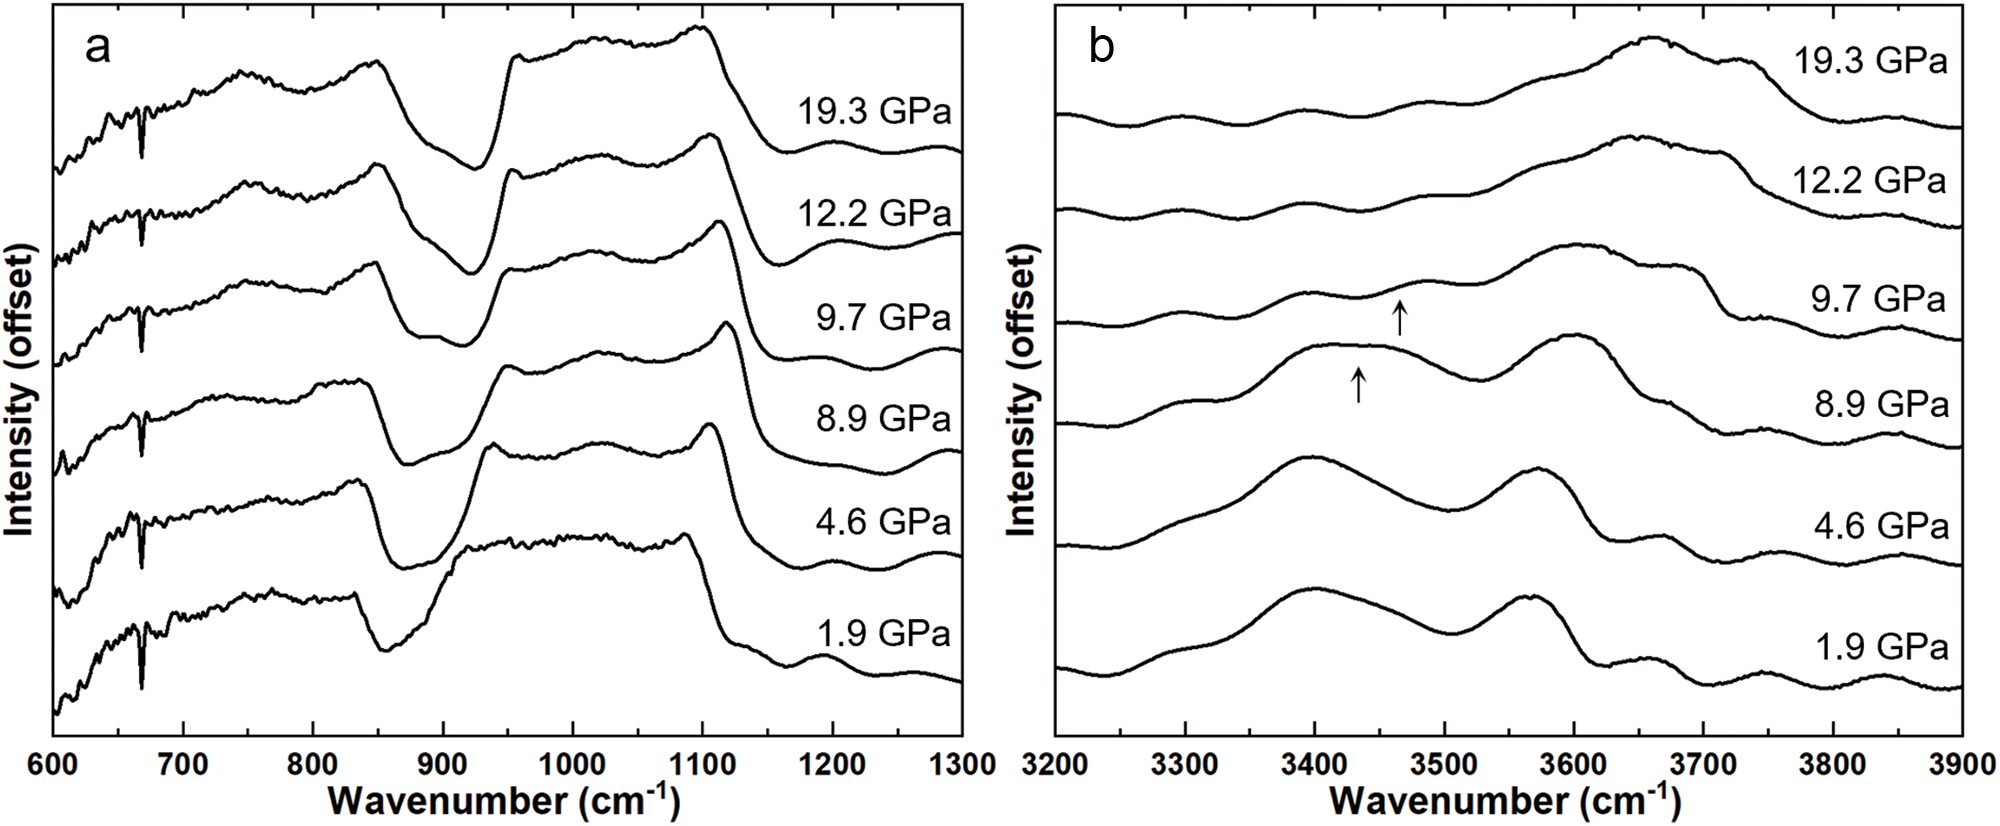
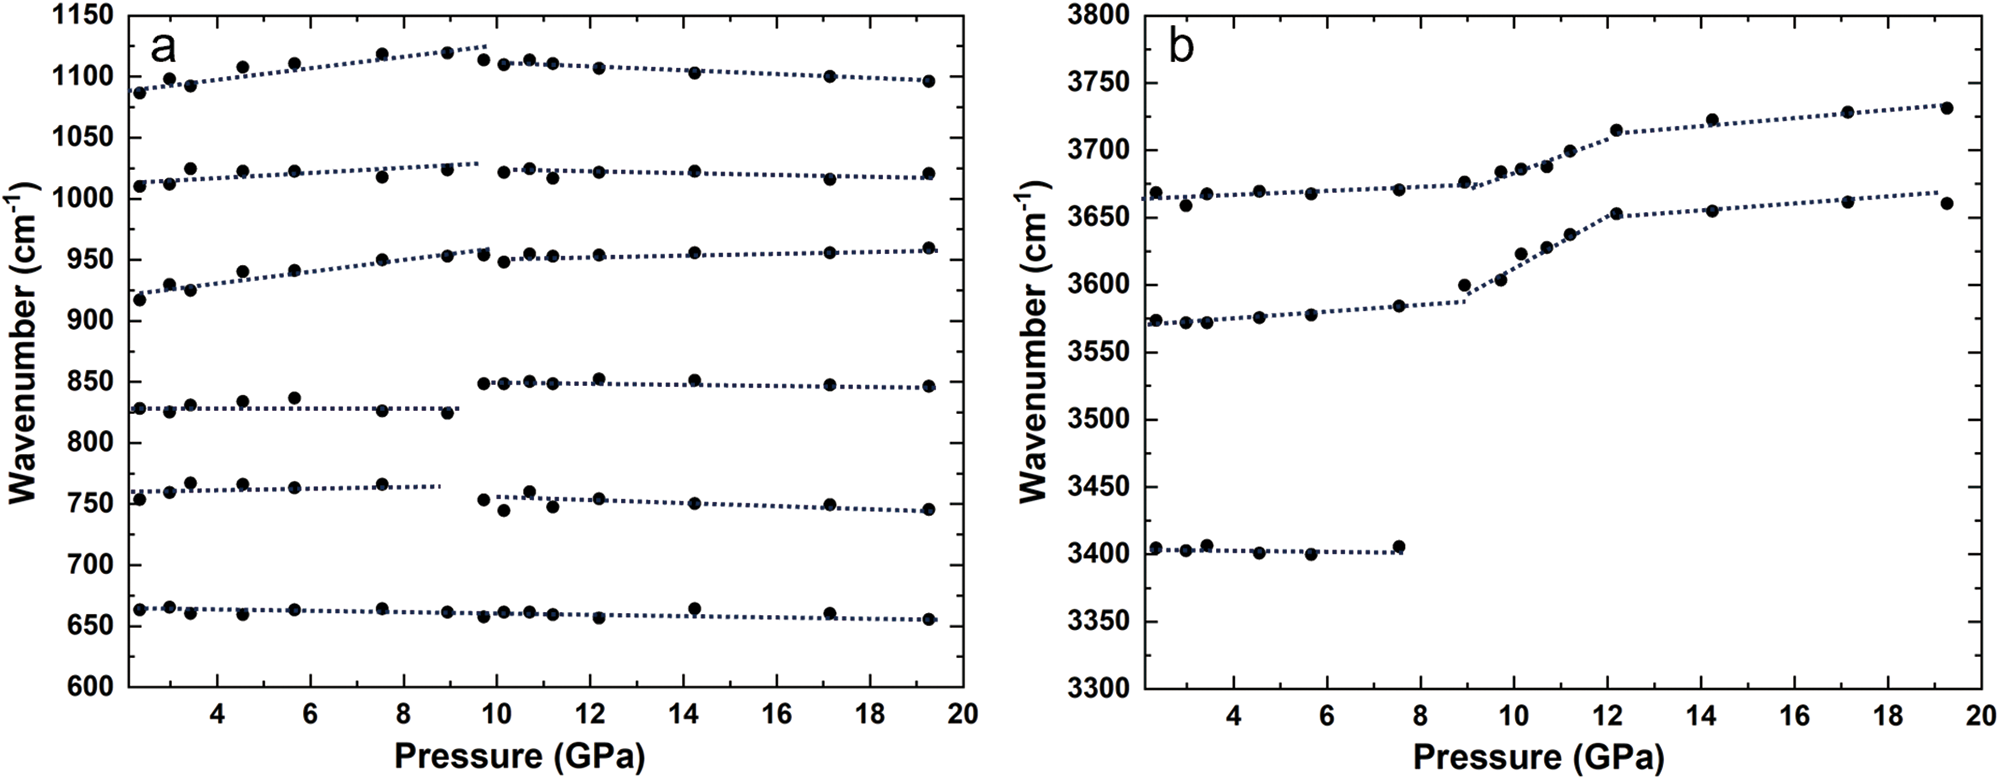
Under high-pressure conditions, all observed modes in the 600–1100 cm–1 region only exhibit a positive, continuous linear pressure dependence up to ∼9 GPa, except the 669 cm−1 mode which continuously shifts up to ∼20 GPa (Fig. 5a and Fig. 6a). Figures 5b and 6b detail the high-pressure evolution of the IR spectra of clinochlore in the OH-stretching region, showing that the pressure dependence of all OH modes remain linear below ∼9 GPa. Near 9 GPa, significant changes occur in the frequencies of all hydrogen-bonded OH modes: notably, the 3407 cm–1 hydroxyl vibration mode ((SiAl)O···O–H stretch) disappears (Fig. 5b), and the 3572 cm–1 ((AlAl)O···O–H stretch) and 3659 cm–1 (Inner O–H stretch) modes exhibit accelerated shifts upon compression (Fig. 6b). As the pressure continues to rise, reaching ∼12 GPa, the shifting rates of frequency for these two modes begin to decelerate, eventually stabilizing into a plateau around 3658 and 3717 cm–1, respectively (Fig. 5b). Upon decompression, all lattice modes and OH-stretching modes revert to their initial ambient positions (Fig. S4). Changes in both half-widths and intensities of lattice modes are reversible. The intensity of OH-stretching modes after decompression is lower than at the beginning.
Discussions
Structure evolution of clinochlore at high pressures
The changes in XRD patterns and IR vibrational spectra with pressure indicate that clinochlore undergoes a polytypic phase transition at ∼9 GPa and structural distortion at ∼12 GPa. Above ∼9 GPa, the behaviour of the vibration modes becomes more complicated, revealing the considerable complexity of hydrogen bonding in clinochlore under high-pressure conditions. Here, we discuss the specific characteristics and mechanisms of the phase transition and the structural distortion, respectively.
Polytypic phase transition at ∼9 GPa
The phase transition (from IIb-2 to IIa-1, with space group C2/m unchanged) was evident in our high-pressure synchrotron XRD patterns (Fig. 2), which are consistent with the recent high-pressure single-crystal XRD study (from IIb-4 to IIa-1) (Soldavini et al., Reference Soldavini, Comboni, Hanfland and Merlini2024). Our results indicate that the IIa-1 prototype could be a common high-pressure polytype regardless of whether the starting phase is triclinic (IIb-4) or monoclinic (IIb-2). According to the nomenclature proposed by Brown and Bailey (Reference Brown and Bailey1962), the reorganization of the atoms consists of an a/3 translation of the brucite layer relative to the initial talc layer, changing from a b-type structure to an a-type (Soldavini et al., Reference Soldavini, Comboni, Hanfland and Merlini2024). Moreover, we also found marked discontinuity in the pressure dependence of d 002 spacing and the c parameter at ∼9 GPa (Fig. 3a and Fig. 4c). In contrast, d-spacing at high angles to the (001) plane, such as ( $33\bar 1$), did not exhibit such discontinuous behaviour at ∼9 GPa (Fig. 3b). This observation supports the results of Welch et al. (Reference Welch, Kleppe and Jephcoat2004) and Kleppe et al. (Reference Kleppe, Jephcoat and Welch2003) that the change of the structure predominantly involves the distortion along the c-axis in the interlayer topology, manifesting as discontinuities in d 002 spacing and c parameter.
Above 9 GPa, a discontinuity is observed in the pressure dependence of the interlayer OH modes, indicating significant changes in the OH-bonding environment. Notably, the vibration of (SiAl)O···O–H stretching mode disappeared (Fig. 5b), indicating the potential dehydroxylation of clinochlore. The observed positive frequency shifting rate of both 3572 cm–1 and 3659 cm–1 mode is ∼20 cm–1 GPa–1, which is characteristic for (nearly) unbonded hydroxyl groups (Kleppe et al., Reference Kleppe, Jephcoat and Welch2003). Moreover, the bulk modulus of the high-pressure phase (IIa-1) shows a significant decrease of ∼40% (Table 2), indicating the increasing compressibility of the structure. This reduction may be linked to partial dehydroxylation under high pressure, which would reduce the number of interlayer hydrogen bonds, thereby weakening interlayer repulsion and increasing structural compressibility.
Consequently, we interpret the polytypic phase transition at ∼9 GPa as a reorganization of the interlayer hydrogen bonding, potentially transitioning to a state of a very weakly hydrogen-bonded (including multi-furcated hydrogen bonds) or a non-hydrogen-bonded hydroxyls-bearing phase. A potential trigger for this transition could be the maximal approach of basal tetrahedral sheets towards the interlayer sheets as pressure increases, eventually reaching a limit where a fraction of interlayer OH bonds was released out of the structure under compression. It is unlikely that the observed transition is due to the breaking of Si–O, Al–O, or Mg–O bonds, given the reversibility of the phase transition upon decompression (Fig. S2 and Fig. S4).
Representative IR spectra of clinochlore as a function of pressure in 600–1100 cm–1 region (a) and OH-stretching frequency in the 3300–3700 cm–1 region (b). The black arrows indicate the disappearance of the 3407 cm–1 vibration mode.

Figure 5 Long description
Stacked line spectra in image A. The x-axis is labeled, Wavenumber (cm superscript minus 1), with tick labels at 600, 700, 800, 900, 1000, 1100, 1200 and 1300. The y-axis is labeled, Intensity (offset). Six spectra are shown, each labeled at the right: 1.9 GPa, 4.6 GPa, 8.9 GPa, 9.7 GPa, 12.2 GPa and 19.3 GPa. Each trace shows multiple peaks and troughs across the range, with prominent features around the 900 to 1100 region and additional structure toward 1200 to 1300. Stacked line spectra in image B. The x-axis is labeled, Wavenumber (cm superscript minus 1), with tick labels at 3200, 3300, 3400, 3500, 3600, 3700, 3800 and 3900. The y-axis is labeled, Intensity (offset). Six spectra are shown, each labeled at the right: 1.9 GPa, 4.6 GPa, 8.9 GPa, 9.7 GPa, 12.2 GPa and 19.3 GPa. Two upward arrows are drawn near the 3400 region on the lower-middle traces. The traces show broad bands and smaller undulations across 3200 to 3900, with band positions and shapes varying between the labeled pressures.
Pressure dependence of the stretching modes of clinochlore in the 600–1100 cm–1 region (a) and OH-stretching frequency in the 3300–3700 cm–1 region (b). Dashed lines represent the linear pressure dependence of modes.

Structural distortion at ∼12 GPa
Although the XRD patterns of clinochlore show no change in the number of diffraction peaks, indicating that the overall crystallographic symmetry is preserved, noticeable variations occur in both the d-spacings and the vibration of hydroxyl groups. In particular, the compressibility along interlayer contraction, as reflected by the d 002 spacing, markedly decreases (from 0.069 Å/GPa to 0.016 Å/GPa) (Fig. 3a). The  ${d_{33\bar 1}}$ spacing that is sensitive to contraction within the layer remains constant above 12 GPa (Fig. 3b). These observations indicate that the compressibility across and within the layers reaches its limit, suggesting a shift in the overall compressibility of the structure. As for the high-pressure behaviour of hydroxyl groups, the OH mode exhibits a distinct shift rate of ∼1.5 cm–1·GPa–1 to higher frequencies above ∼12 GPa (Fig. 6b). Such positive pressure dependencies of OH-stretching frequencies at high pressures, which are less common than negative dependencies, are typically associated with pressure-enhanced hydrogen bonding, leading to hydrogen bond shortening and hydroxyl bond lengthening (He et al., Reference He, Kagi, Komatsu, Sano-Furukawa, Abe, Fukuyama, Shinmei and Nakano2024). Significant positive pressure-induced frequency shifts were explained by a combination of H–H repulsion and hydroxyl bond elongation towards an empty polyhedron (Lin et al., Reference Lin, Liu, Mernagh and Irifune2000). In the case of clinochlore, the high OH-stretching frequencies observed can probably be attributed to a combination of factors, including repulsion between anions and cations (O–O, neighbouring Si–H, and (Mg,Al)–H interactions), along with pressure-induced changes in the hydrogen bond properties.
On the basis of the above interpretations, we propose that the structural distortion at ∼12 GPa drives a decreasing distance between layers, which leads to the formation of hydrogen bonds between the hydroxyl groups and oxygen of the sheets, increasing the repulsive forces between layers. Additionally, the IIa-phase shows the highest cation–cation repulsion between the tetrahedra of the TOT layer and the B layer among the other polytypes (Bailey, Reference Bailey1988), which leads to the nearly constant  ${d_{33\bar 1}}$ spacing above 12 GPa. Overall, these factors contribute to the decreased compressibility observed beyond ∼12 GPa.
It should be noted that we did not observe the discontinuity in OH-stretching frequencies within the 650–800 cm–1 range at ∼16 GPa, as reported by Kleppe et al. (Reference Kleppe, Jephcoat and Welch2003). This discrepancy is probably due to variations in chemical composition, particularly the Mg/Fe ratio of the chlorite samples. The chlorite studied by Kleppe et al. (Reference Kleppe, Jephcoat and Welch2003) was a pure Mg end-member, containing no iron. In contrast, the chlorite sample in this study has a Mg/Fe ratio of ∼1.8, exhibiting a phase transition pressure in the ranges of 9–10 GPa. Our observation is supported by Soldavini et al. (Reference Soldavini, Comboni, Hanfland and Merlini2024), reporting a similar phenomenon with a Mg/Fe ratio of ∼1.7. Atomically, although Fe2+ and Mg2+ are isovalent and possess similar ionic radii, differences in cation composition can induce subtle local structural distortions, alter hydrogen-bonding geometries, and modify the size of octahedral sites. These factors may influence how hydroxyl groups respond to compression, particularly in terms of vibrational frequency shifts and hydrogen bond strength. Other factors, such as pressure calibration uncertainties and minor chemical heterogeneities in natural samples may also contribute to these differences.
Overall, the high-pressure behaviour of chlorite is complex and probably influenced by multiple interacting variables. To further clarify the role of compositional variability, additional high-pressure studies on chlorite samples with varying chemical compositions are needed, particularly those incorporating high-pressure neutron diffraction which can directly probe hydrogen positions and bonding environments.
Conclusions
X-ray diffraction and infrared spectroscopy were employed to study the high-pressure structural behaviour of clinochlore. Polytypic phase transition and structural distortion were found at ∼9 GPa and ∼12 GPa, respectively. The polytypic phase transition at ∼9 GPa was marked by the reorganization of interlayer hydrogen bonding, potentially transitioning to a state of very weakly bonded or non-hydrogen-bonded hydroxyl groups. The distortion at ∼12 GPa involves a more complex behaviour in the hydroxyl groups and metal–oxygen sublattice, which may relate to the compression limits of interlayer distances and subsequent changes in hydrogen bonding patterns. These findings significantly contribute to our understanding of the structural behaviour of chlorite at high pressures. To advance the geodynamic implications of chlorite, further studies are needed to investigate the structural evolution and dehydration behaviour under high-pressure and high-temperature conditions relevant to the Earth’s interior, with the aim of more accurately evaluating its potential role in transporting water into the deep mantle.
Supplementary material
The supplementary material for this article can be found at https://doi.org/10.1180/mgm.2025.10172
Acknowledgements
We greatly thank the editor and anonymous referees for their effort and careful reviews of this manuscript. This research was supported by the National Science and Technology Major Project of the Ministry of Science and Technology of China (Grants Nos. 2025ZD1010301 to B.X.H.) and the National Natural Science Foundation of China (Grants Nos. 42272047 to H.Y.Z. and 42102034 to J.J.N.) and the China Postdoctoral Science Foundation (Grants Nos. 2019M660816 to J.J.N.).
Competing interests
The authors declare no competing interests.