1. Introduction
The flapping of wings during flight or fins during swimming presents an intriguing system from which to understand the interactions between a moving structure and the surrounding fluid. In aquatic environments natural selection has driven physiological development to optimize the efficiency of flapping locomotion, which can be viewed essentially as a combined pitch-and-heave motion in most cases (Akhtar, Mittal & Lauder Reference Akhtar, Mittal, Lauder and Drucker2007). Previous theoretical and experimental studies have emphasized the potential for wake interactions among nearby fish or fins to increase the propulsive efficiency (Spagnolie et al. Reference Spagnolie, Moret, Shelley and Zhang2010). Such interactions include high complexities and have not yet been well understood from a hydrodynamics perspective, and a more detailed study would be highly desirable (Fish & Lauder Reference Fish and Lauder2006; Wu Reference Wu2011).
An illuminating approach to studying vortex dynamics during swimming has involved characterizing the system dynamics of a flag-in-flow problem and evaluating the effects of certain key parameters: the mass ratio, the bending rigidity and the Reynolds number (Zhang et al. Reference Zhang, Childress, Libchaber and Shelley2000; Shelley & Zhang Reference Shelley and Zhang2011). Passively flapping systems have been shown to share some essential features of the active swimming problem, including the fluid–flexible body interactions, lending insight into how the flexibility of a fish (flag) affects the swimming efficiency. The effects of oncoming vortices are considered by numerically and experimentally studying the flow past flags in a tandem arrangement (Jia & Yin Reference Jia and Yin2008; Ristroph & Zhang Reference Ristroph and Zhang2008; Alben Reference Alben2009; Zhu Reference Zhu2009; Kim, Huang & Sung Reference Kim, Huang and Sung2010). Interestingly, the downstream filament may experience a higher drag force than was experienced by the upstream flag or a single-filament system (Ristroph & Zhang Reference Ristroph and Zhang2008). Kim et al. (Reference Kim, Huang and Sung2010) examined the constructive and destructive modes of the vortex interactions in flag wakes corresponding to inverted or normal drafting, respectively, at different streamwise gap distances (Gopalkrishnan et al. Reference Gopalkrishnan, Triantafyllou, Triantafyllou and Barrett1994). A downstream flag that is allowed to move freely in the lateral direction can effectively utilize the oncoming vortices in a slalom manner (Jia & Yin Reference Jia and Yin2008). As a result, the downstream flag extracts energy from the wake and receives an increased drag force. In live fish systems, Liao et al. (Reference Liao, Beal, Lauder and Triantafyllou2003) demonstrated that a trout swimming in the wake of a stationary object placed in a water flow can exploit the oncoming vortices to reduce the muscle force and energy cost of locomotion. Beal et al. (Reference Beal, Hover, Triantafyllou, Liao and Lauder2006) showed that dead fish can extract energy from oncoming vortices in the wake of a bluff cylinder by engaging in a passive flapping motion that overcomes the drag force and generates a thrust force.
As a simple model of the flying/swimming problem, flow around actively flapping foils has been extensively studied (Wang Reference Wang2005; Lauder et al.
Reference Lauder, Anderson, Tangorra and Madden2007; Shyy Reference Shyy, Aono, Chimakurthi, Trizila, Kang, Cesnik and Liu2010; Deng et al.
Reference Deng, Xu, Chen, Dai, Wu and Tian2013). A foil experiencing a combination of harmonic pitching and heaving motions produces a thrust force through the formation of a jet-like flow that projects downstream from the trailing edge of the foil (Anderson et al.
Reference Anderson, Streitlien, Barrett and Triantafyllou1998). The pitching oscillation was found to play a major role in the production of thrust, which can be understood by considering the wings of an insect during hovering flight (Guglielmini & Blondeaux Reference Guglielmini and Blondeaux2004). The propulsion efficiency is maximized if there is a phase lag of about
 $90^{\circ }$
between the pitching motion and the heaving motion (Lighthill Reference Lighthill1970; Tuncer & Kaya Reference Tuncer and Kaya2005). Recently, a passively deformable airfoil or plate attracted more attention to the influence of flexibility in a flapping wing or fin on the flying/swimming performance, e.g. thrust generation, efficiency enhancement and wake symmetry, and the underlying mechanisms (Alben, Madden & Lauder Reference Alben, Madden and Lauder2007; Michelin & Smith Reference Michelin and Smith2009; Masoud & Alexeev Reference Masoud and Alexeev2010; Thiria & Godoy-diana Reference Thiria and Godoy-diana2010; Alben Reference Alben2011; Kang et al.
Reference Kang, Aono, Cesnik and Shyly2011; Ramananarivo, Godoy-diana & Thiria Reference Ramananarivo, Godoy-diana and Thiria2011; Alben, Witt & Baker Reference Alben, Witt, Baker, Anderson and Lauder2012; Eloy & Lauga Reference Eloy and Lauga2012; Marais et al.
Reference Marais, Thiria, Wesfreid and Godoy-diana2012; Shoele & Zhu Reference Shoele and Zhu2012; Uddin, Huang & Sung Reference Uddin, Huang and Sung2013; Zhu, He & Zhang Reference Zhu, He and Zhang2014a
,Reference Zhu, He and Zhang
b
). Studies on the behaviours of an actively flapping body under the influence of oncoming vortices are relatively scarce. The presence of vortices introduces more complicated interactions, but constitutes an important means of understanding the hydrodynamic properties of fish schooling, bird flocking and interactions among wings/fins. Lauder et al. (Reference Lauder, Anderson, Tangorra and Madden2007) developed a dual-foil flapping robotic device as an interaction model of dorsal and caudal fins, which can be used to improve our understanding of the significance of flexibility in the locomotion performance. Zhu, He & Zhang (Reference Zhu, He and Zhang2014c
) simulated the motions of two tandem self-propelled filaments in viscous fluid. They found that the equilibrium separation distance of the two tandem flags is closely correlated with the streamwise spacing of the reversed Karman vortex behind the upstream filament. The head of the downstream filament is prone to swim through the cores of oncoming positive and negative vortices alternately to obtain energetic benefits, which is different from the slalom motion between oncoming vortex cores as reported in Liao et al. (Reference Liao, Beal, Lauder and Triantafyllou2003) and Jia & Yin (Reference Jia and Yin2008).
In the present study, the dynamics of flow around a pair of coupled flexible flags arranged tandemly and subjected to a uniform flow was investigated. The upstream flexible flag passively flapped while the downstream flexible flag flapped according to the active pitching and heaving motions of its leading edge. Actively flapping downstream flexible flags are common in nature, for example among swimming fish, but the flapping mode, interaction modes and optimal flapping conditions are not yet well understood. The current study provides necessary insights towards better understanding of the manoeuvring dynamics of actively flapping flexible bodies in a viscous flow or the swimming behaviour of fish. The drag coefficient of the actively flapping downstream flexible flag depended on the frequency, phase angles and amplitudes of the pitching and heaving motions, and the bending coefficient. These dependences were examined in detail. Some intriguing results were obtained: within a range of the flapping parameters, the actively flapping downstream flag experienced a distinct reduction or enhancement of the drag coefficient. The vortices shed from the upstream flag interacting with the downstream flag in different modes were identified, and the underlying mechanism of the drag variation was explored. The next section introduces the formulation of the problem, and a description of the computational configuration is provided. Section 3 presents the numerical results and discussion. Finally, conclusions are drawn in § 4.
2. Computational model
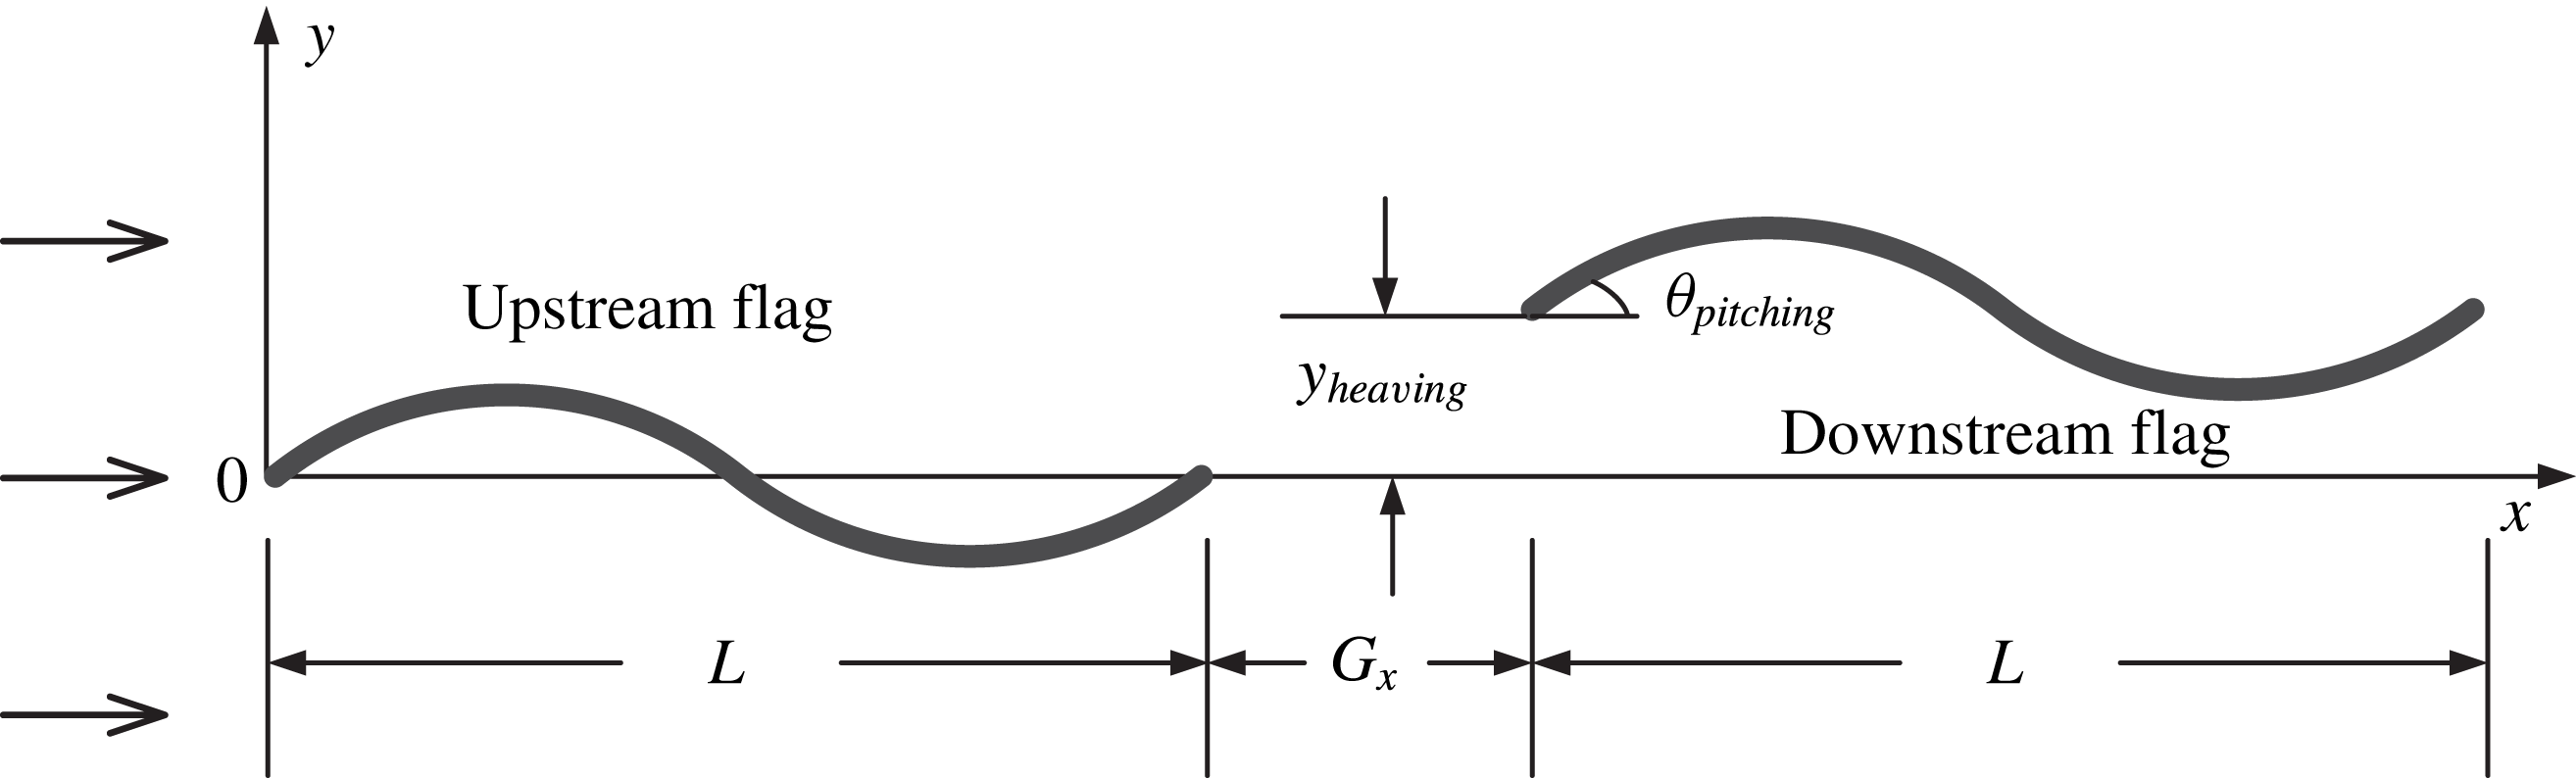
In the present study, a grouping unit consisting of two flexible bodies was modelled using two tandem flexible flags in a uniform flow. A schematic diagram of the computational configuration, together with the coordinate system, is shown in figure 1. The relative positions of the two tandem flags were varied by adjusting the initial streamwise gap distance
 $G_{x}$
. The leading edge of the upstream flag was fixed, whereas a pitching and heaving motion was prescribed for the head of the downstream flag. An Eulerian coordinate system was used to describe the fluid flow, and a separate Lagrangian coordinate system was applied to each flexible flag. The fluid–flag coupling system was modelled using an improved version of the immersed boundary method (Huang, Shin & Sung Reference Huang, Shin and Sung2007). According to this method the fluid flow and the flag motions were solved separately in each coordinate system, and the fluid–flag interactions were calculated using a feedback force. Huang et al. (Reference Huang, Shin and Sung2007) simulated a single flexible flag and two flags in a side-by-side arrangement in a uniform flow, assuming that the flags were inextensible. Because the same method was used here, with the only difference being the mutual arrangement of the flags, the validity of the numerical results will be assumed in the following discussion.
Schematic diagram showing the two tandem flags in a uniform flow, where the head of the downstream flag was prescribed with active pitching and heaving motions.
 $y_{heaving}=Y\cos ({\it\omega}t-{\it\Phi}_{heaving})$
;
 ${\it\theta}_{pitching}={\it\Phi}\cos ({\it\omega}t-{\it\Phi}_{pitching})$
.

The incompressible viscous fluid flow was described using the Navier–Stokes and continuity equations, which were non-dimensionalized by choosing the far-field velocity
 $U_{\infty }$
and the flag length
 $L$
as the characteristic scales, i.e.,
 $$\begin{eqnarray}\displaystyle & \displaystyle \frac{\partial \boldsymbol{u}}{\partial t}+\boldsymbol{u}\boldsymbol{\cdot }\boldsymbol{{\rm\nabla}}\boldsymbol{u}=-\boldsymbol{{\rm\nabla}}p+\frac{1}{Re}{\rm\nabla}^{2}\boldsymbol{u}+\boldsymbol{f}, & \displaystyle\end{eqnarray}$$
 $$\begin{eqnarray}\displaystyle & \displaystyle \boldsymbol{{\rm\nabla}}\boldsymbol{\cdot }\boldsymbol{u}=0. & \displaystyle\end{eqnarray}$$
 $Re={\it\rho}_{0}U_{\infty }L/{\it\mu}$
, where
 ${\it\rho}_{0}$
is the fluid density and
 ${\it\mu}$
is the dynamic viscosity. As in the method described by Huang et al. (Reference Huang, Shin and Sung2007), the governing equations for the inextensible flexible flag were non-dimensionalized using the following characteristic scales:
 $L$
for the length,
 $L/U_{\infty }$
for the time,
 ${\it\rho}_{1}U_{\infty }^{2}/L$
for the Lagrangian force
 $\boldsymbol{F}$
,
 ${\it\rho}_{1}U_{\infty }^{2}$
for the tension force
 $T$
and
 ${\it\rho}_{1}U_{\infty }^{2}L^{2}$
for the bending rigidity
 ${\it\gamma}$
, where
 ${\it\rho}_{1}$
denotes the density difference between the flag and the surrounding fluid. The flexible flag was, therefore, described by
 $$\begin{eqnarray}\displaystyle & \displaystyle \frac{\partial ^{2}\boldsymbol{X}}{\partial t^{2}}=\frac{\partial }{\partial s}\left(T\frac{\partial \boldsymbol{X}}{\partial s}\right)-\frac{\partial ^{2}}{\partial s^{2}}\left({\it\gamma}\frac{\partial ^{2}\boldsymbol{X}}{\partial s^{2}}\right)-\boldsymbol{F}, & \displaystyle\end{eqnarray}$$
 $$\begin{eqnarray}\displaystyle & \displaystyle \frac{\partial \boldsymbol{X}}{\partial s}\boldsymbol{\cdot }\frac{\partial \boldsymbol{X}}{\partial s}=1, & \displaystyle\end{eqnarray}$$
 $s$
is the arclength and
 $\boldsymbol{X}=(X(s,t),Y(s,t))$
is the position. The tension force
 $T$
is determined by the constraint of inextensibility and is a function of
 $s$
and
 $t$
, while the bending rigidity
 ${\it\gamma}$
is assumed to be constant. At the fixed end of the upstream flag, the simply supported boundary conditions were applied, i.e.,
 $$\begin{eqnarray}\boldsymbol{X}=\boldsymbol{X}_{0},\quad \frac{\partial ^{2}\boldsymbol{X}}{\partial s^{2}}=(0,0).\end{eqnarray}$$
At the free ends of the upstream and downstream flags, the boundary conditions were expressed as
 $$\begin{eqnarray}T=0,\quad \frac{\partial ^{2}\boldsymbol{X}}{\partial s^{2}}=(0,0),\quad \frac{\partial ^{3}\boldsymbol{X}}{\partial s^{3}}=(0,0).\end{eqnarray}$$
On the other hand, at the leading edge of the downstream flag, the clamped boundary conditions were adopted, i.e.,
 $$\begin{eqnarray}\boldsymbol{X}=(x_{1},y),\quad \frac{\partial \boldsymbol{X}}{\partial s}=(\cos {\it\theta},\;\sin {\it\theta}).\end{eqnarray}$$
In the above equation, the normal position
 $y$
and the inclination angle
 ${\it\theta}$
were attained according to the active pitching and heaving motions, i.e.,
 $$\begin{eqnarray}\displaystyle y=Y\cos ({\it\omega}t-{\it\Phi}_{heaving}), & & \displaystyle\end{eqnarray}$$
 $$\begin{eqnarray}\displaystyle {\it\theta}={\it\Theta}\cos ({\it\omega}t-{\it\Phi}_{pitching}), & & \displaystyle\end{eqnarray}$$
 ${\it\omega}$
is the frequency of the pitching and heaving motions,
 ${\it\Phi}_{heaving}$
is the phase angle of the heaving motion and
 ${\it\Phi}_{pitching}$
is the phase angle of the pitching motion.
The interaction force between the flow and the structure was calculated using the feedback force,
 $$\begin{eqnarray}\boldsymbol{F}={\it\alpha}\int _{0}^{t}(\boldsymbol{U}_{ib}-\boldsymbol{U})\,\text{d}t^{\prime }+{\it\beta}(\boldsymbol{U}_{ib}-\boldsymbol{U}),\end{eqnarray}$$
where
 ${\it\alpha}$
and
 ${\it\beta}$
are large negative free constants set to be
 $10^{5}$
and
 $10^{3}$
, respectively, as in Huang et al. (Reference Huang, Shin and Sung2007).
 $\boldsymbol{U}_{\mathit{ib}}$
is the fluid velocity obtained by interpolation at the immersed boundary, and
 $\boldsymbol{U}$
is the velocity of the flag expressed by
 $\boldsymbol{U}=\text{d}\boldsymbol{X}/\text{d}t$
. The following interpolation relations between the Eulerian and Lagrangian variables were realized using the Dirac delta function, as described in Shin, Huang & Sung (Reference Shin, Huang and Sung2008):
 $$\begin{eqnarray}\displaystyle \boldsymbol{U}_{ib}\left(s,t\right)=\int _{{\it\Omega}}\boldsymbol{u}(\boldsymbol{x},t){\it\delta}(\boldsymbol{X}(s,t)-\boldsymbol{x})\,\text{d}\boldsymbol{x}, & & \displaystyle\end{eqnarray}$$
 $$\begin{eqnarray}\displaystyle \boldsymbol{f}(\boldsymbol{x},t)={\it\rho}\int _{{\it\Gamma}}\boldsymbol{F}(s,t){\it\delta}(\boldsymbol{x}-\boldsymbol{X}(s,t))\,\text{d}s, & & \displaystyle\end{eqnarray}$$
 ${\it\rho}={\it\rho}_{1}/{\it\rho}_{0}L$
denotes the density ratio.
For numerical implementation, the fluid motion equations (2.1) and (2.2) were solved by using the fractional-step method with a staggered Cartesian grid system (Kim, Baek & Sung Reference Kim, Baek and Sung2002). On the other hand, the finite difference method was adopted to calculate the solid motion equations (2.3) and (2.4). More details of the numerical schemes can be found in Huang et al. (Reference Huang, Shin and Sung2007). The overall computational process for simulating the fluid–flag coupling system is summarized as follows (Huang & Sung Reference Huang and Sung2009):
-
(1) Initialize the computation parameters, the meshes and the fluid and solid motions; set
 $\boldsymbol{U}_{ib}^{0}=\boldsymbol{U}^{0}$
.
-
(2) At the
$n$
th time step, the fluid velocity
$\boldsymbol{u}^{n}$
and the solid position
$\boldsymbol{X}^{n}$
and velocity
$\boldsymbol{U}^{n}$
are known. Interpolate the fluid velocity at the Lagrangian points to obtain
$\boldsymbol{U}_{ib}^{n}$
and then calculate the Lagrangian momentum force
$\boldsymbol{F}^{n}$
. -
(3) Map the Lagrangian momentum force onto the Eulerian grid. Obtain the updated fluid velocity field and pressure field.
-
(4) Substitute
$\boldsymbol{F}^{n}$
into the flag motion equation and obtain the flag position at the new time step
$\boldsymbol{X}^{n+1}$
, as well as the velocity
$\boldsymbol{U}^{n+1}=(\boldsymbol{X}^{n+1}-\boldsymbol{X}^{n})/{\rm\Delta}t$
. Return to step (2) and march to the next time step.



The Eulerian grid size for the fluid was
 $512\times 250$
and the Lagrangian grid size for each flag was 64. The Eulerian grid was uniformly distributed along the
 $x$
and
 $y$
directions over
 $-2\leqslant y\leqslant 2$
, but was stretched otherwise. The far-flow field conditions were applied at the top and bottom boundaries as well as at the inlet of the fluid domain, whereas the convective boundary conditions were used at the outlet. The computational time step was set to 0.0005, which resulted in a CFL number of about 0.1. The initial position of the upstream flag was parallel to the streamwise direction, while the downstream flag was inclined at a small angle relative to the streamwise direction. Although the initial inclination angle of the downstream flag was different from the prescribed pitching motion of the leading edge, the results after several transient periods remained unchanged. The dynamics of the system were investigated by conducting simulations over a long time period, between 100 and 500 flapping periods, and the flow data obtained after the establishment of a steadily flapping state were analysed. The flow patterns were characterized by the drag coefficient
 $C_{d}$
, the evolution of the tail position, the power spectrum and the vorticity contours. Seven parameters were chosen to optimize the system configuration: the frequency ratio of the head of the downstream flag to the tail of the upstream flag
 $(f_{2h}/f_{0})$
, the gap distance (
 $G_{x}$
), the phase angles for the pitching and heaving motions (
 ${\it\Phi}_{pitching}$
and
 ${\it\Phi}_{heaving}$
), the amplitudes of the pitching and heaving motions (
 ${\it\Theta}$
and
 $Y$
) and the bending coefficient
 ${\it\gamma}$
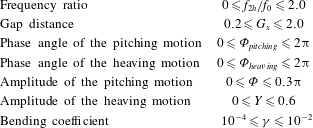
. The seven parameters lay within the ranges as listed in table 1. In the next section, we first examine the effects of the frequency ratio and the gap distance, then the variations of the phase angles as well as the flapping amplitudes, and finally the dependence of the results on the bending coefficient.
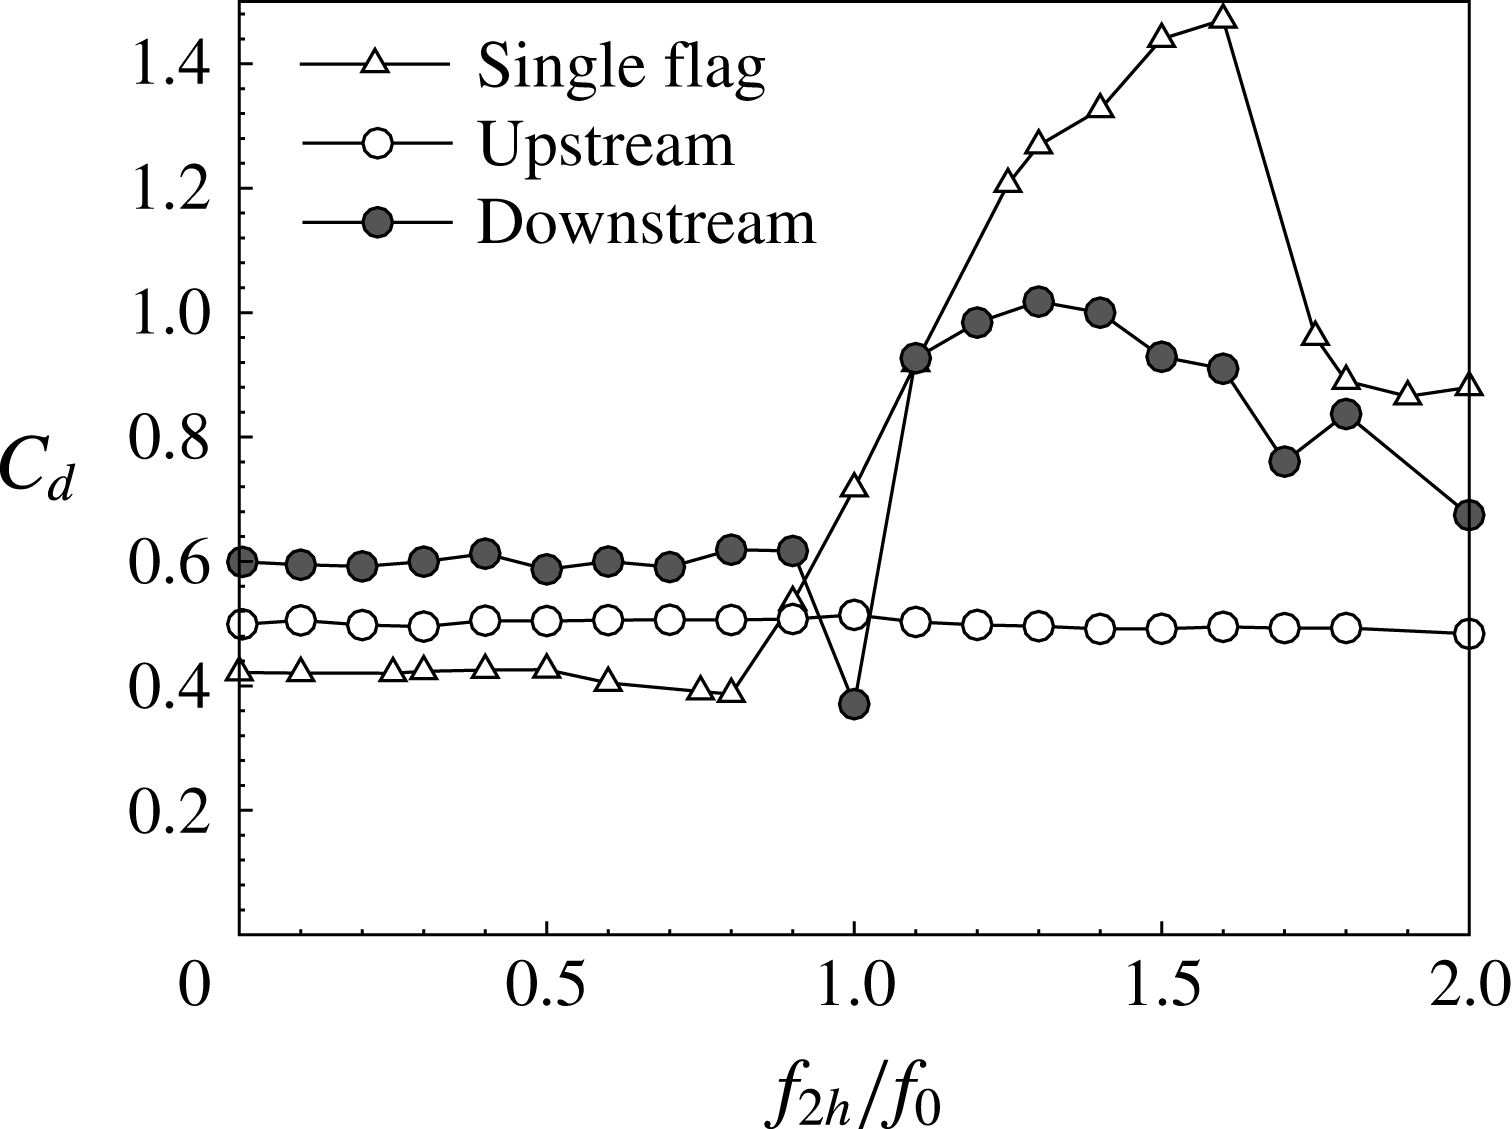
The drag coefficient as a function of the frequency ratio:
 ${\it\gamma}=0.006$
,
 $Re=300$
,
 $G_{x}=1.0$
,
 ${\it\Theta}=0.1{\rm\pi}$
,
 $Y=0.2$
,
 ${\it\Phi}_{pitching}=0.5{\rm\pi}$
,
 ${\it\Phi}_{heaving}=0$
.

The parameters in the present simulation.

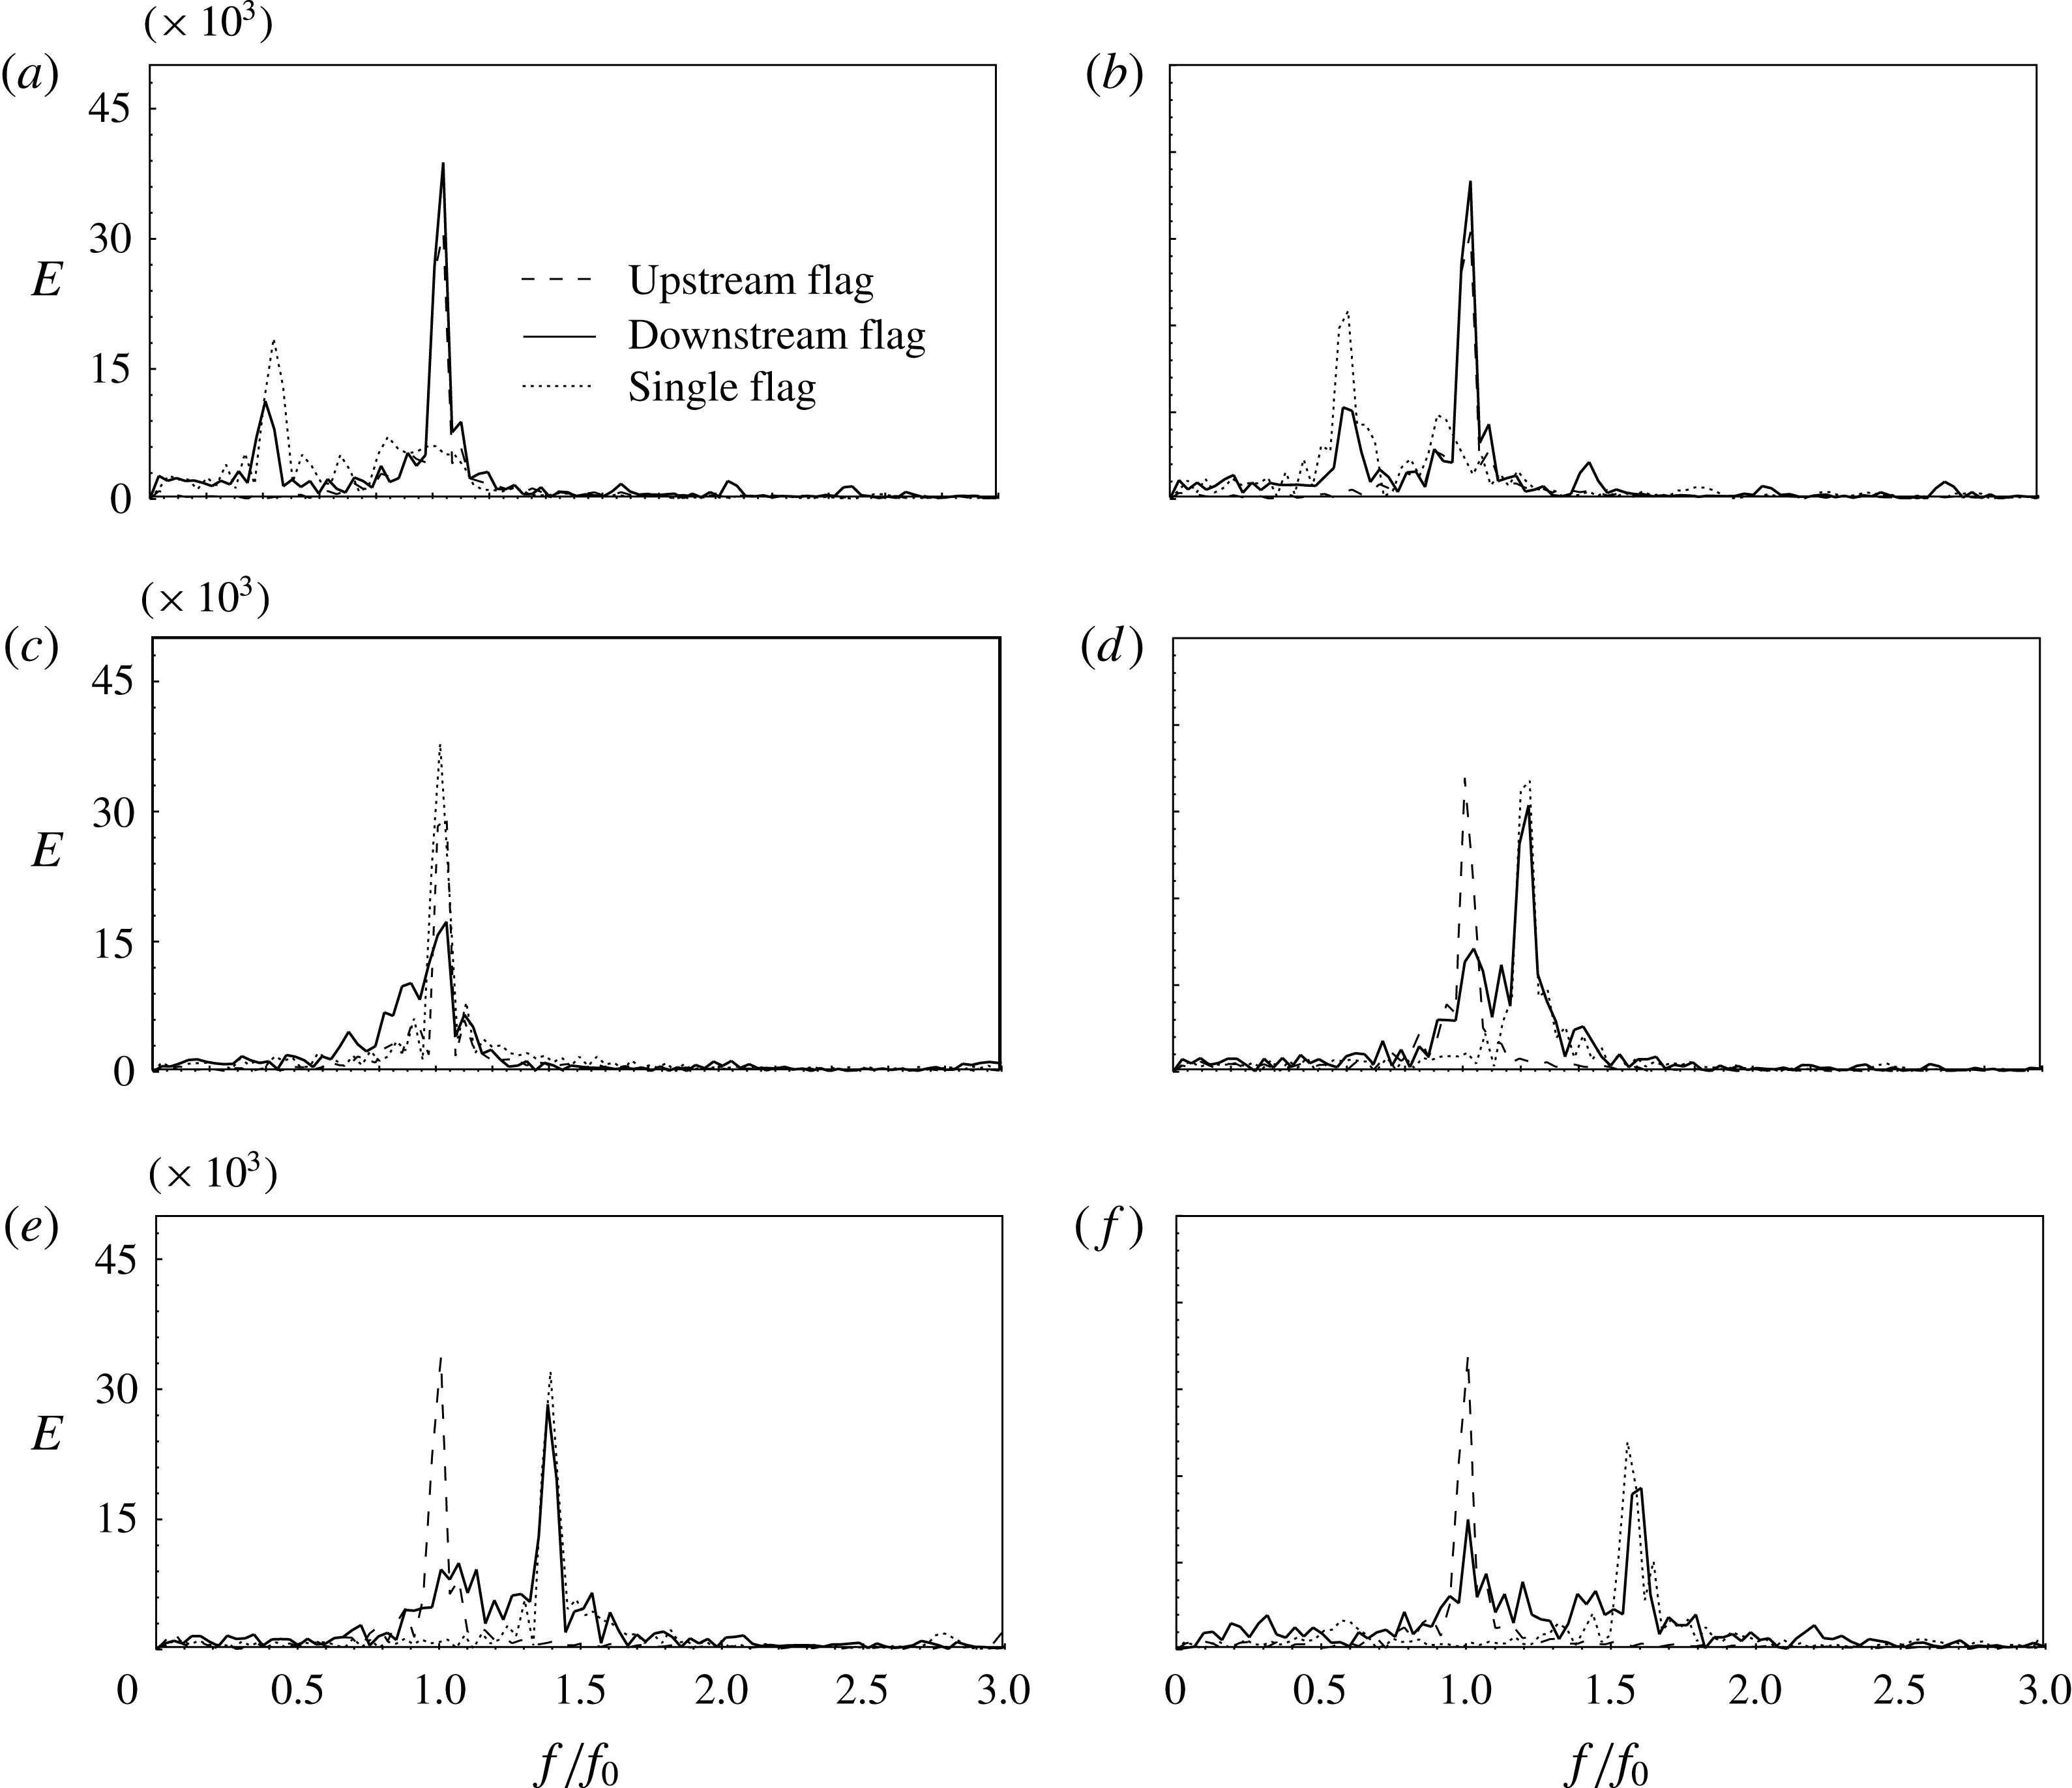
Power spectra of the tail positions as a function of the frequency ratio: (a)
 $f_{2h}/f_{0}=0.3$
; (b)
 $f_{2h}/f_{0}=0.6$
,
 $Re=300$
,
 $G_{x}=1.0$
,
 ${\it\gamma}=0.006$
; (c)
 $f_{2h}/f_{0}=1.0$
,
 ${\it\Theta}=0.1{\rm\pi}$
,
 $Y=0.2$
; (d)
 $f_{2h}/f_{0}=1.2$
,
 ${\it\Phi}_{pitching}=0.5{\rm\pi}$
,
 ${\it\Phi}_{heaving}=0$
; (e)
 $f_{2h}/f_{0}=1.4$
; (f)
 $f_{2h}/f_{0}=1.6$
.

3. Results and discussion
In the simulations, the following parameters were first selected, i.e.
 $Re=300$
, the mass ratio
 ${\it\rho}=1$
, the pitching and heaving amplitudes
 ${\it\Theta}=0.1{\rm\pi}$
and
 $Y=0.2$
, the phase angles
 ${\it\Phi}_{pitching}=0.5{\rm\pi}$
and
 ${\it\Phi}_{heaving}=0$
, and the bending coefficient
 ${\it\gamma}=0.006$
. Figure 2 shows the averaged drag coefficient,
 $C_{d}$
, of both the upstream and downstream flags as a function of the frequency ratio,
 $f_{2h}/f_{0}$
, where the flapping frequency of the upstream flag was assumed to remain unchanged and equal to the natural frequency of the single flag (
 $f_{0}=0.31$
).
 $C_{d}$
of the single pitching and heaving flag was also included for comparison. The value of
 $C_{d}$
of the upstream flag (
 $C_{d1}$
) changed only very slightly with
 $f_{2h}/f_{0}$
, indicating that the downstream flag exerted a negligible influence on the upstream flag. On the other hand, obvious changes of the downstream flag (
 $C_{d2}$
) were seen over the range
 $0\leqslant f_{2h}/f_{0}\leqslant 2.0$
. As seen in figure 2, at low frequency ratios, i.e.
 $f_{2h}/f_{0}<1.0$
,
 $C_{d2}$
remained constant, slightly higher than the upstream one. At
 $f_{2h}/f_{0}=1.0$
, a sudden decrease in
 $C_{d2}$
was observed; then for 1.0
 ${\leqslant}f_{2h}/f_{0}\leqslant 1.3$
,
 $C_{d2}$
increased significantly; for
 $f_{2h}/f_{0}>1.3$
,
 $C_{d2}$
decreased gradually. In figure 2, a similar trend was also observed for the single pitching and heaving flag, showing a sharp increase followed by a decrease in
 $C_{d}$
, which was consistent with the experimental results obtained from an oscillating foil by Anderson et al. (Reference Anderson, Streitlien, Barrett and Triantafyllou1998). Nevertheless, there were some different behaviours between the single and tandem cases. For instance,
 $C_{d}$
of the single pitching and heaving flag increased gradually within the vicinity of 1, rather than the sudden increase of the downstream flag. For
 $f_{2h}/f_{0}>1.3$
,
 $C_{d}$
of the single pitching and heaving flag decreased more sharply than in the tandem case. Such differences indicated that the vortices shed from the upstream flag influenced the downstream flag.
The drag coefficient as a function of the gap distance at different frequency ratios: (a)
 $f_{2h}/f_{0}=0.3$
,
 ${\it\Theta}=0.1{\rm\pi}$
,
 ${\it\gamma}=0.2$
; (b)
 $f_{2h}/f_{0}=0.6$
,
 $Re=300$
,
 $Y=0.006$
; (c)
 $f_{2h}/f_{0}=1.0$
,
 ${\it\Phi}_{pitching}=0.5{\rm\pi}$
,
 ${\it\Phi}_{heaving}=0$
; (d)
 $f_{2h}/f_{0}=1.2$
; (e)
 $f_{2h}/f_{0}=1.4$
; (f)
 $f_{2h}/f_{0}=1.6$
.

The power spectra of the tail positions at different frequency ratios are shown in figure 3. The dominant frequency of the upstream flag remained constant as
 $f_{2h}/f_{0}$
was varied. This dominant frequency was equal to the natural flapping frequency of the flag, whereas higher harmonics in the downstream flag were excited by the pitching and heaving motions. As seen in figure 3, two peaks in the spectra of the downstream flag were generally present: one corresponding to the natural flapping frequency
 $f_{0}$
and the other corresponding to the pitching and heaving frequency
 $f_{2h}$
. For
 $f_{2h}/f_{0}<1.0$
, the dominant frequency of the downstream flag was the natural flapping frequency
 $f_{0}$
, whereas for
 $f_{2h}/f_{0}>1.0$
, the pitching and heaving frequency
 $f_{2h}$
became dominant. On the other hand, the dominant frequency for the single pitching and heaving flag was the imposed flapping frequency. For
 $f_{2h}/f_{0}<1.0$
, a weak peak was present at the natural flapping frequency for the single flapping flag, which became invisible for
 $f_{2h}/f_{0}>1.0$
. A comparison between the single and tandem cases revealed that the dominance of the natural flapping frequency of the downstream flag for
 $f_{2h}/f_{0}<1.0$
resulted from the vortices shed upstream, whereas the dominance of the imposed frequency for
 $f_{2h}/f_{0}>1.0$
arose from the energetic excitation exerted on the downstream flag by the actively flapping leading edge. The change in the dominant frequency of the downstream flag reflected a transition of the vortex–flag interaction modes, which sharply increased the drag of the downstream flag as the pitching and heaving frequency increased (figure 2).
Time histories of the head and tail positions (a–e) and vorticity contours, together with the body shape (f–j) at
 $f_{2h}/f_{0}=0.3$
: (a)
 $G_{x}=0.2$
; (b)
 $G_{x}=0.6$
; (c)
 $G_{x}=1.0$
; (d)
 $G_{x}=1.4$
; (e)
 $G_{x}=\infty$
. Other parameters were
 $Re=300$
,
 $Y=0.2$
,
 ${\it\Theta}=0.1{\rm\pi}$
,
 ${\it\Phi}_{pitching}=0.5{\rm\pi}$
,
 ${\it\Phi}_{heaving}=0$
,
 ${\it\gamma}=0.006$
.

The phase difference between the tail positions of the downstream and upstream flags as a function of the frequency ratio: (a)
 $f_{2h}/f_{0}=0.3$
; (b)
 $f_{2h}/f_{0}=1.0$
. Other parameters are
 $Re=300$
,
 $Y=0.2$
,
 ${\it\Phi}=0.1{\rm\pi}$
,
 ${\it\Phi}_{pitching}=0.5{\rm\pi}$
,
 ${\it\Phi}_{heaving}=0$
,
 ${\it\gamma}=0.006$
.

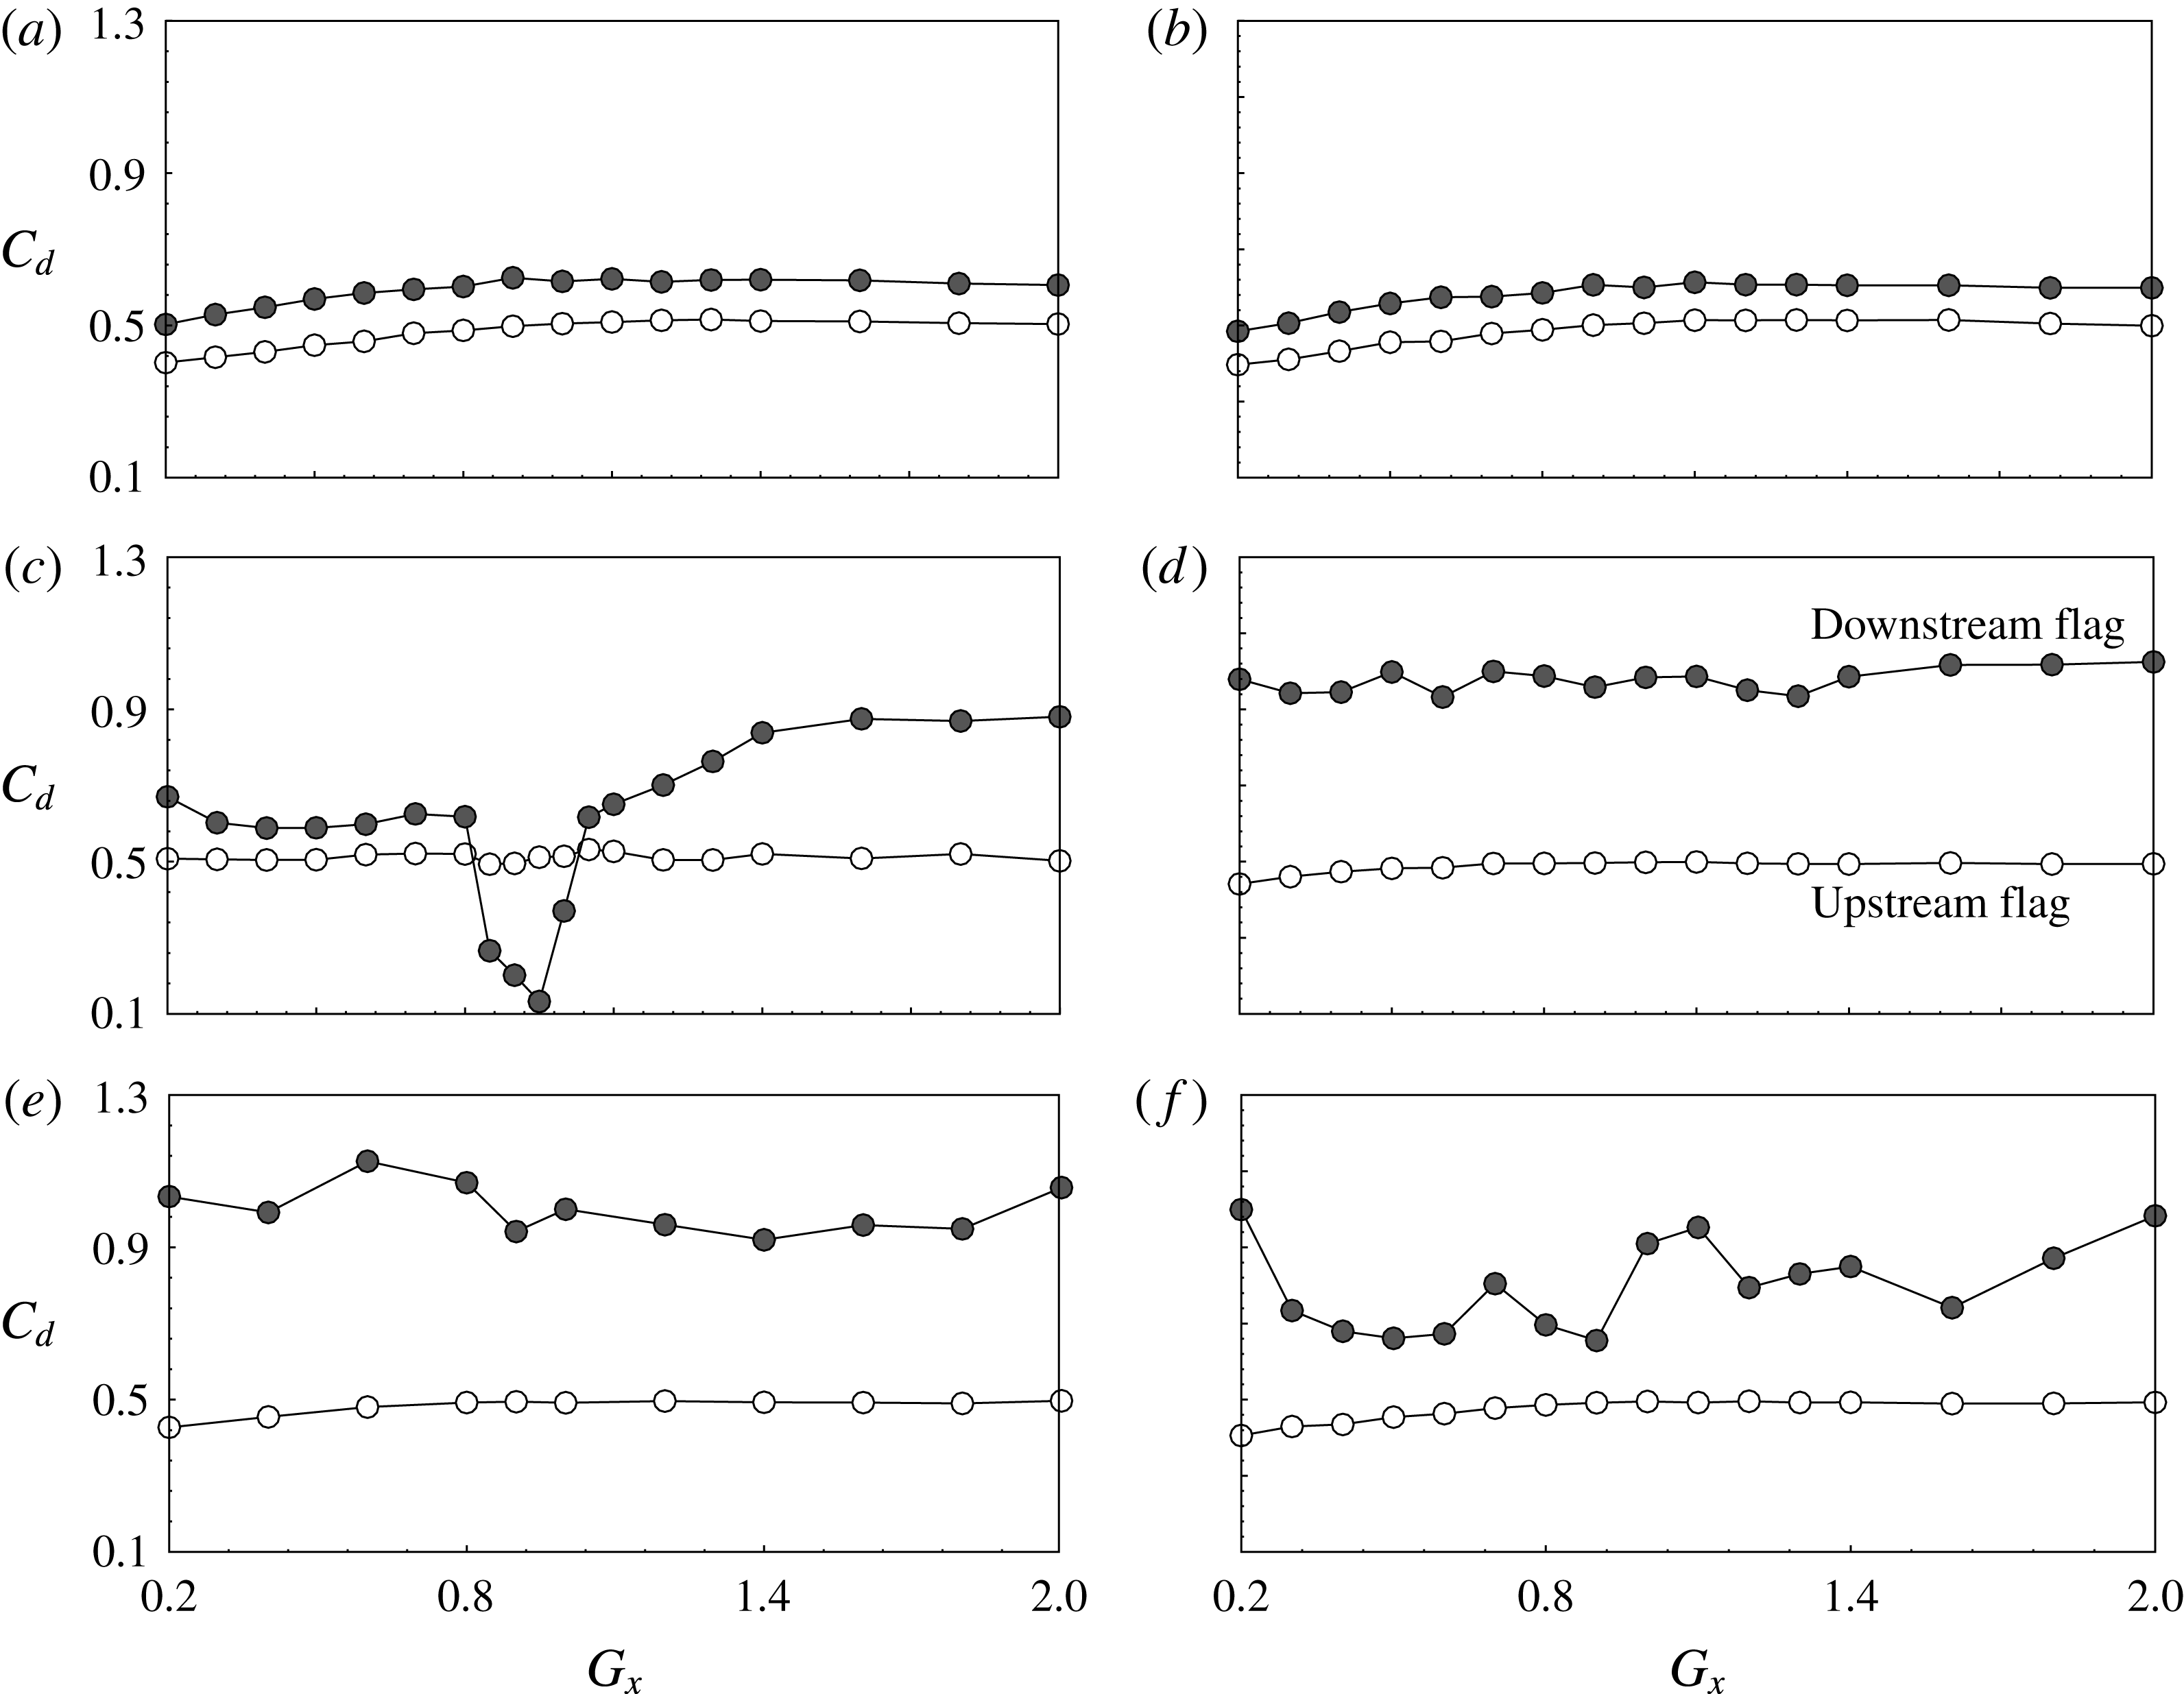
Figure 4 shows the drag coefficient as a function of the gap distance (
 $G_{x}$
) for different frequency ratios. At low frequency ratios, i.e.,
 $f_{2h}/f_{0}=0.3$
and 0.6, the drag coefficient of the downstream flag,
 $C_{d2}$
, was higher than that of the upstream flag,
 $C_{d1}$
. The drag forces changed only slightly as
 $G_{x}$
was varied. Recall that in a system of two tandem flapping flags with fixed leading edges (Kim et al.
Reference Kim, Huang and Sung2010), both the constructive and destructive vortex interaction modes were present. The former was observed at
 $Re=200$
for all gap distances, where the drag coefficient of the downstream flag was increased; the latter was observed at
 $Re=400$
, which induced a significant drag reduction of the downstream flag at certain gap distances. Here, the actively flapping flag at
 $Re=300$
with low frequency ratios was similar to the constructive mode of the passively flapping flag.
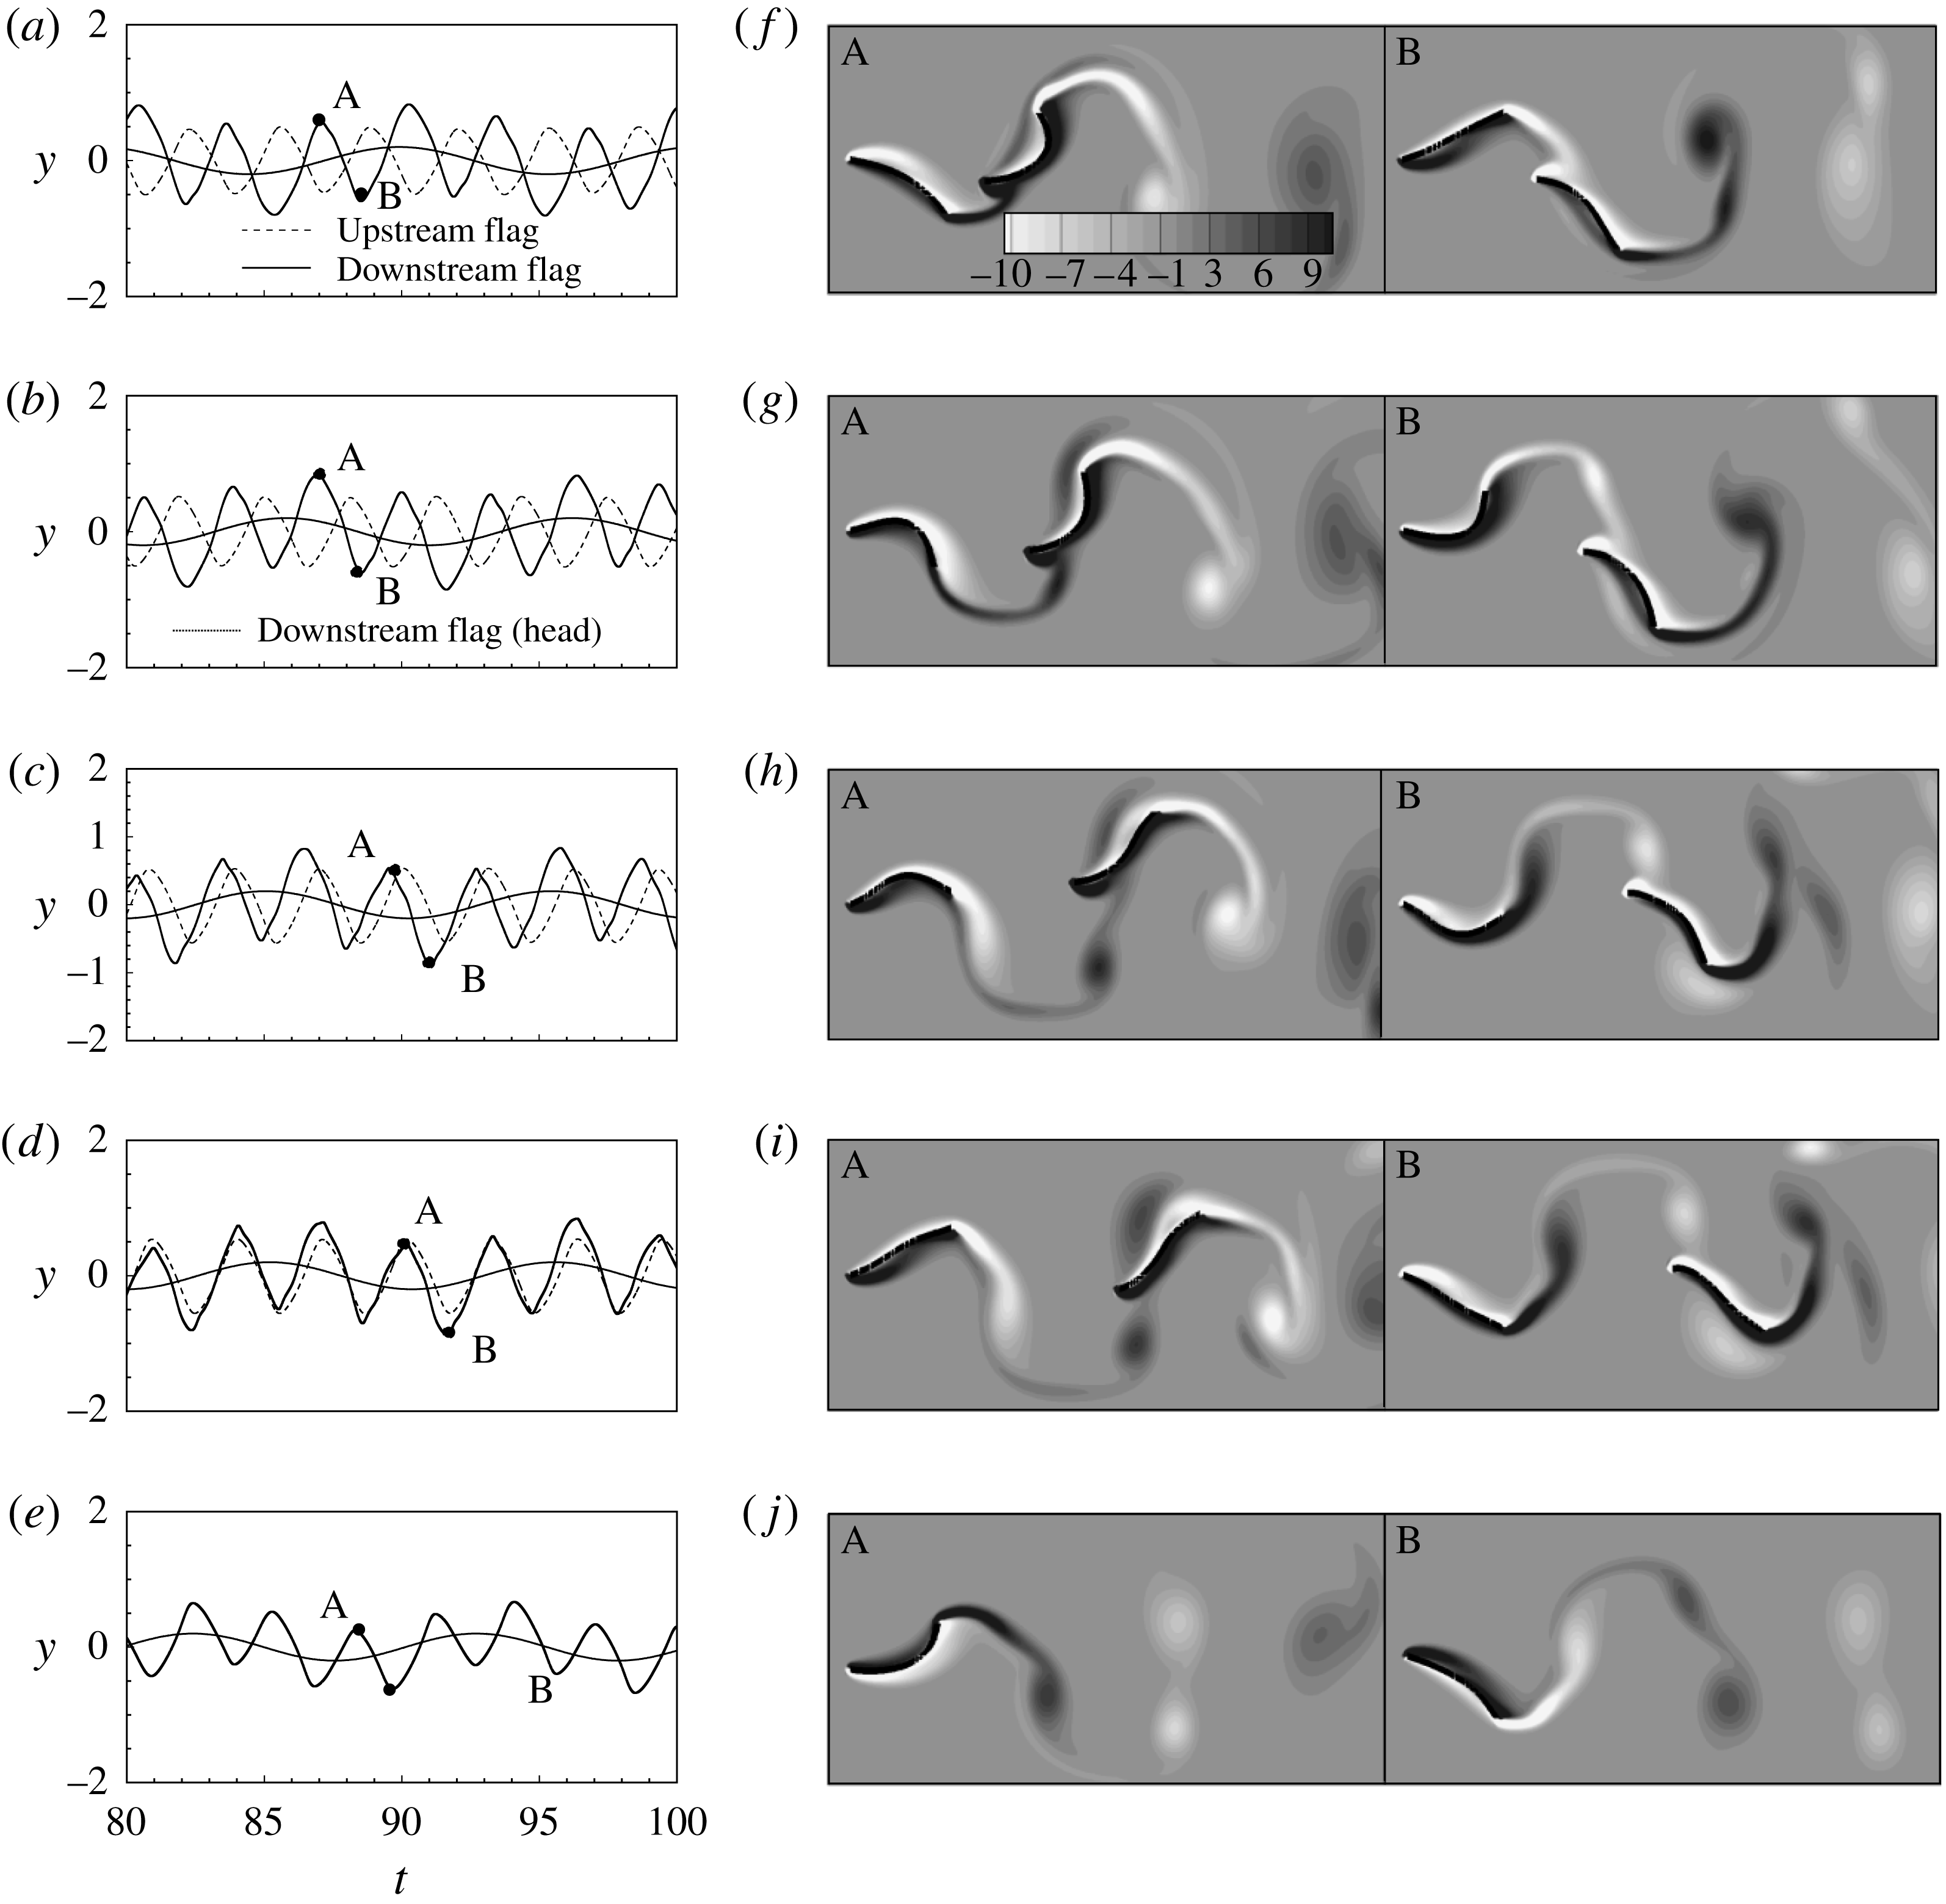
The instantaneous vorticity contours at different gap distances and
 $f_{2h}/f_{0}=0.3$
are displayed in figure 5, together with the time histories of the head and tail positions of the flags. The upstream shedding vortices always interacted with the downstream flag in the constructive mode. Because the head of the downstream flag moved more slowly than the tail of the upstream flag, the flapping of the downstream flag was modulated by the upstream shedding vortices, as observed in the time histories of the tail positions. On the other hand, two pairs of vortices were shed in each flapping period from the single pitching and heaving flag at
 $f_{2h}/f_{0}=0.3$
(figure 5
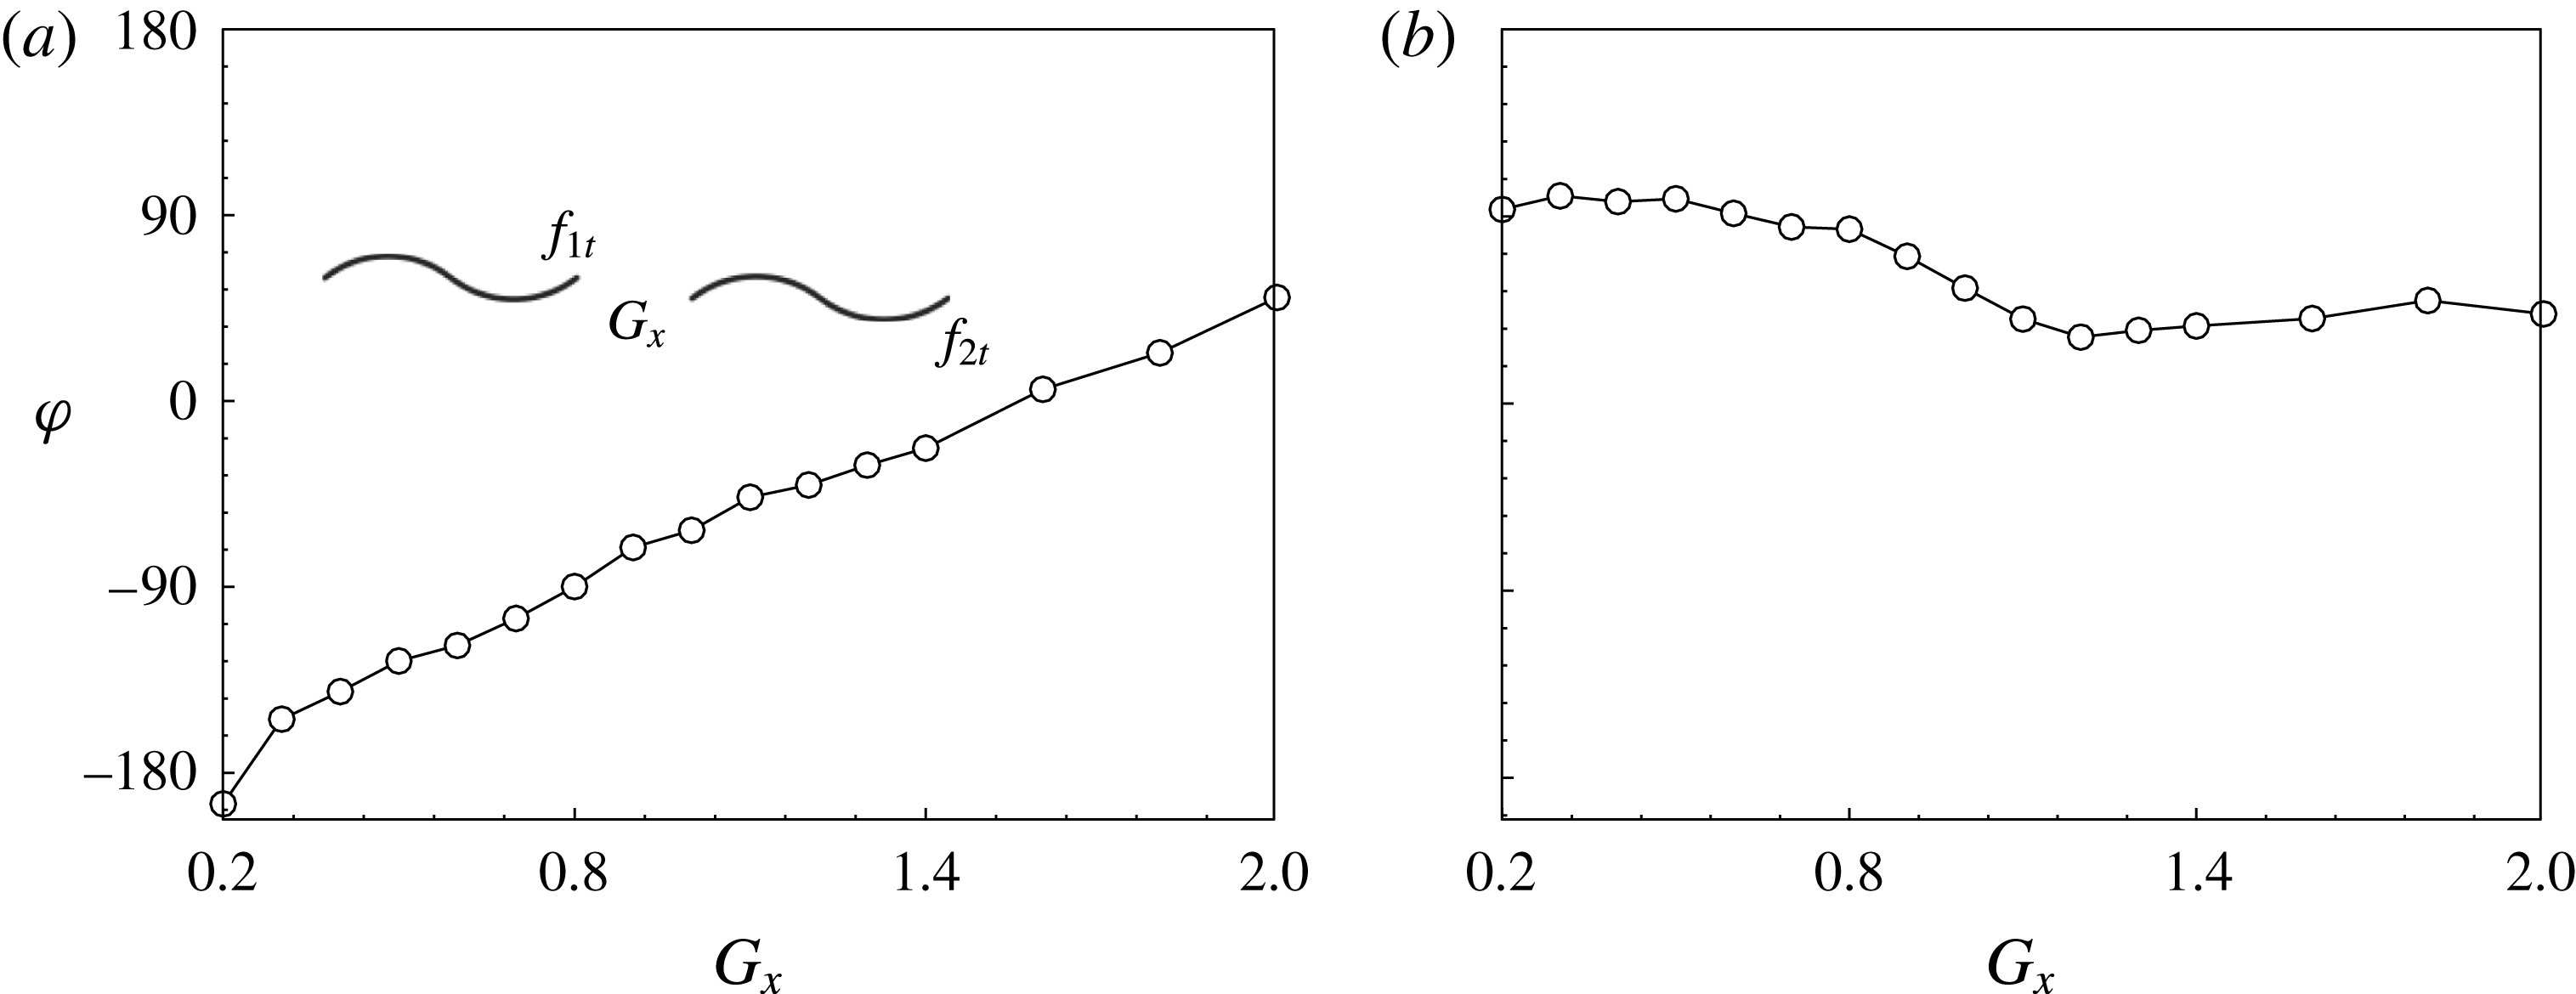
e), i.e. 2P mode (Williamson & Govardhan Reference Williamson and Govardhan2004). As a result of the vortex interactions, the flag that pitched and heaved at a low frequency behaved similarly to the passively flapping flags in a tandem arrangement. Additional evidence can be found in figure 6, which shows the phase difference between the tail positions of the upstream and downstream flags. For
 $f_{2h}/f_{0}=0.3$
(figure 6
a), the phase difference increased linearly with the gap distance, which was proportional to the time required for the vortices shed upstream to arrive at the downstream flag, consistent with the passively flapping tandem flags (Kim et al.
Reference Kim, Huang and Sung2010).
At
 $f_{2h}/f_{0}=1.0$
the downstream flag experienced a significant drag reduction at the gap distance close to 1.0, as shown in figure 4(c). At this frequency ratio, the head of the downstream flag followed the tail of the upstream flag, as seen in the time histories of the tail positions in figure 7, whereas the tail of the downstream flag led by a phase angle. The phase angle was nearly constant (
 ${\rm\pi}/2$
) for small
 $G_{x}$
, decreased to a small value when
 $G_{x}$
was close to 1.0 and remained small as
 $G_{x}$
increased further (figure 6
b). The vorticity contours in figure 7(a) and (b) showed that the constructive mode was formed at small gap distances as the vortices were not fully detached from the upstream flag, like the case of
 $f_{2h}/f_{0}=0.3$
. As
 $G_{x}$
was close to 1.0 (figure 7
c), the downstream flag passed in between the pairs of vortices shed from the upstream one, resulting in a slalom mode and a drag reduction of the downstream flag. As
 $G_{x}$
increased further (figure 7
d), the leading edge of the downstream flag always moved through one of the pair of vortices, resulting in an interception mode and a significant increase in drag.
Time histories of the head and tail positions (a–e) and vorticity contours, together with the body shape (f–j) at
 $f_{2h}/f_{0}=1.0$
(rather than for
 $f_{2h}/f_{0}=0.3$
, in figure 5): (a)
 $G_{x}=0.2$
; (b)
 $G_{x}=0.6$
; (c)
 $G_{x}=0.9$
; (d)
 $G_{x}=1.4$
; (e)
 $G_{x}=\infty$
. Other parameters were
 $Re=300$
,
 $Y=0.2$
,
 ${\it\Theta}=0.1{\rm\pi}$
,
 ${\it\Phi}_{pitching}=0$
,
 ${\it\Phi}_{heaving}=0$
,
 ${\it\gamma}=0.006$
.

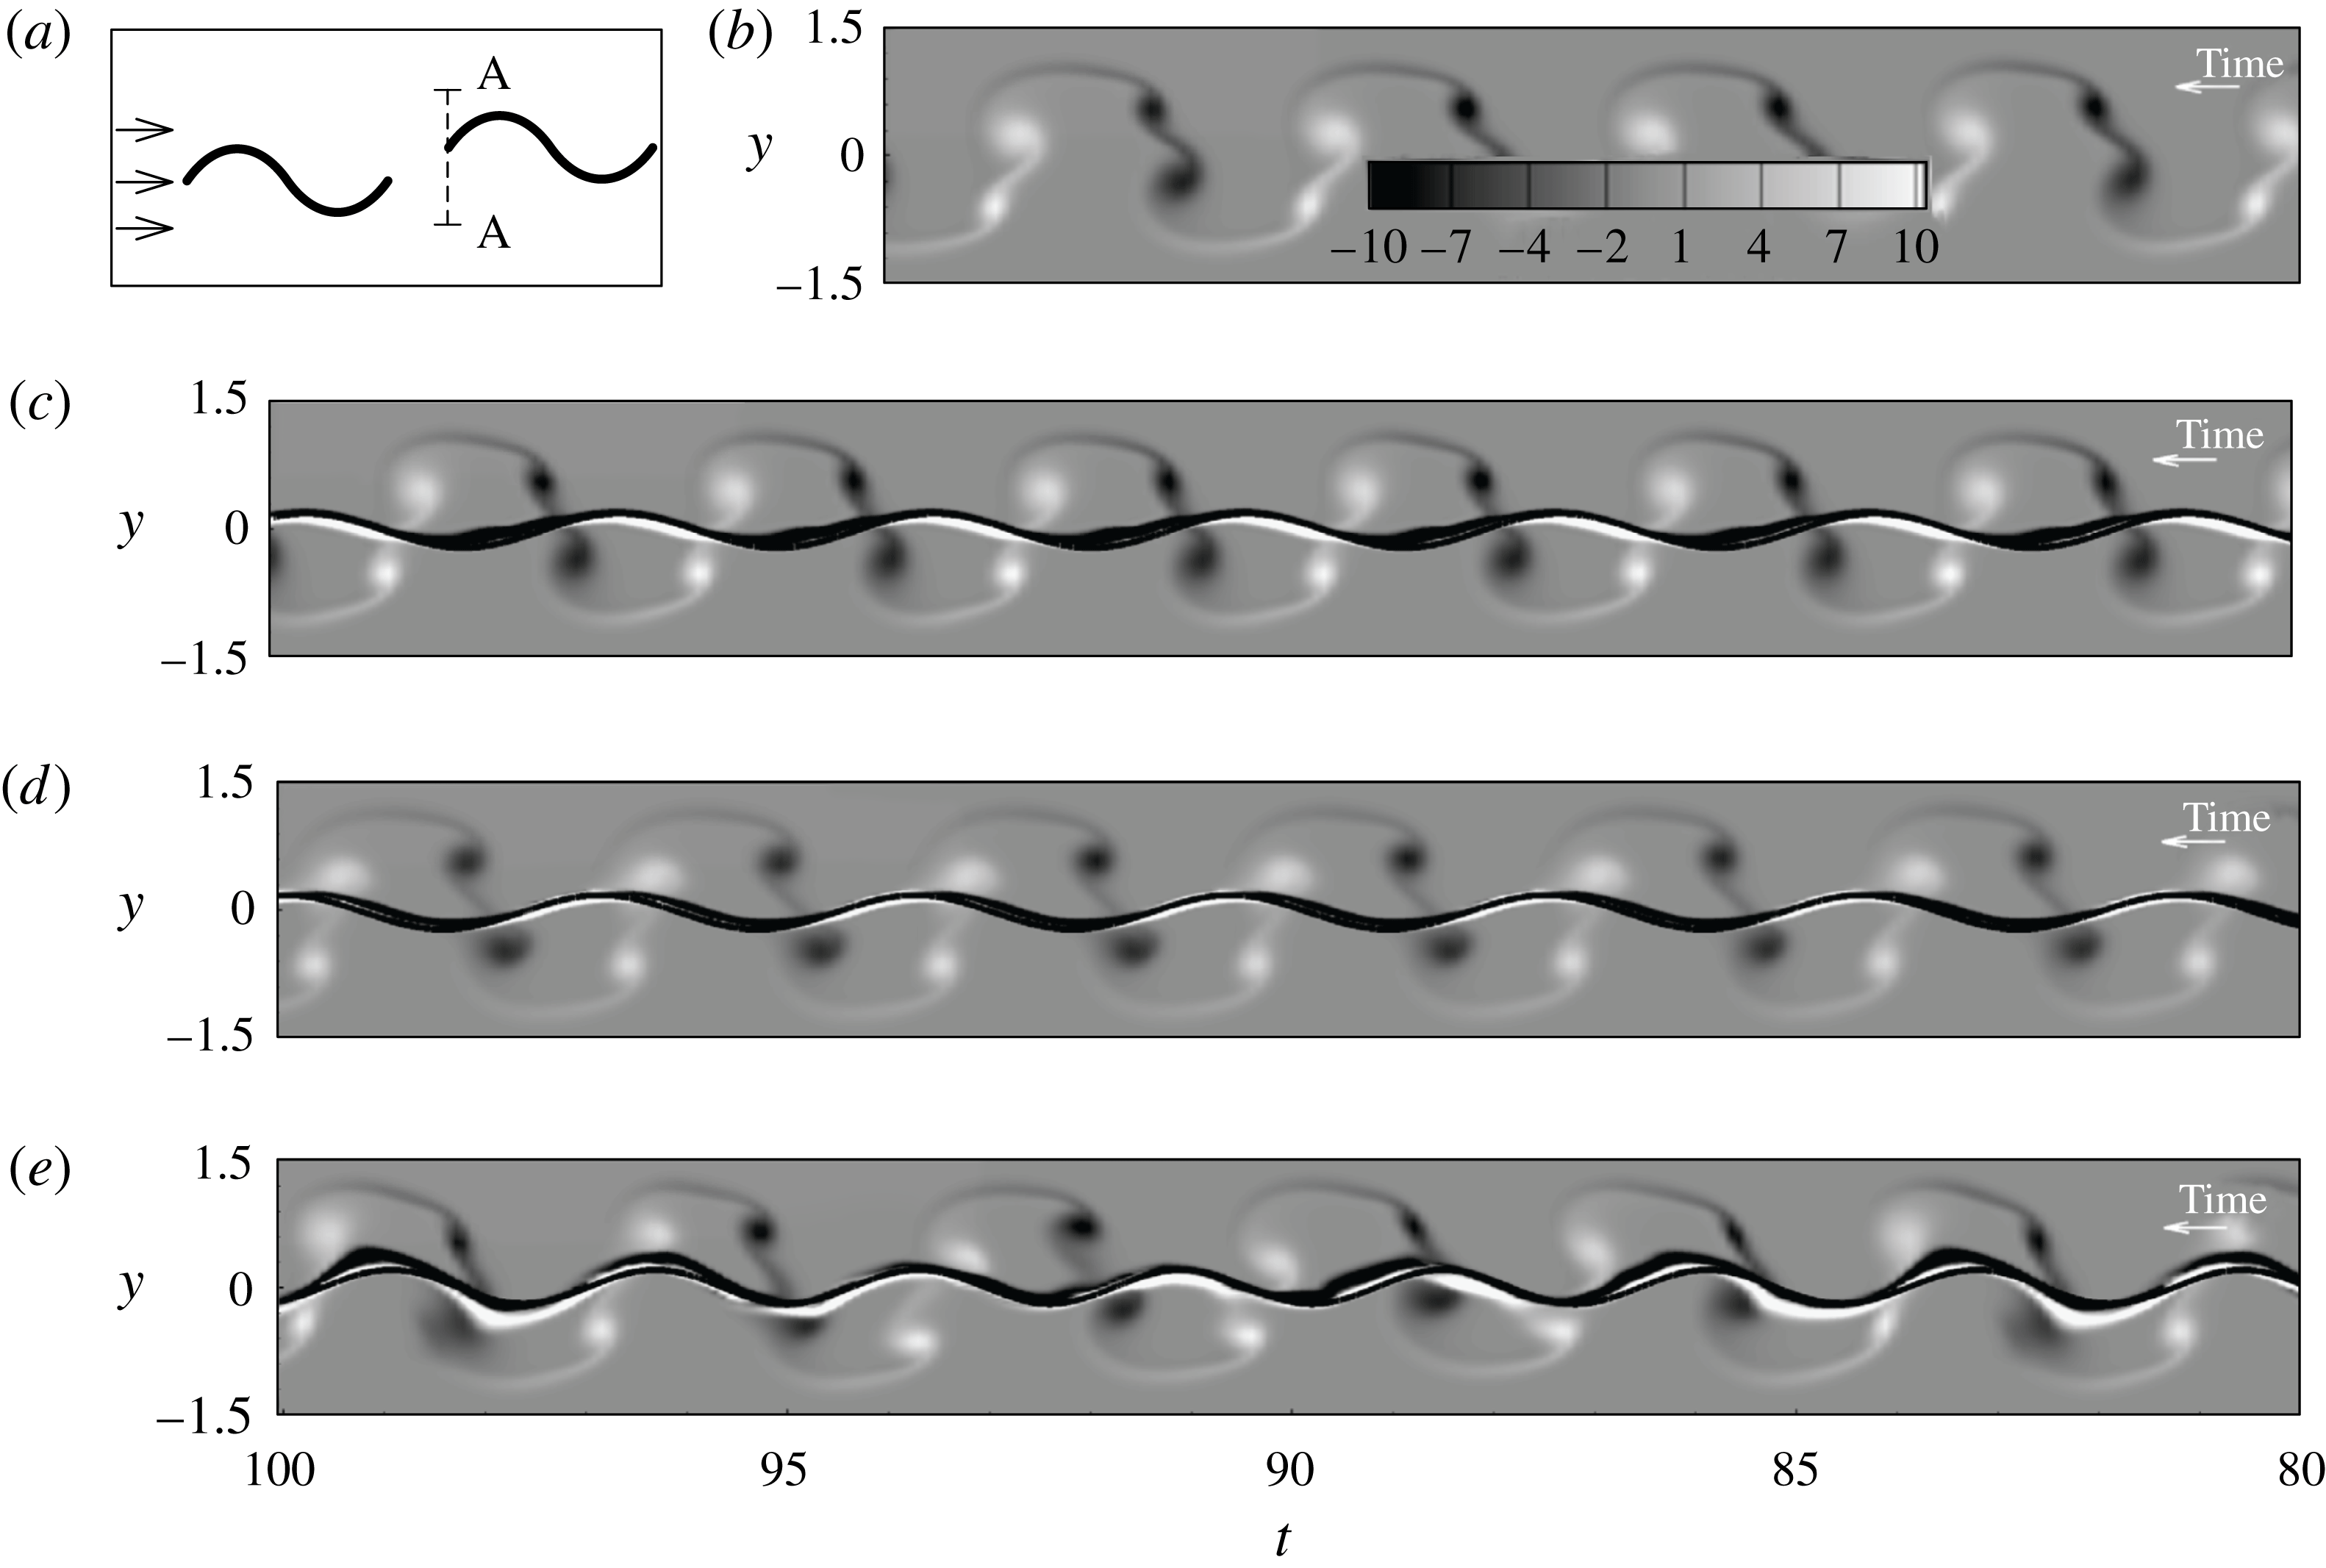
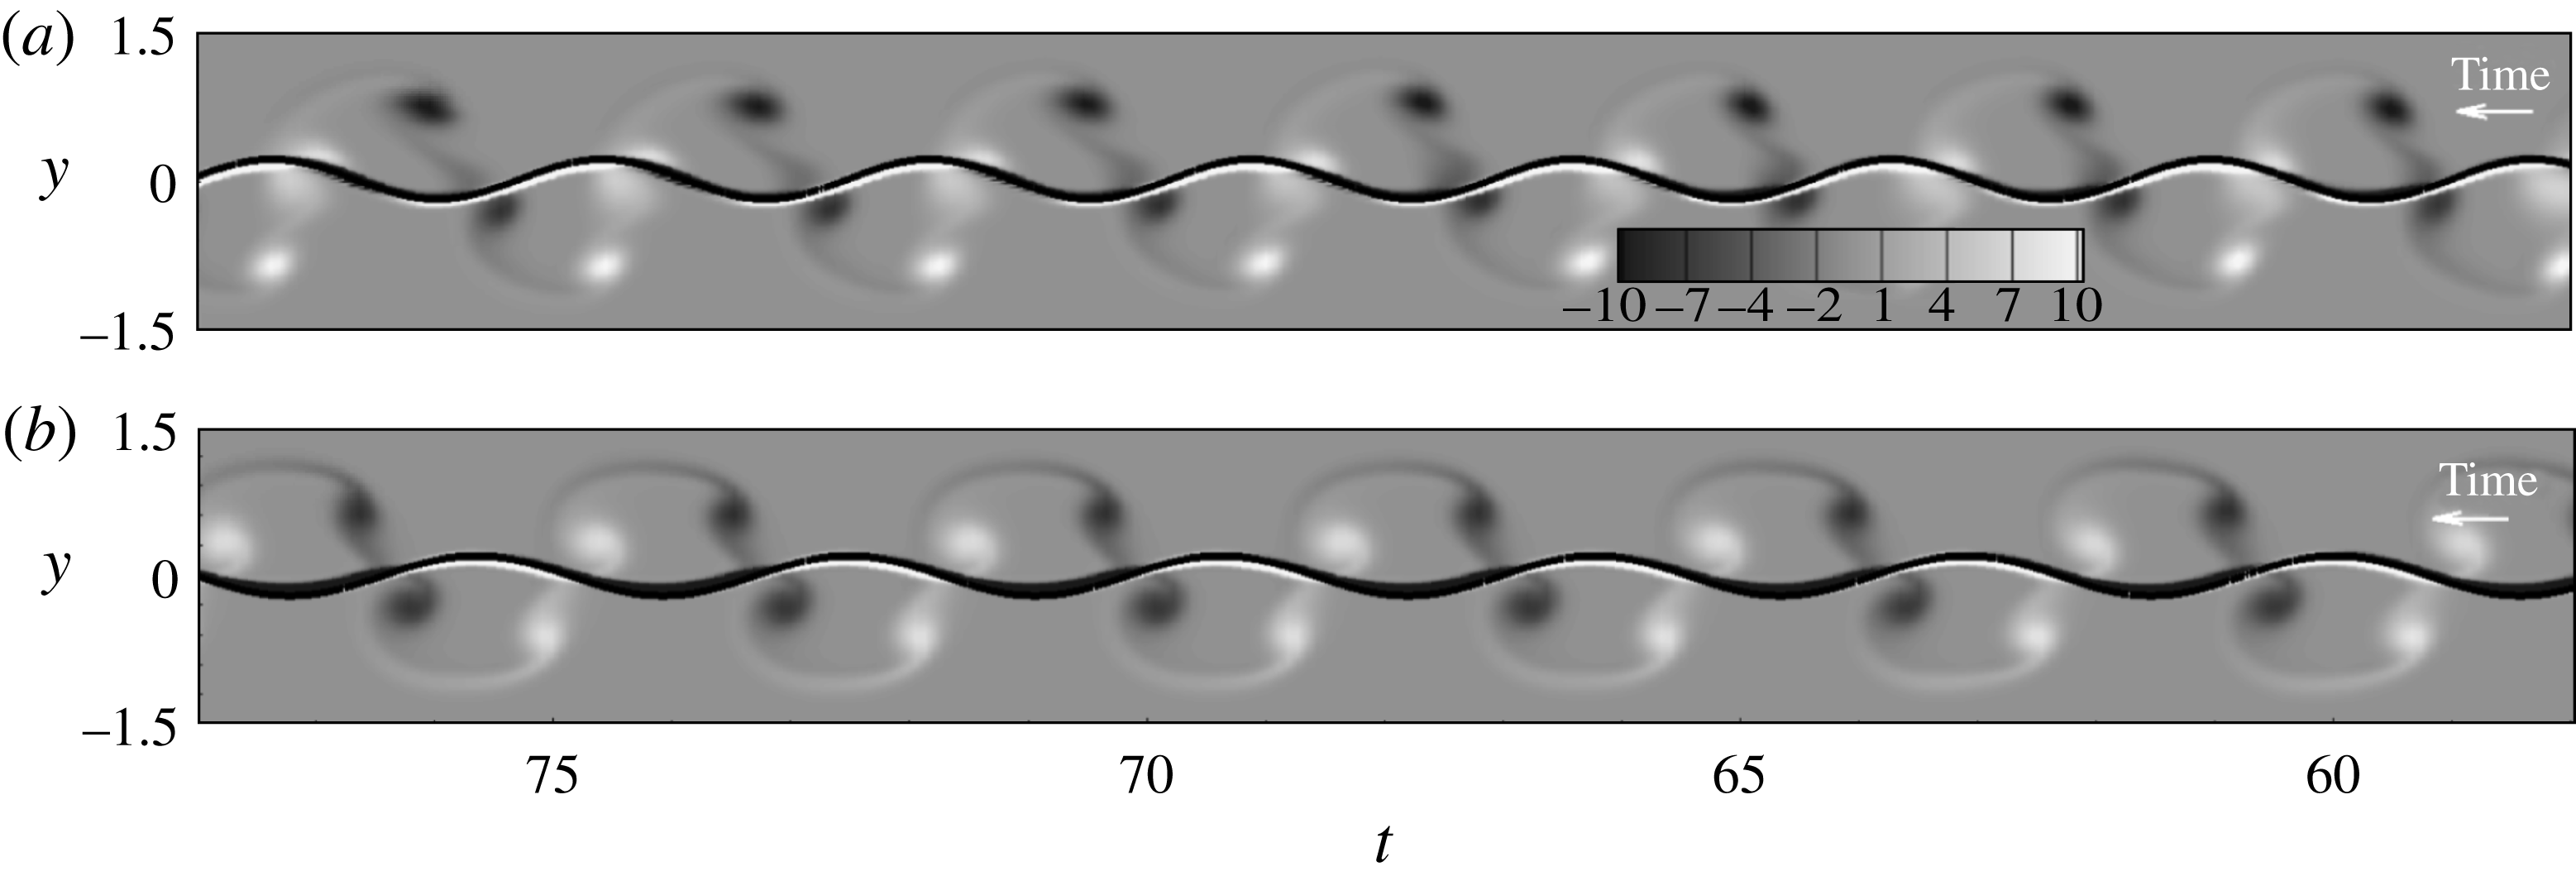
Time evolution of the vorticity along the vertical line at the leading edge of the downstream flag is displayed in figure 8. The image was analogous to that recorded by a streak camera, and similar ones can be found in Jia & Yin (Reference Jia and Yin2008) and Zhu et al. (Reference Zhu, He and Zhang2014c
). The direction of time advance was leftward, opposite to the incoming flow, so it looked as if the flag was swimming in a quiescent fluid. The results were clear in the sense that only the relative motion of the body to the surrounding fluid at a specific streamwise location was displayed. For reference, time evolution of the vorticity obtained from the single passively flapping flag is displayed in figure 8(b), which assumed the 2P mode. For
 $f_{2h}/f_{0}=1.0$
and
 $G_{x}=0.9$
, i.e. the low-drag case in figure 7(c), figure 8(c) showed that the head of the downstream flag moved in between the pairs of vortices, i.e. the slalom mode. On the other hand, for
 $f_{2h}/f_{0}=1.0$
and
 $G_{x}=1.4$
(figure 8
d), i.e. the high-drag case in figure 7(d), the head of the downstream flag always passed across one of each pair of vortices, i.e. the interception mode. Similarly, time evolution of the vorticity at the middle position of the downstream flag is shown in figure 9. We can find the slalom mode (figure 9
c) and the interception mode (figure 9
d), corresponding to the reduced and enhanced flapping amplitudes, respectively. The difference between the two vortex–flag interaction modes is also displayed by the movies in the supplementary data available online at http://dx.doi.org/10.1017/jfm.2015.460.
Time evolution of the vorticity along the vertical line at the head of the downstream flag, together with the trajectory of the head motion: (a) schematic diagram; (b)
 $f_{2h}/f_{0}=1.0$
for the single flag; (c)
 $f_{2h}/f_{0}=1.0$
,
 $G_{x}=0.9$
; (d)
 $f_{2h}/f_{0}=1.0$
,
 $G_{x}=1.4$
; (e)
 $f_{2h}/f_{0}=1.2$
,
 $G_{x}=1.0$
.

Time evolution of the vorticity along the vertical line through the middle point of the downstream flag, together with the trajectory of the middle point of the downstream flag: (a) schematic diagram; (b)
 $f_{2h}/f_{0}=1.0$
for the single flag; (c)
 $f_{2h}/f_{0}=1.0$
,
 $G_{x}=0.9$
; (d)
 $f_{2h}/f_{0}=1.0$
,
 $G_{x}=1.4$
; (e)
 $f_{2h}/f_{0}=1.2$
,
 $G_{x}=1.0$
.

The reason for inducing the low/high-drag force in the slalom/interception mode can be explained by the schematics in figure 10. For the slalom mode (figure 10
a), the head motion of the downstream flag (
 $v_{F}$
) coincided with the vortex-induced velocity (
 $v_{{\it\Gamma}}$
), while for the vortex interception mode (figure 10
b),
 $v_{F}$
was opposite to
 $v_{{\it\Gamma}}$
in the
 $y$
-direction. Note that the current mechanism discussed above was consistent with the findings of Liao et al. (Reference Liao, Beal, Lauder and Triantafyllou2003) and Jia & Yin (Reference Jia and Yin2008), but was opposite to that of Zhu et al. (Reference Zhu, He and Zhang2014c
). In Zhu et al. (Reference Zhu, He and Zhang2014c
), the actively flapping flag with self-propulsion was prone to pass through the upstream vortices to save energy. It should be pointed out that such a difference was caused by the set-up of the problem. In the self-propulsion case, the reversed Karman vortex street was formed behind the upstream swimming body to generate the thrust, while the traditional Karman vortex street was attained in the drag wake of the passively flapping flag, pinned in the incoming flow. The above comparison showed the different natures of vortex–body interactions for fish swimming in different vortical environments.
Schematics of (a) the slalom mode and (b) the interception mode. The central dashed line denotes the trajectory of the head motion. The circles with arrows denote the vortices.
 $v_{F}$
denotes the velocity of the head motion and
 $v_{{\it\Gamma}}$
denotes the vortex-induced velocity.

For
 $f_{2h}/f_{0}>1.0$
, the head of the downstream flag moved faster than the oncoming vortices. The interception of vortices by the downstream flag was always present, as seen in figure 11 for
 $f_{2h}/f_{0}=1.2$
, and figures 8(e) and 9(e) as well. By further increasing the pitching and heaving frequency, more complicated vortex–body interactions were induced, and variation of the drag of the downstream flag with the gap distance became more irregular, as seen in figure 4(d–f). However, the increase in drag was mainly attributed to the pitching and heaving motions rather than the influence of the upstream shedding vortices. The reason can be seen by comparing the single and tandem cases in figure 2, and from the fact that the dominant frequency was the pitching and heaving frequency as
 $f_{2h}/f_{0}>1$
(see figure 3(d–f)). From the energetic point of view, the head motion of the downstream flag with a frequency higher than the upstream shedding vortices was not found for a stably swimming fish under the influence of the vortical wake.
For comparison to the plots shown in figures 5 and 7. Time histories of the head and tail positions (a–e) and vorticity contours, together with the body shape (f–j) at
 $f_{2h}/f_{0}=1.2$
(rather than for
 $f_{2h}/f_{0}=0.3$
, in figure 5): (a)
 $G_{x}=0.2$
; (b)
 $G_{x}=0.6$
; (c)
 $G_{x}=1.0$
; (d)
 $G_{x}=1.4$
; (e)
 $G_{x}=\infty$
.

In the following, the effects of the phase angles
 ${\it\Phi}_{pitching}$
and
 ${\it\Phi}_{heaving}$
, and the pitching and heaving amplitudes
 ${\it\Theta}$
and
 $Y$
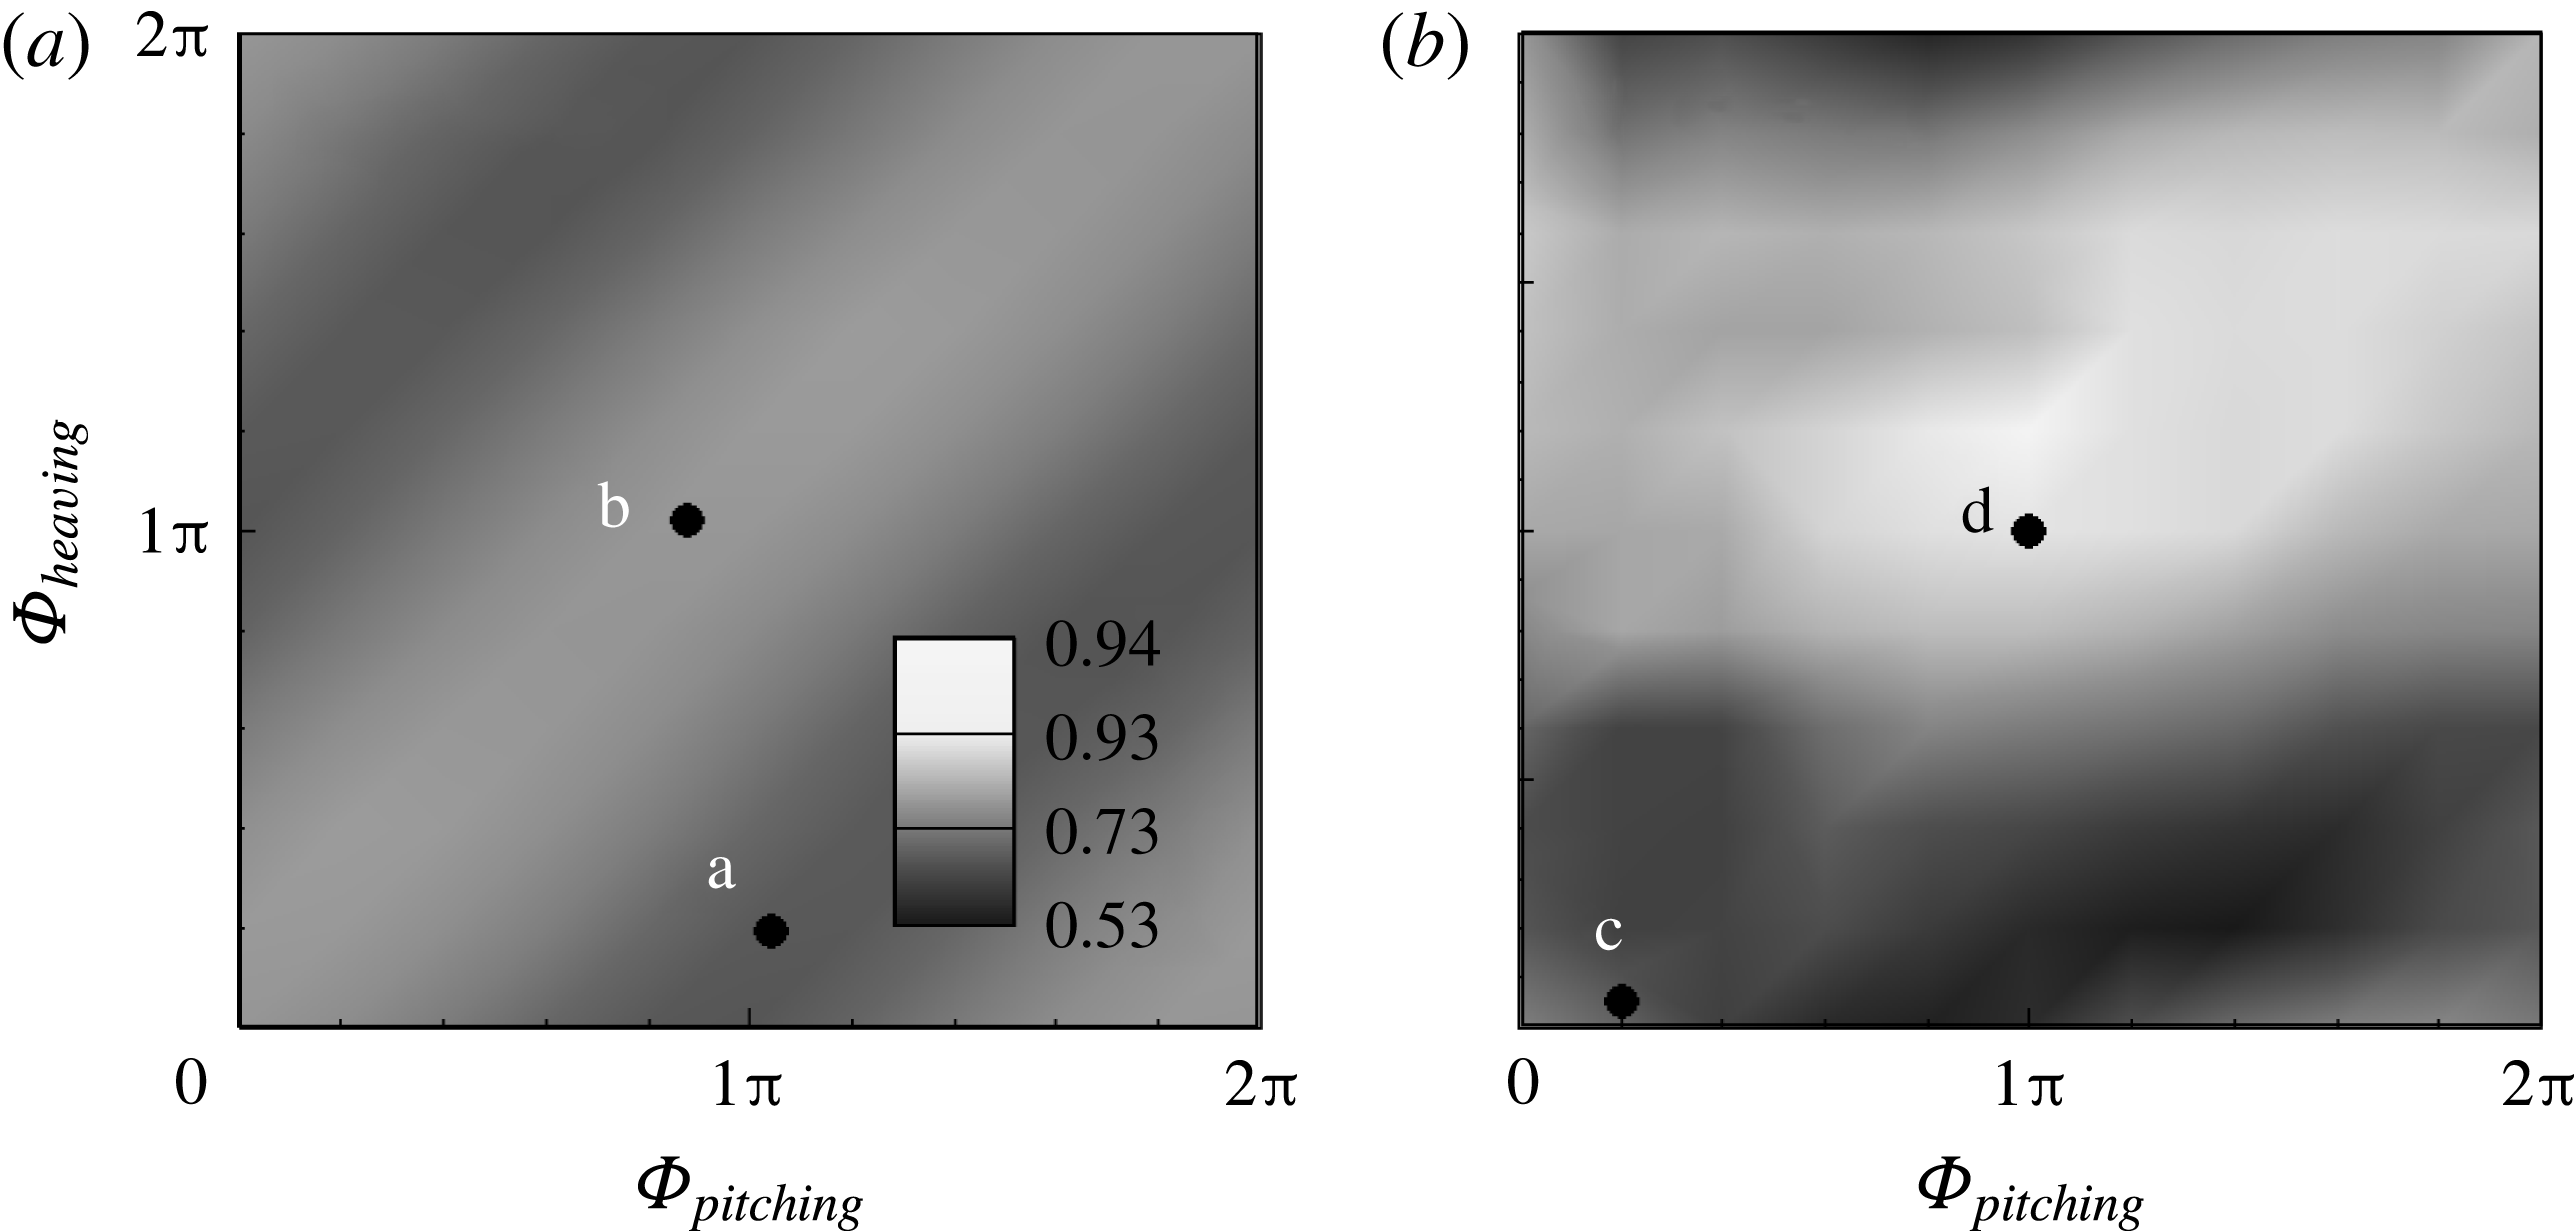
, were examined. Figure 12 shows the contours of the drag coefficient of the downstream flag,
 $C_{d2}$
, as a function of
 ${\it\Phi}_{pitching}$
and
 ${\it\Phi}_{heaving}$
for
 $G_{x}=\infty$
and
 $G_{x}=1.0$
at
 $f_{2h}/f_{0}=1.0$
, respectively, and those of
 ${\it\Theta}$
and
 $Y$
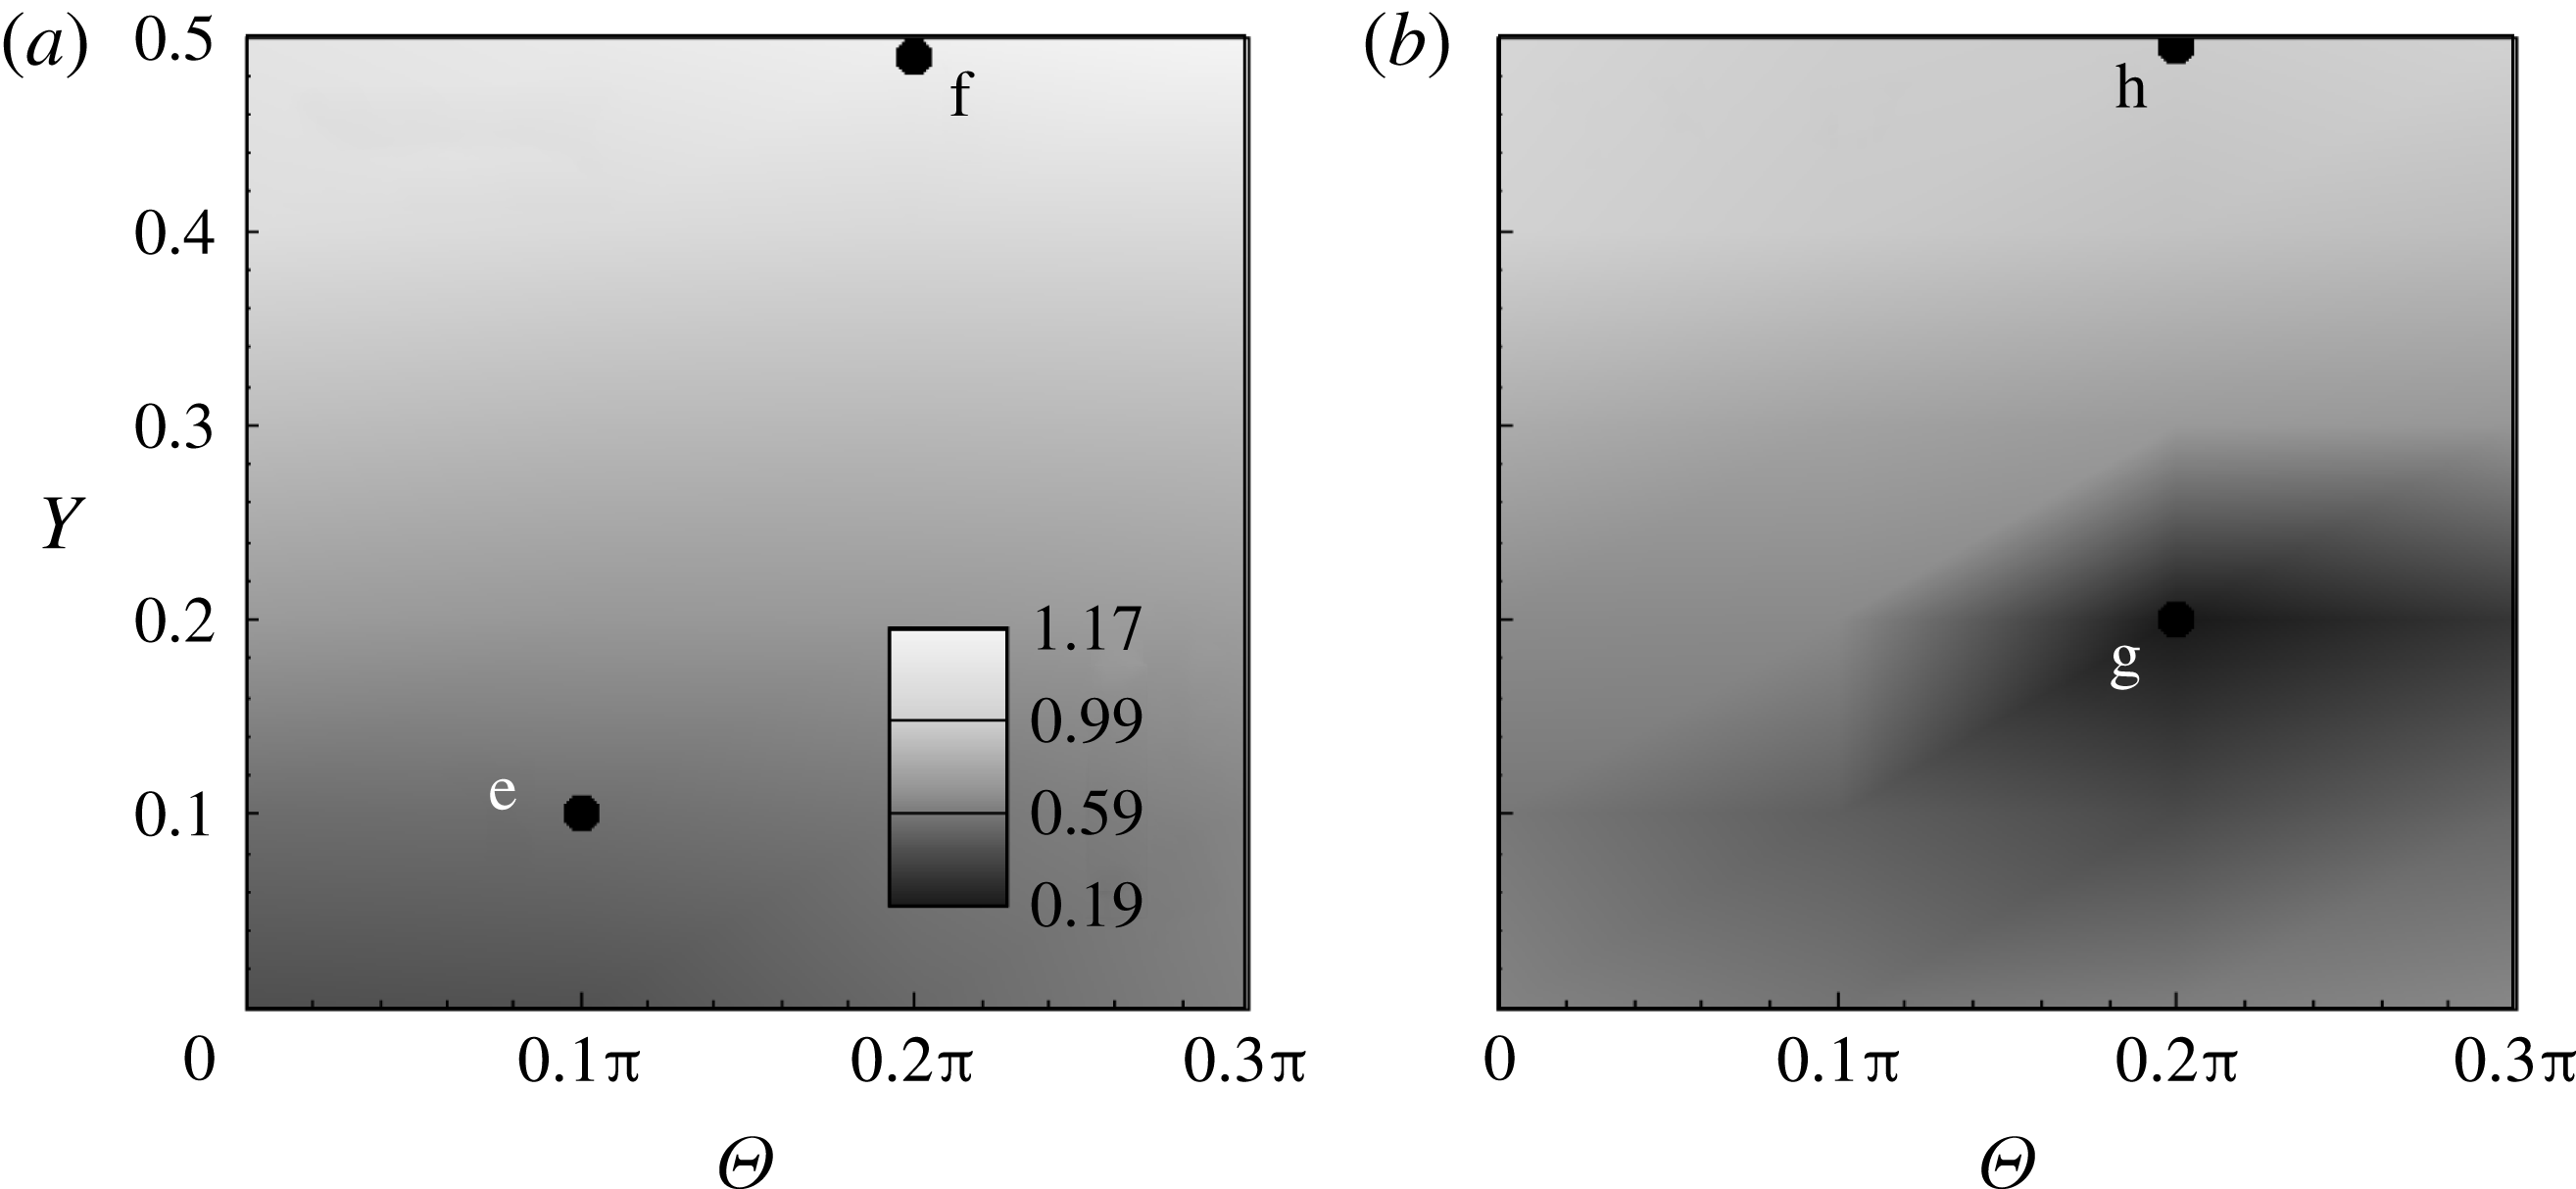
are plotted in figure 13. More than 400 points were included in each map. It is interesting to see in figure 12(a) that for the single pitching and heaving flag, the contours of
 $C_{d}$
displayed a regular pattern and reached a minimum for
 ${\it\Phi}_{pitching}-{\it\Phi}_{heaving}=0.75{\rm\pi}$
and a maximum for
 ${\it\Phi}_{pitching}-{\it\Phi}_{heaving}=-0.25{\rm\pi}$
. Thus,
 $C_{d}$
of the single pitching and heaving flag depended only on the phase difference between the pitching and heaving motions. However, the difference in
 $C_{d}$
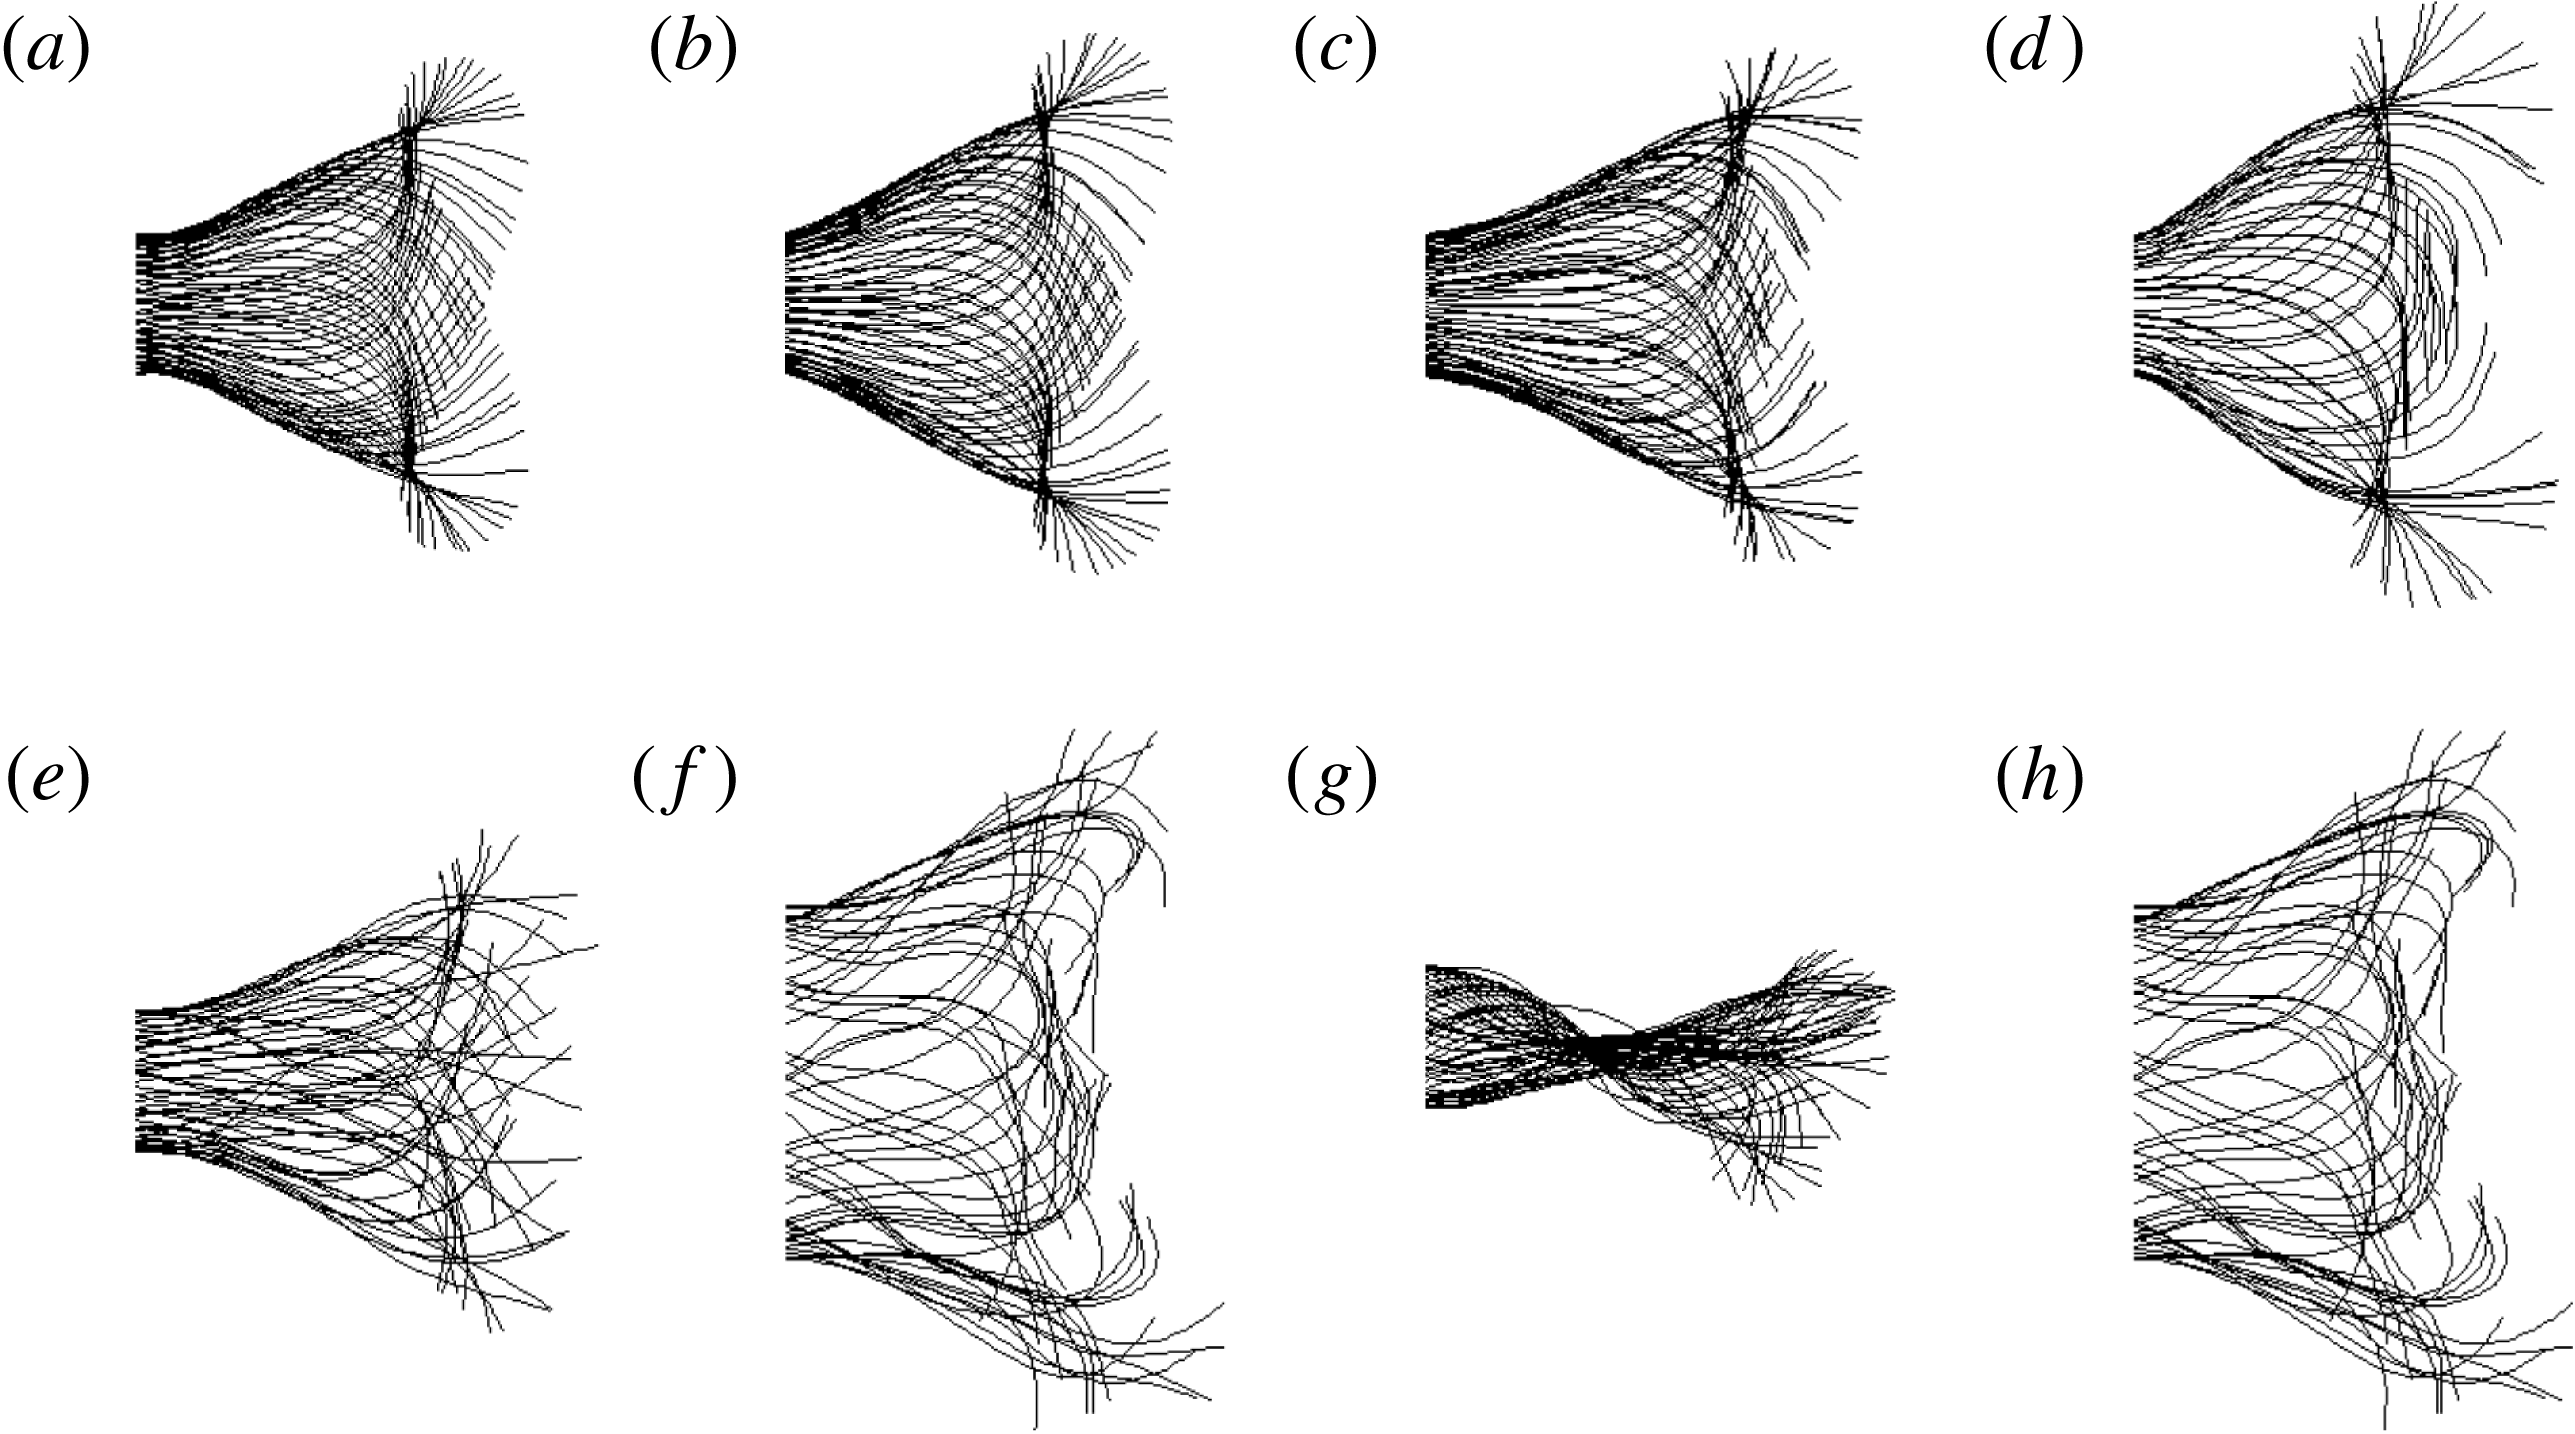
was small as shown in figure 12(a). The superimposition of the body shapes in figure 14 displayed a similar pattern for both the low- and high-drag cases as labelled by the points ‘a’ and ‘b’ in figure 12(a), respectively. The vortex pattern from the trailing edge of the single flapping flag was similar, although the body kinematics differed. For the tandem flag system (figure 12
b), the significant difference in
 $C_{d2}$
resulted from the difference in the phase angle. Although an inclined striped pattern was roughly seen,
 $C_{d2}$
was affected by
 ${\it\Phi}_{heaving}$
rather than
 ${\it\Phi}_{pitching}$
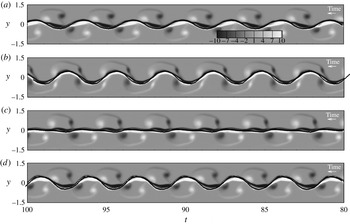
. The body shapes for the low- and high-drag cases are labelled by points ‘c’ and ‘d’ in figure 12(b) respectively. Different envelopes are displayed in figure 14 despite the same heaving amplitude. The vortex–flag interactions shown in figure 15(a) and (b) represent the slalom mode and the interception mode, respectively.
Contours of the drag coefficients of the downstream flag as a function of the phase angles of the pitching and heaving motion at
 $f_{2h}/f_{0}=1.0$
: (a)
 $G_{x}=\infty$
for the single flag; (b)
 $G_{x}=1.0$
. Other parameters were
 $Re=300$
,
 $Y=0.2$
,
 ${\it\Theta}=0.1{\rm\pi}$
,
 ${\it\gamma}=0.006$
.

Contours of the drag coefficient of the downstream flag as a function of the amplitude of the pitching and heaving motion at
 $f_{2h}/f_{0}=1.0$
: (a)
 $G_{x}=\infty$
for the single flag; (b)
 $G_{x}=1.0$
.


Time evolution of the vorticity along the vertical line in the middle point of the downstream flag, together with the trajectory of the middle point of the downstream flag. (a) Point ‘c’; (b) point ‘d’; (c) point ‘g’; (d) point ‘h’. Points ‘c’ and ‘d’ are labelled in figure 12 and points ‘g’ and ‘h’ in figure 13.

The influence of the pitching and heaving amplitudes
 ${\it\Theta}$
and
 $Y$
on
 $C_{d}$
is plotted in figure 13 for both the single (
 $G_{x}=\infty$
) and tandem (
 $G_{x}=1.0$
) cases at
 $f_{2h}/f_{0}=1.0$
. In general, the drag coefficient was more affected by the heaving amplitude. Due to the fast motion of the head of the downstream flag, the lateral displacement significantly affected the body shape and the leading edge vortices. For the single-flag system,
 $C_{d}$
increased monotonically with the heaving amplitude (figure 13
a), and the body shape was significantly affected by the heaving amplitude (see the points ‘e’ and ‘f’ in figure 14). On the other hand, for the tandem case,
 $C_{d2}$
decreased significantly within a certain region of
 $Y$
and
 ${\it\Theta}$
(figure 13
b), as did the flapping amplitude for the body shapes, i.e. the points ‘g’ and ‘h’ in figure 14. An appropriate pitching and heaving amplitude was in favour of the vortex–flag interactions for drag reduction. The body shape of point ‘g’ showed an asymmetric pattern, which can also be seen in the time history of the downstream tail motion in figure 7(c). Such an asymmetric pattern was displayed only in specific cases of phase difference and flapping amplitude. This may be induced by the vortex locking behaviour due to the same flapping frequency as the upstream vortex shedding frequency. Evolution of the vorticity in the middle of the downstream flag in figure 15(c) and (d) demonstrated that the slalom and interception modes corresponded to the low- and high-drag forces, respectively. At this frequency ratio, a single fish was expected to suppress the heaving amplitude to reduce drag, but fish swimming in the environment formed by the vortices shed from the upstream body tended to optimize its pitching and heaving amplitudes.
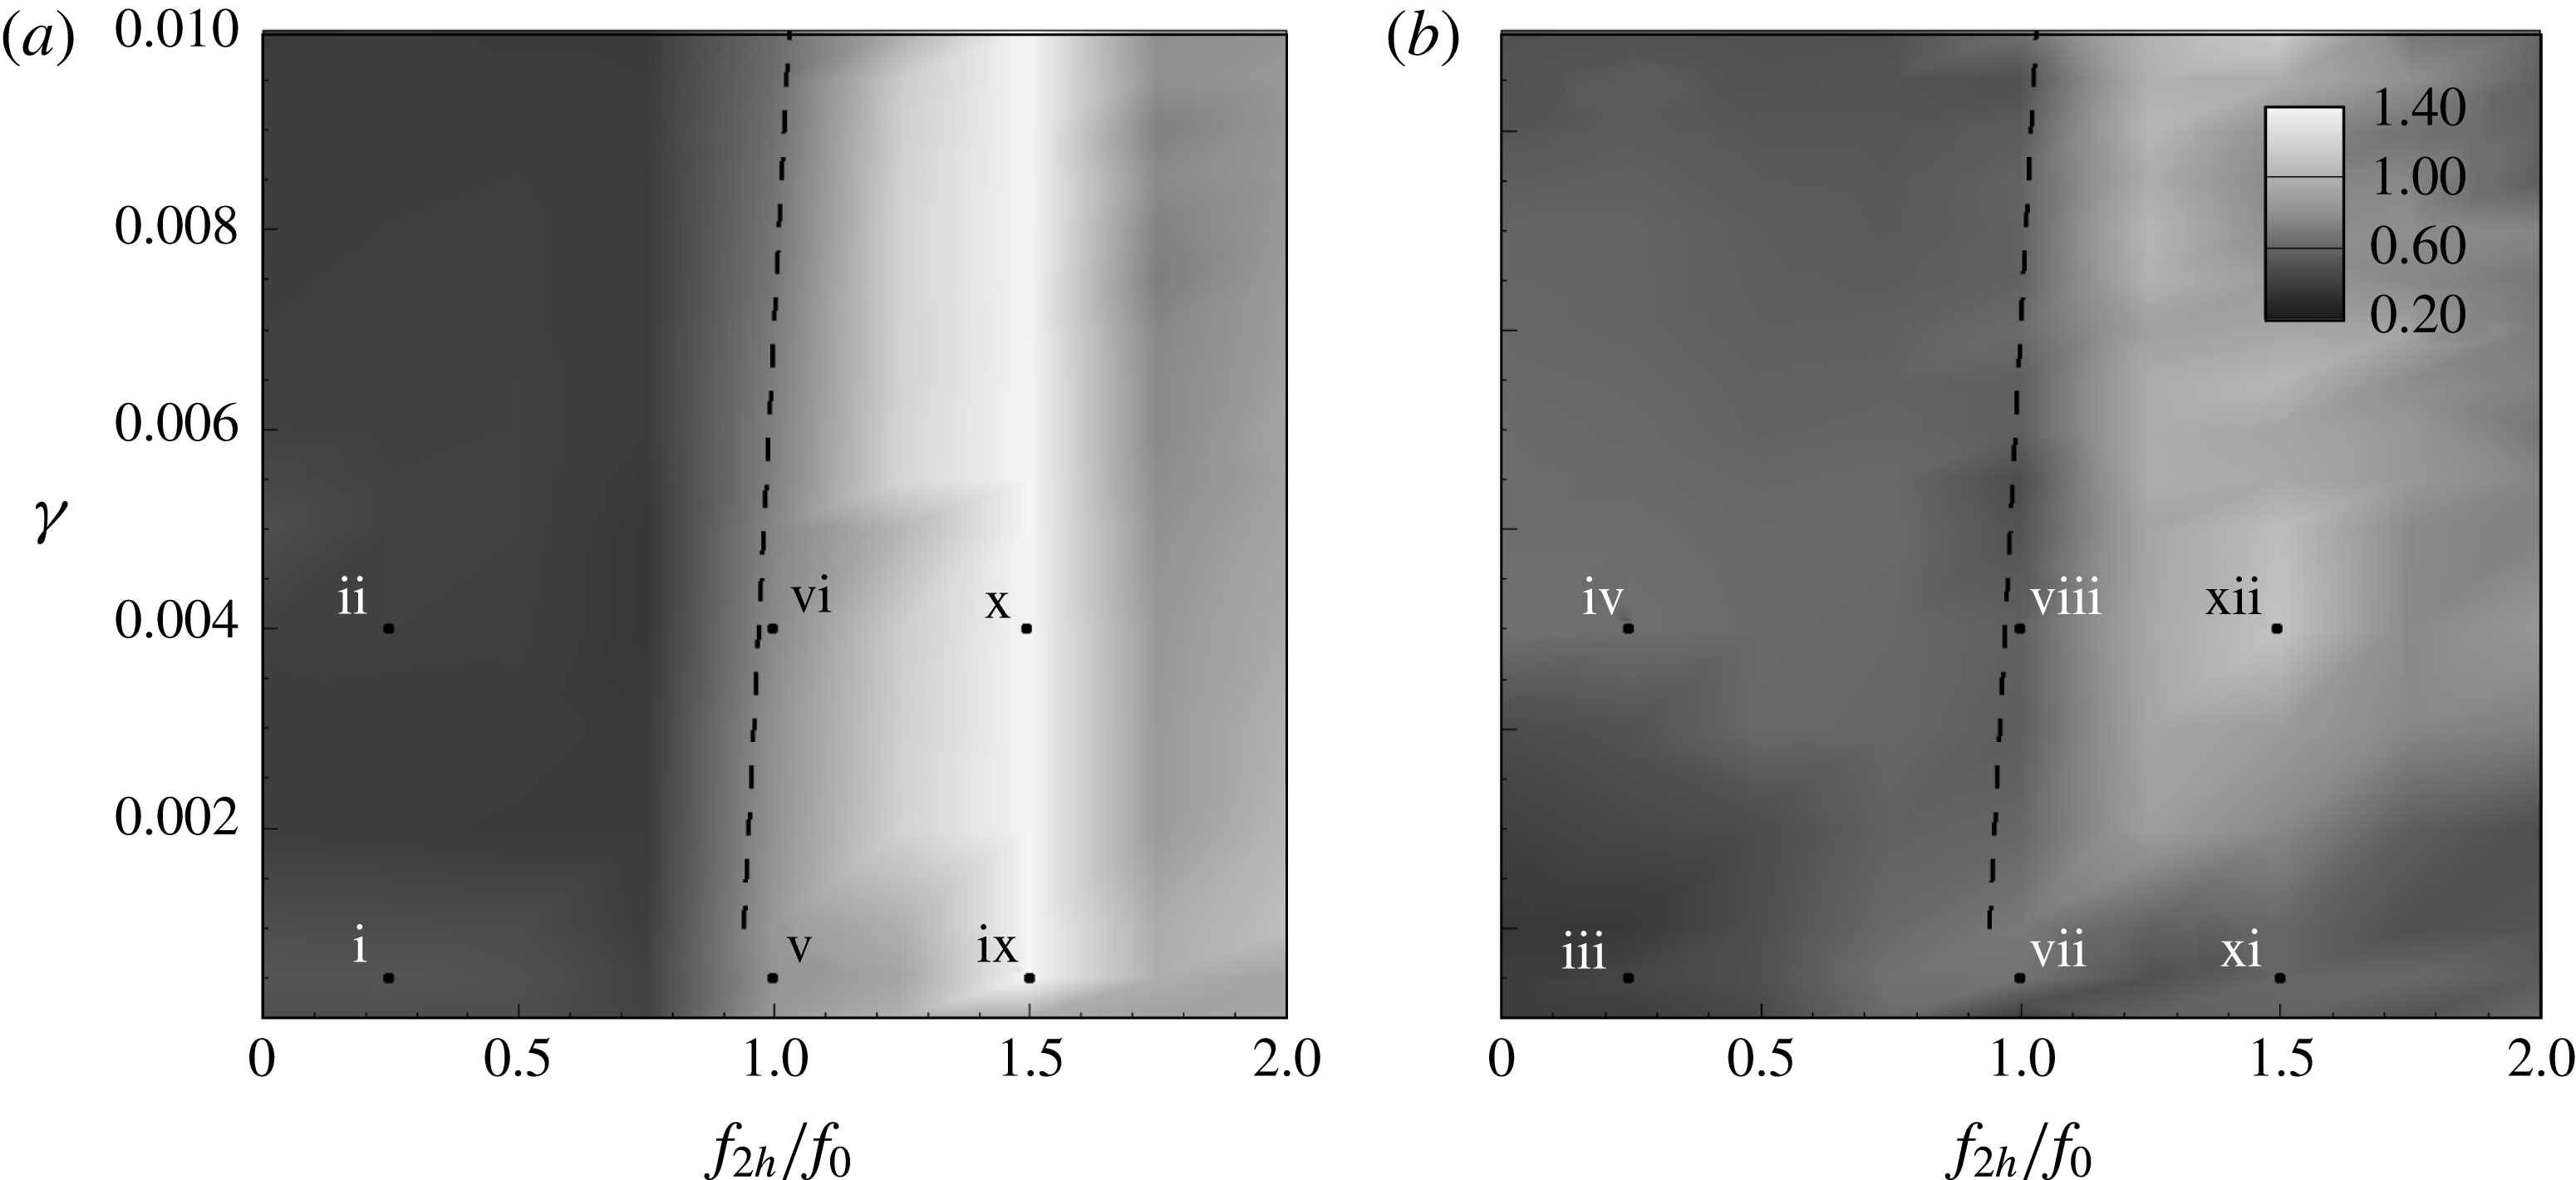
Finally, the influence of the bending coefficient on the system dynamics was explored. Figure 16 shows the contours of
 $C_{d}$
of the downstream flag and the single flapping flag as a function of the bending coefficient
 ${\it\gamma}$
and the flapping frequency
 $f_{2h}$
within the ranges
 $10^{-4}\leqslant {\it\gamma}\leqslant 10^{-2}$
and
 $0\leqslant f_{2h}/f_{0}\leqslant 2$
. Note that the natural flapping frequency
 $f_{0}$
is weakly dependent on the bending coefficient. For consistency, here we still use
 $f_{0}$
at
 ${\it\gamma}=0.006$
for the normalization of
 $f_{2h}$
. In figure 16, the inclined dashed line across
 $f_{2h}/f_{0}=1$
indicates that
 $f_{0}$
increased slightly with
 ${\it\gamma}$
. For the single pitching and heaving flag in figure 16(a),
 $C_{d}$
changed little by varying
 ${\it\gamma}$
, but it changed significantly by varying the flapping frequency, as shown in figure 2. To see this more clearly, the curves of
 $C_{d}$
as a function of
 ${\it\gamma}$
for different
 $f_{2h}/f_{0}$
are plotted in figure 17. Within the range of
 ${\it\gamma}$
considered in the present study, variations of
 $C_{d}$
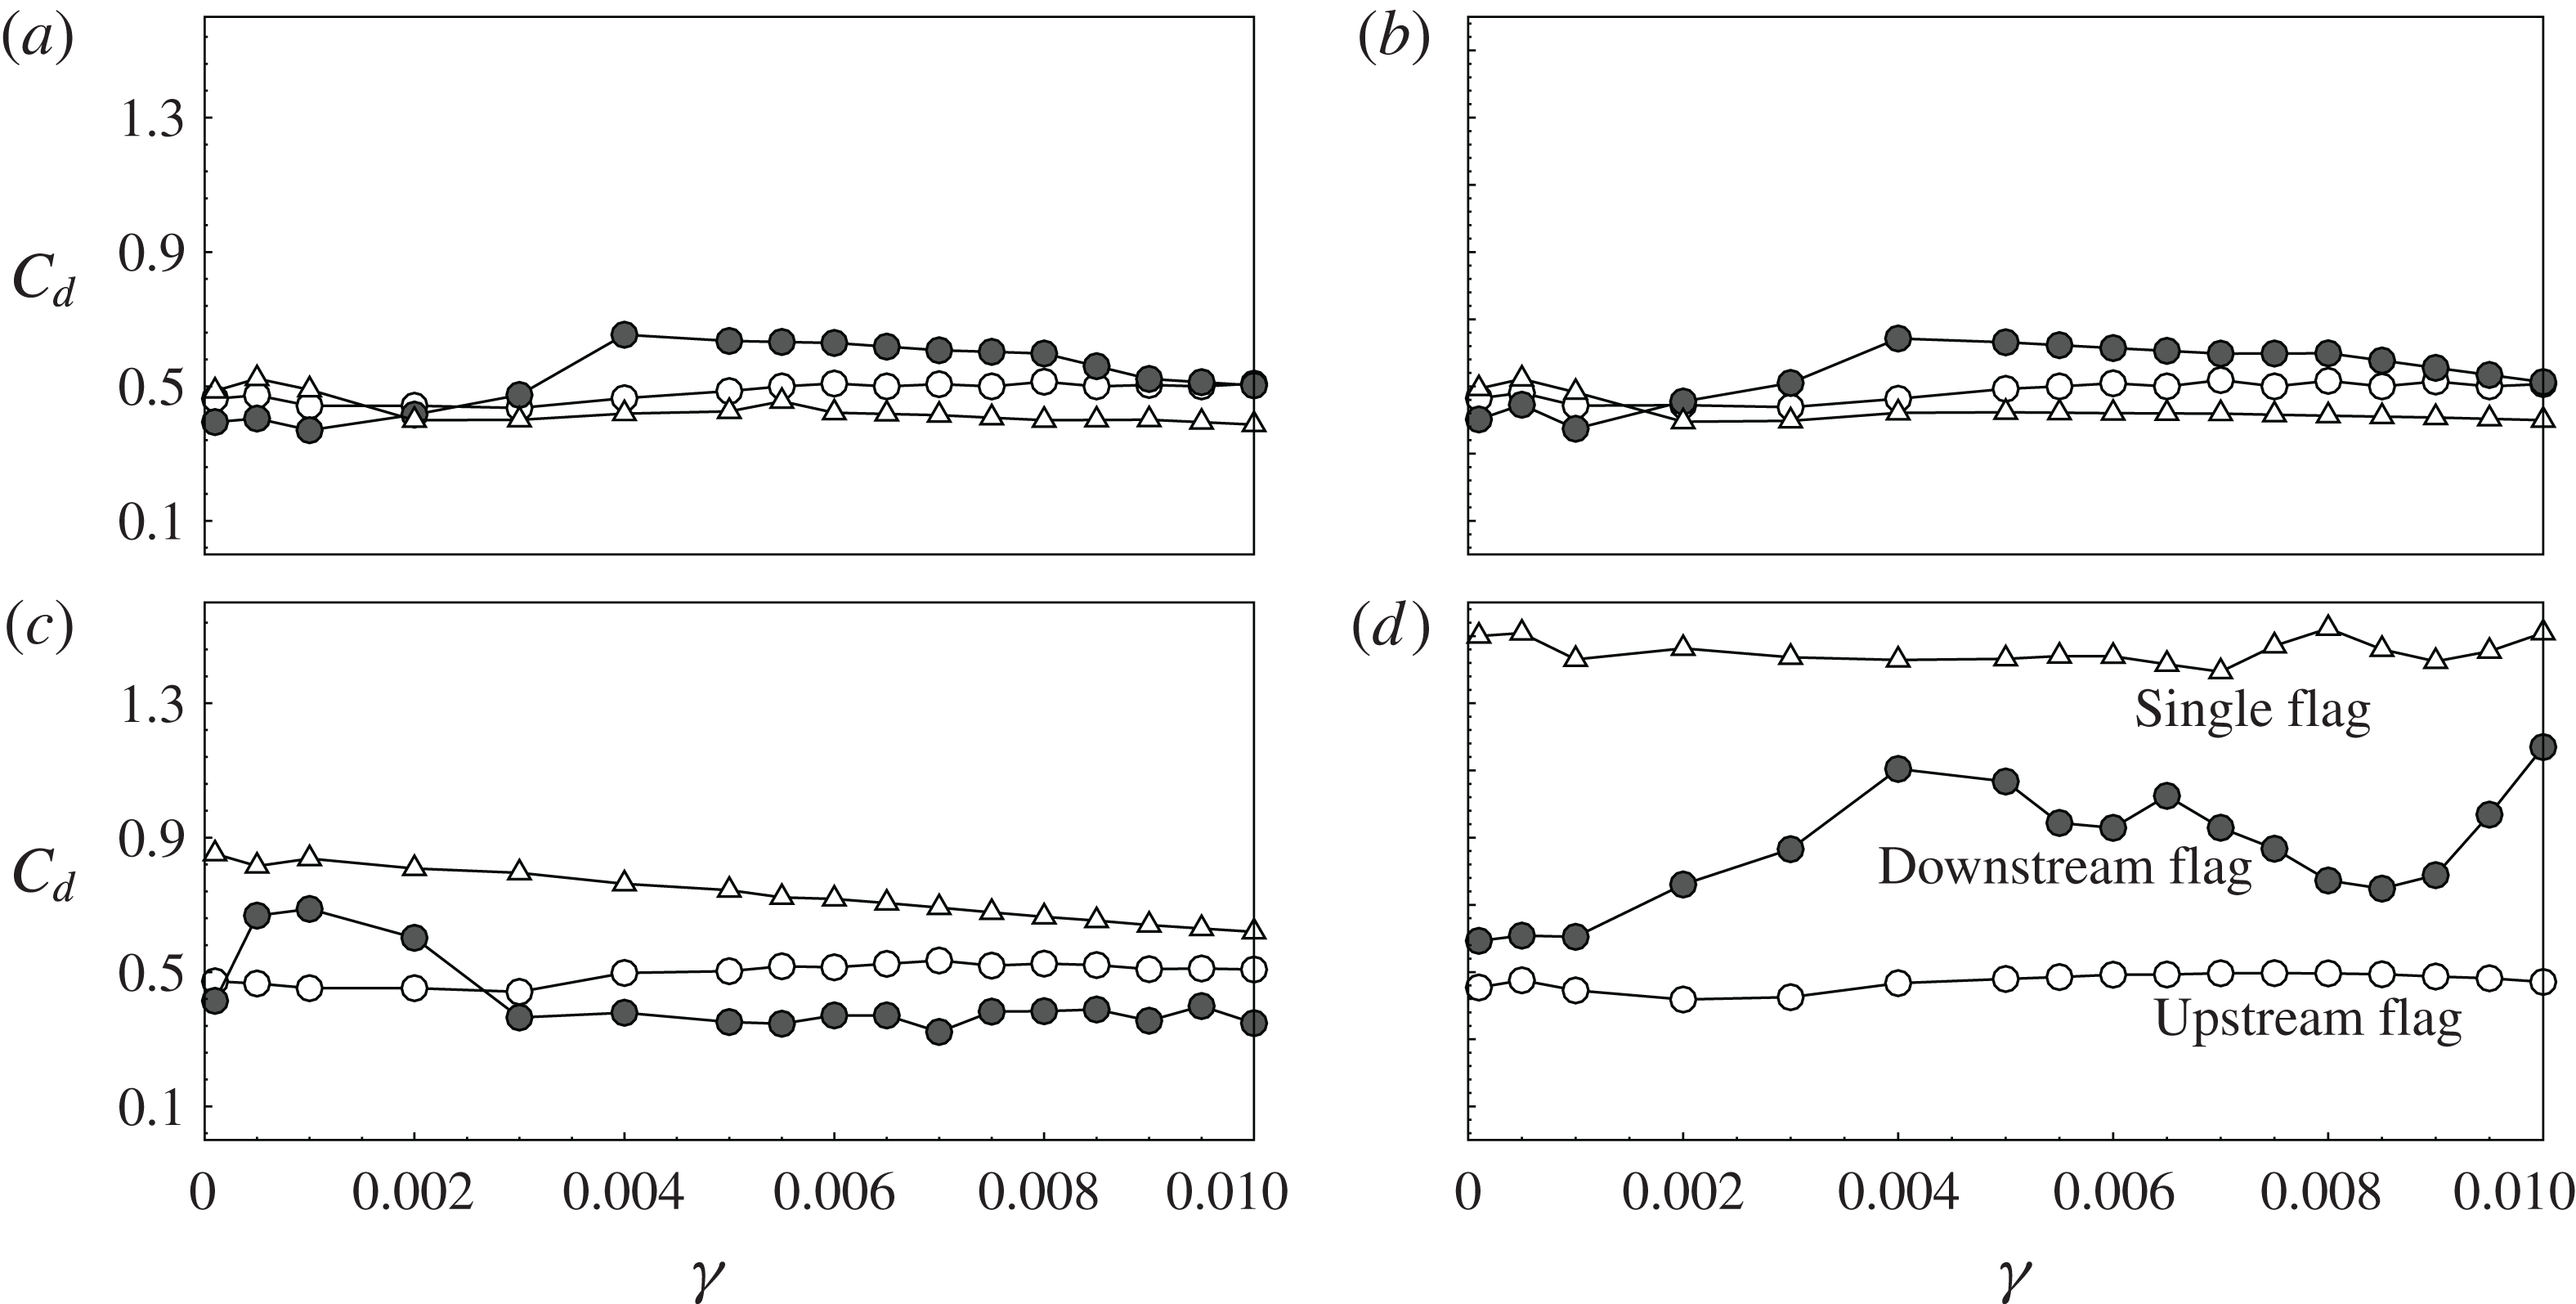
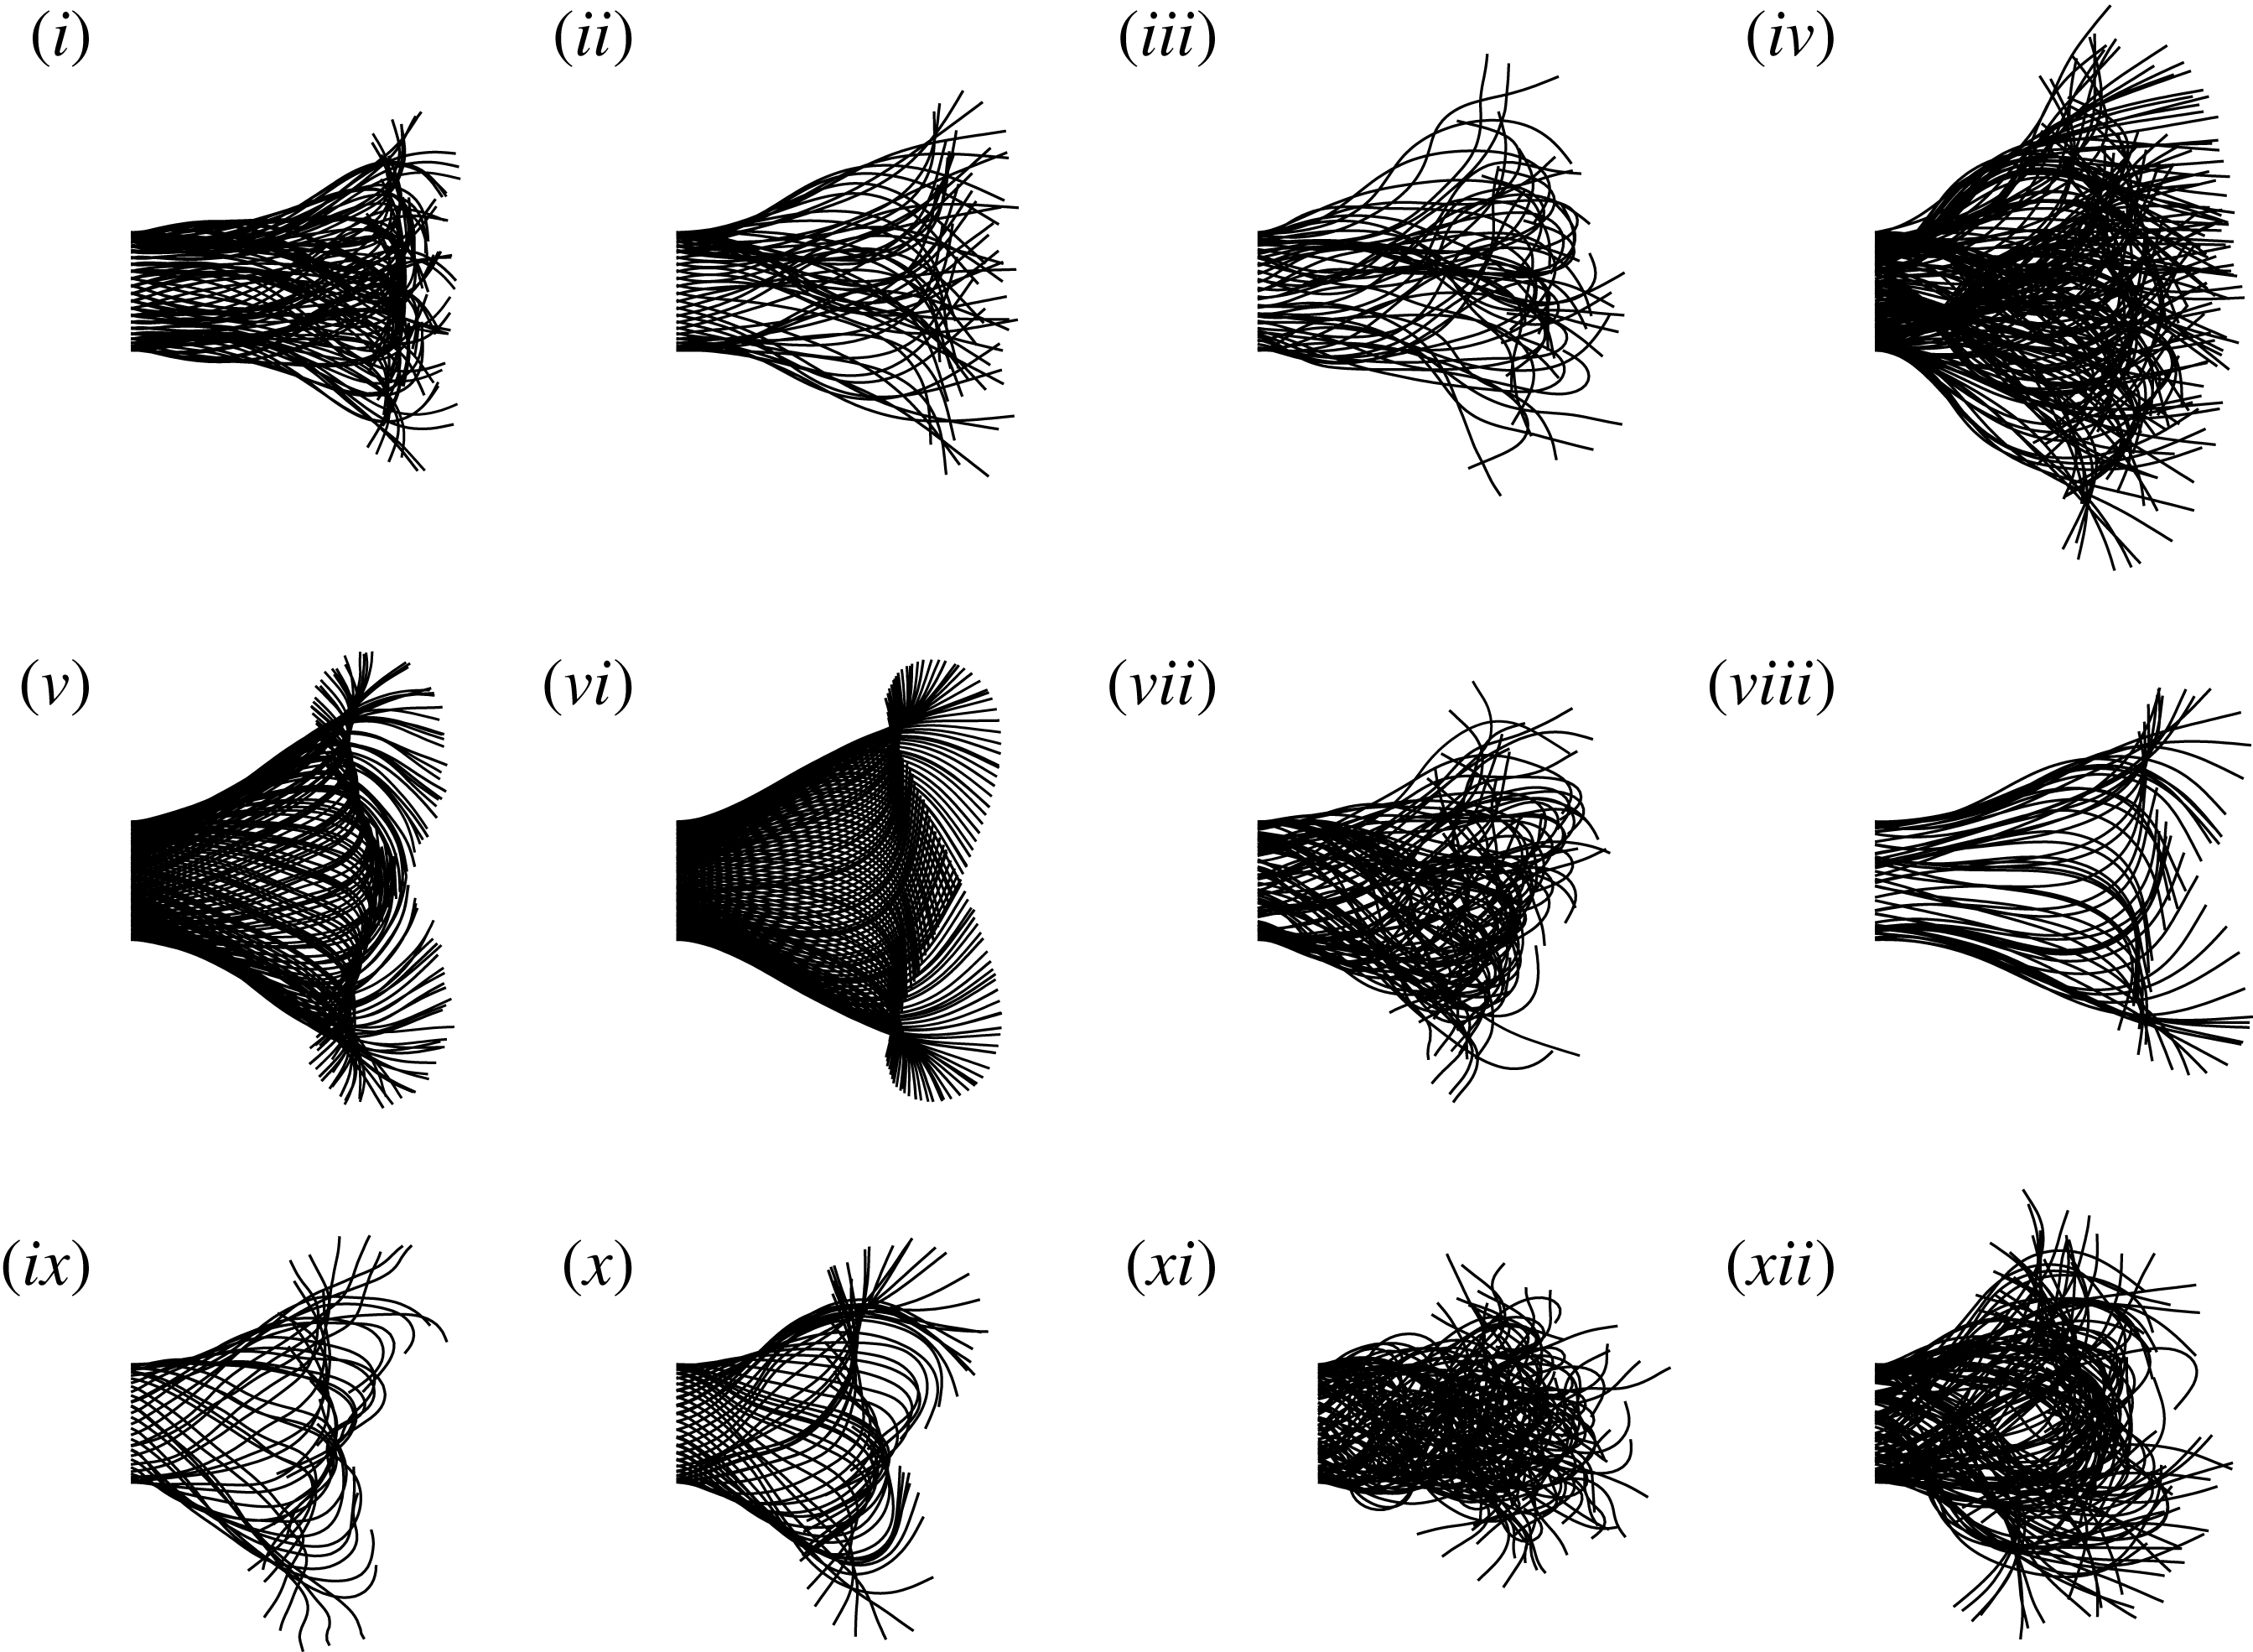
of the single flag were small for each flapping frequency. Figure 18 presents the superimposition of the body shape of the flag within a flapping period for the points labelled in figure 16. Similar patterns of the body shapes, as well as the flapping amplitudes of the tail, were observed by comparing the single-flag cases with different
 ${\it\gamma}$
, i.e. point ‘i’ versus ‘ii’, ‘v’ versus ‘vi’, and ‘ix’ versus ‘x’.
Contours of
 $C_{d}$
of the downstream flag as a function of the bending coefficient and the flapping frequency: (a)
 $G_{x}=\infty$
for the single flag; (b)
 $G_{x}=1.0$
. The dashed line denotes the location of the natural flapping frequency for
 $Re=300$
,
 $Y=0.2$
,
 ${\it\Theta}=0.1{\rm\pi}$
,
 ${\it\Phi}_{pitching}=0.5{\rm\pi}$
and
 ${\it\Phi}_{heaving}=0$
.

The drag coefficient as a function of the bending coefficient at different flapping frequencies: (a)
 $f_{2h}/f_{0}=0$
; (b)
 $f_{2h}/f_{0}=0.25$
; (c)
 $f_{2h}/f_{0}=1.0$
; (d)
 $f_{2h}/f_{0}=1.5$
. Also, (a)
 ${\it\Phi}=0.1{\rm\pi}$
,
 $Y=0.2$
; (b)
 $Re=300$
,
 $G_{x}=1.0$
; (c)
 ${\it\Phi}_{pitching}=0.5{\rm\pi}$
,
 ${\it\Phi}_{heaving}=0.0$
.

For the tandem case, the flapping motion of the downstream flag became more complicated due to the influence of the upstream shedding vortices. As seen in figure 16(b),
 $C_{d2}$
remained almost unchanged with
 ${\it\gamma}$
in a wide range, i.e.
 $2\times 10^{-3}\leqslant {\it\gamma}\leqslant 10^{-2}$
. The variation of
 $C_{d2}$
with the frequency ratio within this range was examined in detail. However, different behaviours were observed for the downstream flag with a small bending coefficient. We can see that
 $C_{d2}$
changed little for
 ${\it\gamma}\leqslant 2\times 10^{-3}$
and all frequency ratios except near
 $f_{2h}/f_{0}=1$
. For
 $f_{2h}/f_{0}<1$
,
 $C_{d2}$
was comparable to
 $C_{d1}$
for
 ${\it\gamma}\leqslant 2\times 10^{-3}$
and was slightly increased for
 $2\times 10^{-3}\leqslant {\it\gamma}\leqslant 10^{-2}$
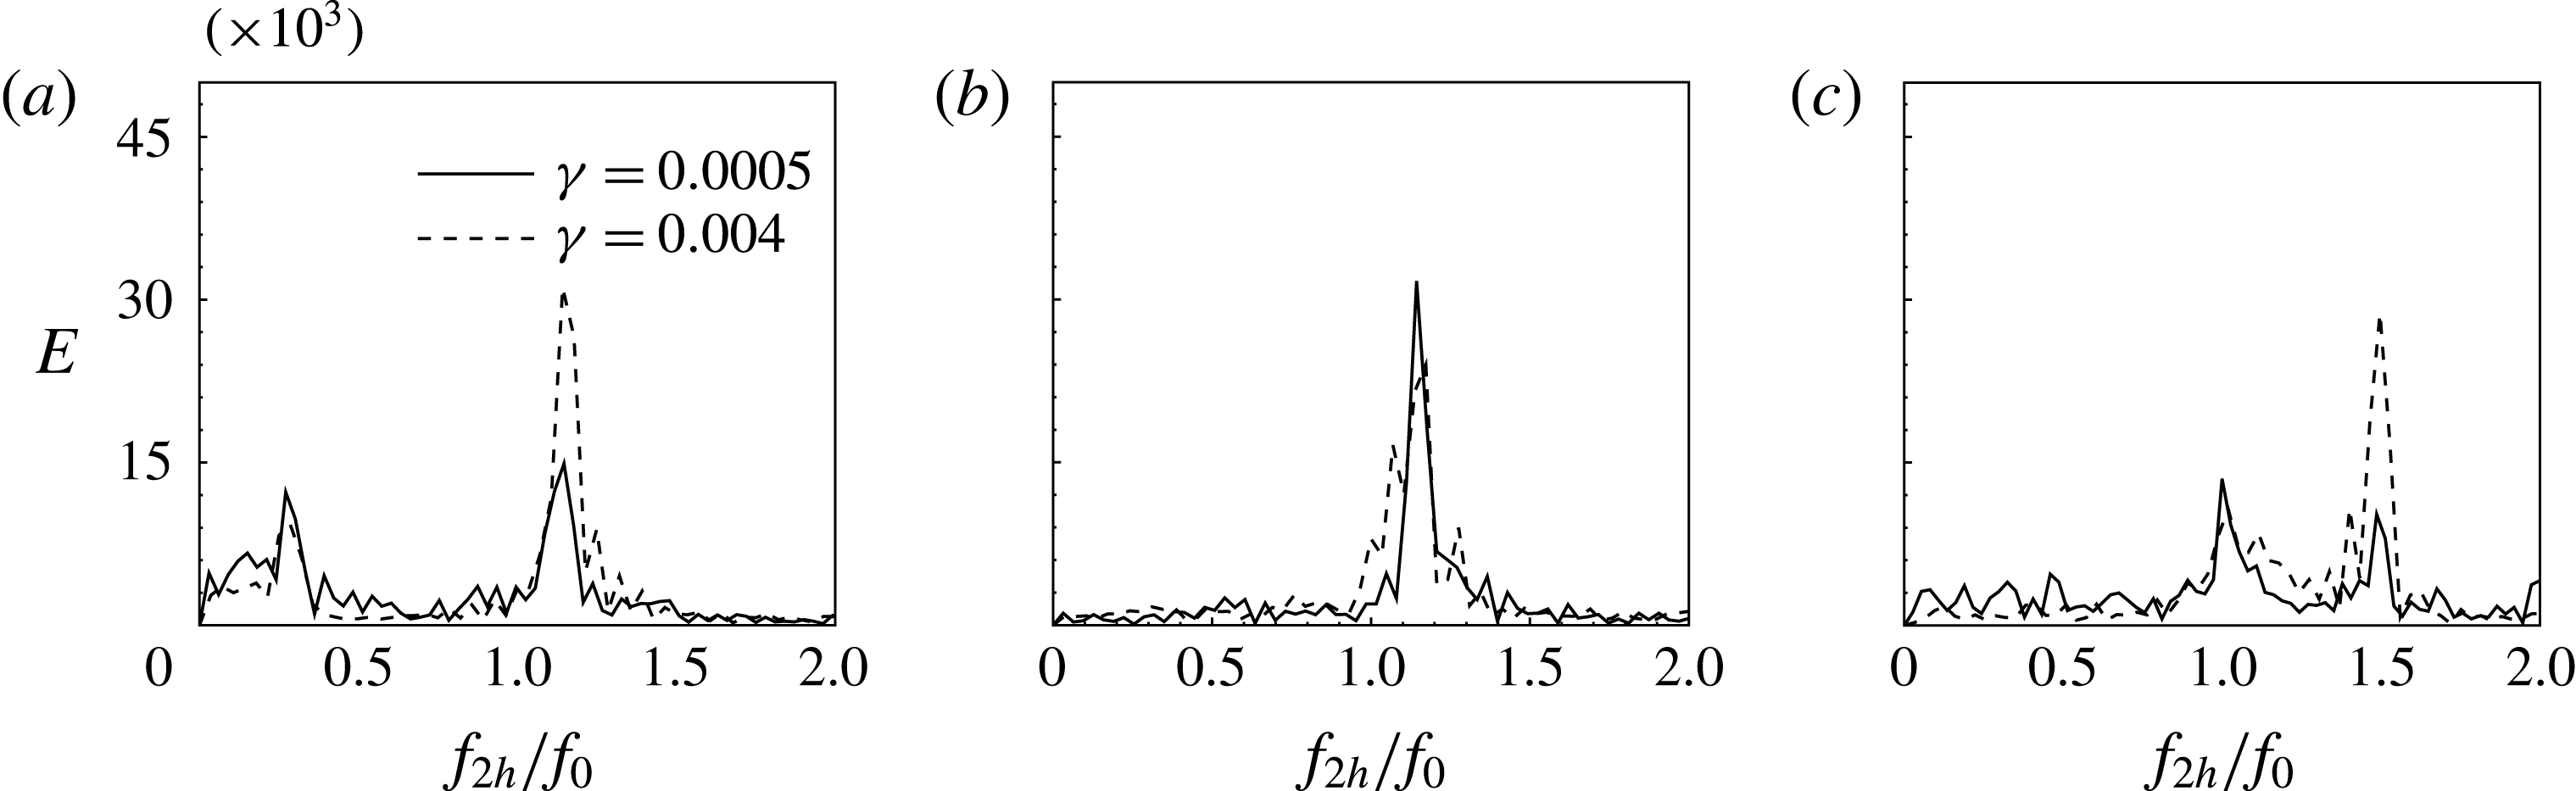
according to figures 17(a) and (b). The body shape of point ‘iv’ labelled in figure 16(b) displayed a slightly more expanded envelope than that of point ‘iii’, as seen in figure 18. Figure 19 shows the power spectra of the tail position of the downstream flag for the points labelled in figure 16. For point ‘iii’, the spectrum peak at the natural flapping frequency was comparable to that at the pitching and heaving frequency. However, the peak at the natural flapping frequency was dominant for point ‘iv’. As discussed above, the modulation of the upstream shedding vortices was obvious when
 $f_{2h}/f_{0}<1$
. The difference in the spectra between points ‘iii’ and ‘iv’ indicates that the modulation effect was suppressed by the body deformation with a very low bending rigidity flapping at a low frequency. On the other hand, for
 $f_{2h}/f_{0}>1$
,
 $C_{d2}$
was also comparable to
 $C_{d1}$
for
 ${\it\gamma}\leqslant 2\times 10^{-3}$
. However, a significant increase in
 $C_{d2}$
was observed for larger
 ${\it\gamma}$
in figure 17(d). As mentioned earlier, a high flapping frequency usually resulted in the interception mode. Exceptions were observed for
 ${\it\gamma}\leqslant 2\times 10^{-3}$
, where
 $C_{d2}$
remained low even for
 $f_{2h}/f_{0}>1$
. In figure 18, the body shape of point ‘xi’ labelled in figure 16(b) showed significant difference from that of point ‘xii’, implying the influence of the upstream shedding vortices. As seen in figure 19(c), the spectrum of point ‘xi’ showed that the spectrum peak at the natural frequency was comparable to that at the flapping frequency. Unlike the spectrum of point ‘xii’, where the peak at the flapping frequency was dominant, we found a clear feature of the interception mode. For
 $f_{2h}/f_{0}=1$
, an increase in
 $C_{d2}$
was observed for
 ${\it\gamma}\leqslant 2\times 10^{-3}$
, and a decrease elsewhere (figure 17
c). The decrease in
 $C_{d2}$
was caused by the slalom mode due to the interaction with upcoming vortices. For very flexible flags at
 $f_{2h}/f_{0}=1$
, although the superimpositions of the body shapes and the power spectrum were found to be similar to those of more rigid flags by comparing points ‘vii’ and ‘viii’ in figures 18 and 19(c), the plots of vorticity evolution show that the interception mode was formed for the low bending case and the slalom mode for the more rigid flag, as seen in figure 20.
Superimposition of the body shapes of the downstream flag. The numbering is sequentially labelled in figure 16.

Power spectra of the tail positions for different points labelled in figure 16: (a) iii and iv; (b) vii and viii; (c) xi and xii. Also, (a)
 $f_{2h}/f_{0}=0.25$
; (b)
 $f_{2h}/f_{0}=1.0$
,
 ${\it\Phi}_{pitching}=0.5{\rm\pi}$
,
 ${\it\Phi}_{heaving}=0$
; (c)
 $f_{2h}/f_{0}=1.5$
,
 $Re=300$
,
 ${\it\Phi}=0.1{\rm\pi}$
,
 $G_{x}=1.0$
,
 $Y=0.2$
.

Time evolution of the vorticity along the vertical line at the head of the downstream flag, together with the trajectory of the middle point of the downstream flag. (a) Point ‘vii’; (b) point ‘viii’. Points ‘vii’ and ‘viii’ are labelled in figure 16.

4. Conclusions
The present study examined the dynamics of tandem flexible flags in a viscous flow under prescribed active pitching and heaving motions applied to the head of the downstream flag. The effects of various parameters on the dynamics were explored, including the flapping frequency, the gap distance, the pitching and heaving phase angles and amplitudes, and the bending coefficient. Special attention has been paid to the underlying mechanism related to the status of the downstream flag motion, and some interesting features of the dynamic system were explored:
-
(1) When the enforced flapping frequency was less than the natural flapping frequency, the modulation of the upstream shedding vortices with the downstream flag motion was observed, and the drag of the downstream flag was only slightly dependent on the gap distance between the two flags. The phase difference between the tail motions of the upstream and downstream flags increased linearly with the gap distance, since the propagation time for the vortices arriving at the downstream flag was proportional to the gap distance. The power spectrum of the tail position of the downstream flag indicated that the natural frequency was dominant due to the modulation effect.
-
(2) When the enforced flapping frequency was equal to the natural flapping frequency, besides the constructive mode of the passive flapping case, different modes, i.e. the slalom mode and the interception mode, were identified by varying the gap distance. The drag was reduced for the slalom mode but was increased for the interception mode. A simplified physical model was provided to explain the intrinsic mechanism, and comparison with previous studies was discussed.
-
(3) When the enforced flapping frequency was larger than the natural flapping frequency the interception mode was generally observed. The drag of the downstream flag was significantly increased as compared with the upstream one. The power spectra of the tail position of the downstream flag showed that the enforced frequency was dominant over the natural flapping frequency. From the energetic point of view, the head motion of the downstream flag with a frequency higher than the upstream shedding vortices was not usually observed for a stably swimming fish under the influence of the vortical wake.
-
(4) At specific flapping frequencies and gap distances, the pitching and heaving phase angles and amplitudes were examined systematically. For the single pitching and heaving flag, the drag showed a regular pattern with the pitching and heaving phase angles, depending only upon the phase difference. The drag was increased with the heaving amplitude but insensitive to the pitching amplitude. For the tandem flag system, the heaving phase had a more significant influence on the drag of the downstream flag than the pitching phase, by adjusting the relative position of the head and the oncoming vortices. The drag was minimized over a certain range of the pitching and heaving amplitudes, suggesting that the fish might adjust its head motion to adapt to the oncoming vortical wake so as to minimize its drag.
-
(5) Within a certain range of the bending coefficient considered in the present study, the drag of the downstream flag was found to be almost independent of the bending coefficient, but to vary significantly with the flapping frequency. However, for very low bending rigidities, different behaviours were found for the downstream flag. The power spectra of the tail positions showed that the peak at the natural frequency was comparable with that at the enforced flapping frequency. The modulation effect was diminished due to the too flexible body at low flapping frequencies, while the flapping elastic energy was small at high flapping frequencies, as compared with the more rigid cases. As a result, by bearing a small bending rigidity, the drag of the downstream flag always remained low and comparable with the upstream one. An exception was observed near the frequency ratio equal to one, where the interception mode was formed and the drag was increased for low bending rigidities, which is opposite to the slalom mode for the more rigid cases.
Acknowledgements
This work was supported by the Creative Research Initiatives (no. 2015-01828) programme of the National Research Foundation of Korea (MSIP). W.-X.H. acknowledges the support from the NSFC (no. 11322221).
Supplementary movies
Supplementary movies are available at http://dx.doi.org/10.1017/jfm.2015.460.