

DISCUSSION POINTS
• The problem of rising atmospheric carbon dioxide is so large that there is nothing we can do about it.
• The problem is enormous, but economic forces would prevent us from doing anything.
• The problem might be solvable if China and the USA would jointly adopt a Manhattan-like project approach.
Introduction
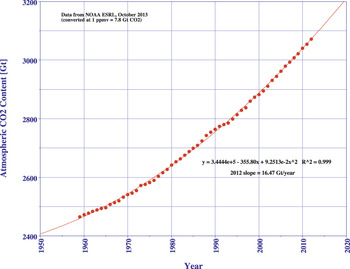
The increasing interest in renewable energy that has manifested itself on a worldwide scale in recent years has come about due to four factors: (i) Concerns about securing continued supplies of energy for those countries that have hitherto depended heavily on imported fossil fuel; (ii) Concerns that fossil fuel requirements will continue to rise worldwide; (iii) Concerns about dwindling fossil fuel resources; (iv) Concerns about the environmental impact of the increasing use of fossil fuels, a concern that has been exacerbated by the recent development and exploitation of methodsReference Fjaer, Holt, Horsrud, Raaen and Risnes1 for extracting large amounts of natural gas that were hitherto deemed inaccessible. Among these concerns, the fourth has been the most amenable to scientific investigation. To appreciate the various scales that are involved, Fig. 1 plots atmospheric CO2 content, measured since 1959,2 as a function of time. For purposes of the present discussion, the National Oceanic and Atmospheric Administration (NOAA) concentration data, in parts per million volume, have been converted to gigatonne under the assumption that 1 ppmv of CO2 in the earth's atmosphere has a mass of 7.8 Gt.Reference Houghton, Jenkins and Ephraums3
Atmospheric carbon dioxide content versus time. Data from Ref. 2, converted assuming 1 ppmv = 7.8 Gt.

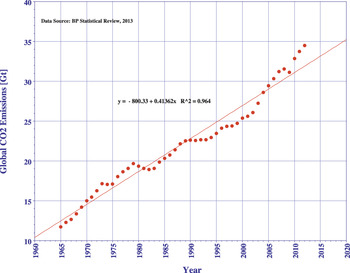
From Fig. 1, it may be seen that the amount of CO2 in the atmosphere has been rising at a steadily increasing rate since measurements were first taken, and that it is currently rising at a rate that exceeds 16 Gt per year. On the other hand, annual CO2 emissions from fossil fuels are currently approaching 35 Gt per year, as can be seen in Fig. 2.
Annual carbon dioxide emissions since 1965. Data from Ref. 4.

Concerns that there may be a causal link between the rising emissions from fossil fuel consumption and the increasing concentration of atmospheric CO2 led to the establishment of an Intergovernmental Panel on Climate Change,Reference Houghton, Jenkins and Ephraums3Footnote * the recommendations of which, in turn, led to the adoption by many countries of long-term goals for the reduction of carbon dioxide emissions. Efforts to reduce CO2 emissions have focused, inter alia, upon support for the development and implementation of power-generating technologies based on renewable energy sources with low carbon footprint.
Hydropower is of course the classical renewable energy technology for those regions of the world with sufficient water and appropriate topography. Nuclear power also has a low carbon footprint. However, increasing fears about other potential forms of damage to the environment, particularly following the Chernobyl and Fukushima disasters, have led to a slowdown in the construction of nuclear power plants in recent years.
Among the less fear-provoking renewable energy technologies currently under investigation, two stand out for their increasing technological maturity and decreasing cost: wind and solar photovoltaic (PV) power. For many situations, solar thermal power is also an effective substitute for fossil-generated heat. However, for reasons having to do with the variety and relative complexity of such systems, it is more difficult to make generalizations about their potential widespread deployment. Solar-thermal power will accordingly not be discussed in detail in the present paper. Nevertheless, the arguments that will be presented for the feasibility of introducing wind and PV power on a hitherto unprecedented scale should also apply to potential solar-thermal contributions if the appropriate technical and cost considerations are taken into account.
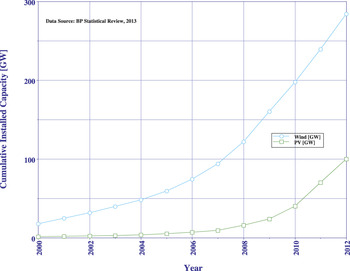
Cost considerations are naturally the principal factor that has impeded the utilization of renewable energy resources on a larger scale than is the case at present. However, costs have fallen substantially during the past two decades, driven down by increasing demand, which in turn has been spurred by various forms of government support. Historically, wind turbine technology achieved relatively low $/W plant costs before that of solar energy. As a result, there is currently far more installed capacity of wind than solar. Specifically, by the end of 2012, the amount of wind capacity that had been installed worldwide was approximately three times that of PV.4Figure 3 shows the growth of these two technologies since the year 2000.
Cumulative installed capacity of wind and solar PV since 2000. Data from Ref. 4.

Figure 3 indicates a remarkable acceleration with time of the rates at which both of these technology types have been introduced in recent years. In 2012 alone, 45 GW of additional wind and 30 GW of new PVFootnote † went on line worldwide.4 However, an important question that this paper addresses is whether this growth is fast enough to effect any significant reduction in CO2 emissions.
The “Global-scale magnitudes of fossil-fuel usage” section presents an overview of present trends in the world's use of fossil fuels and renewable energy sources, and emphasizes that not only is the overall usage of fossil fuels increasing, but also is electricity production from these energy sources. This finding is shown to hold, not only for world data when taken as a whole, but also for the energy consumption of each of the continental regions defined in Ref. 4. Section “A wind and/or solar alternative: Scale and technical feasibility” estimates the scale of renewable energy plant implementation that would be needed to offset the growth rate of new fossil-fueled electricity generation (FFEG) plants in each region and discusses the technical feasibility of constructing PV and wind plants at such scales. The required scales are found to be considerably larger than the current rates of implementation, but construction on such scales is deemed to be technically feasible. Section “The cost of renewable electricity” estimates the corresponding costs of such a program and voices concern that financing might not be available on such scales if conventional funding methods were to be called upon. This section examines a number of alternative ways in which the necessary capital might be raised. Section “Discussion” discusses the results and the last section presents the conclusions of this study.
Global-scale magnitudes of fossil-fuel usage
The world
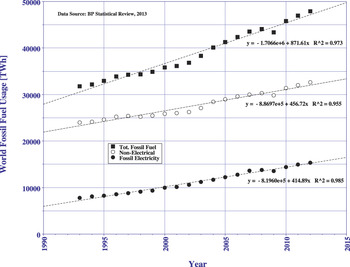
To assess the present and potential impact of solar and wind generation, it is important to be aware of the position held by electricity production relative to overall fossil fuel consumption. To this end, Fig. 4 shows the trends4 in world consumption of fossil fuels for electrical and nonelectrical purposes over the past twenty years.

From Fig. 4 it may be seen that electricity generation presently accounts for approximately 32% of the world's total fossil fuel consumption. Combining this fact with the 35 Gt total CO2 emission from fossil fuels means that in 2012, approximately 11 Gt of CO2 were emitted only by FFEG, which is comparable to but less than that year's increase in atmospheric CO2 content. Figure 4 also shows that FFEG is rising both in absolute terms and as a percentage of total fossil fuel usage – in spite of attempts to increase the implementation of renewable energy technologies. Therefore, the two most urgent questions are: At what rate are renewable energy technologies being implemented at the present time; and how does this rate compare with what would be necessary to effect a reduction in CO2 emissions comparable to the present rate of atmospheric CO2 increase?
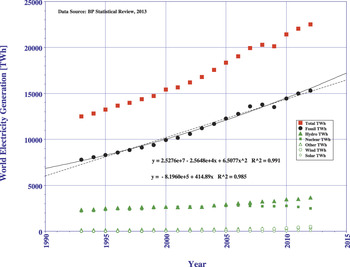
To answer these questions,Fig. 5 shows the trend in world electricity production, broken down according to its various energy sources.4
Recent trends in world electricity production by various energy sources. Data from Ref. 4.

Figure 5 reveals a number of important facts: First, that in 2012, close to 70% of the world's electricity was generated from fossil fuels, and that for the past 20 years, FFEG has been rising at an average rate of 415 TWh per year (dotted line). This is the order of magnitude that solar and wind would need to achieve to offer an alternative to the continued construction of new FFEG plants; Second, that of all the electricity-generating technologies with low carbon footprint, by far the most significant are hydropower and nuclear energy; Third, that down at an almost imperceptible level come wind, solar, and what Ref. 4 refers to as “other” (i.e., geothermal, etc.). In this sense, impressive as the trend in Fig. 3 most certainly is, it is negligible compared to the scale that would be necessary to replace FFEG, and far too small even to level off the present increasing trend in FFEG construction. Figure 5 also shows a quadratic least-squares fit (bold curve) to the FFEG data. The slope of that curve for the year 2012 is 539 TWh y−1. The possible significance of this number compared with the 415 TWh y−1 slope of the linear fit will be emphasized in the section “A wind and/or solar alternative: Scale and technical feasibility”.
Of course, the preceding global picture should more realistically be broken down into a country-by-country discussion. This is because many of the developed countries have already taken steps to reduce their CO2 emissions, while others, being still in the development stage of their economies, may understandably have higher priorities. However, not to make the present discussion inordinately long, it will here be limited to the “continental” level, i.e., the paper will be organized according to the collective regions defined in Ref. 4. Nevertheless, the simple numerical estimates used here can equally well be applied to obtain the scales relevant for each individual country.
North America
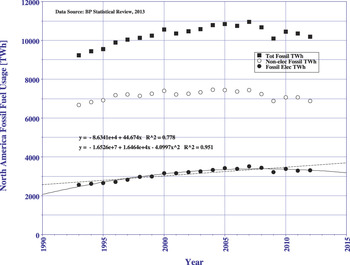
Figure 6 shows the FFEG of North America during the past 20 years, within the context of overall fossil fuel consumption in that continent.4
The past twenty years of North America's fossil fuel consumption.4

It indicates that FFEG in North America has been rising at an average rate of 44.7 TWh per year during the past 20 years (broken line) and that electricity presently represents approximately 32% of all fossil fuel usage in this region. There is some indication that fossil fuel consumption has perhaps started to decline during the past 5 years. In particular, the quadratic least-squares curve (bold curve) yields a significantly better fit to the electricity data (R 2 = 0.951) than does the linear fit (R 2 = 0.778), with a negative slope of − 33 TWh y−1 (i.e., a decrease) for the year 2012. However, the extent to which this may be partially the effect of serious attempts to reduce emissions, but also a reflection of the recent economic state of the world, is not yet clear.
South and Central America
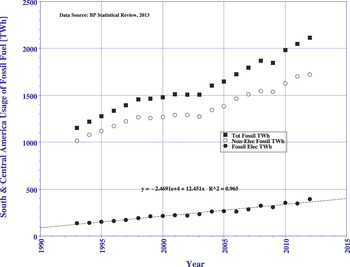
Figure 7 shows the FFEG of South and Central America during the past 20 years, within the context of that region's overall fossil fuel consumption.4
The past twenty years of South and Central America's fossil fuel consumption.4

It shows a linearly rising trend in FFEG, at an approximate rate of 12.5 TWh y−1, and that electricity presently constitutes approximately 19% of the total use of fossil fuel in the region. This rate of increase is likely to be somewhat lower than reality, because Ref. 4 does not make a clear distinction between the use of biofuel for electricity production and for transportation: both being bunched together with solar, wind, and geothermal, under the label “other renewable sources”. Since Brazil is famous for its use of bioethanol as a transportation fuel, the FFEG slope calculated in Fig. 7 might be an underestimate. Alternatively, were one to treat “other renewable sources” as contributing to a reduction in the nonelectrical uses of fossil fuels (rather than to a reduction in FFEG, as is done consistently throughout this study) the trend in FFEG for South and Central America would have a slope of 14.8 TWh y−1. Therefore, the truth probably falls somewhere between these two figures.
Europe and Eurasia
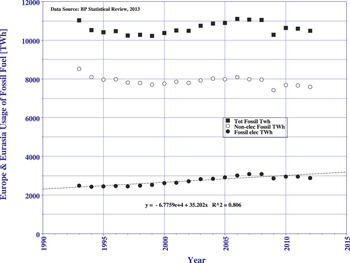
Figure 8 shows the FFEG of Europe and Eurasia during the past 20 years, within the context of their overall fossil fuel consumption.4
The past twenty years of Europe and Eurasia's fossil fuel consumption.4

It indicates that fossil-fueled electricity in Europe and Eurasia has been rising at an average rate of 35.2 TWh per year during the past 20 years and that electricity presently represents approximately 28% of all fossil fuel usage in this region. As for the North American case, there is some indication that fossil fuel consumption has perhaps started to decline during the past 5 years in this region too. However, unlike the case for North America, a quadratic least-squares curve (not shown) does not yield a significantly better fit to the electricity data, or even a negative slope for the year 2012.
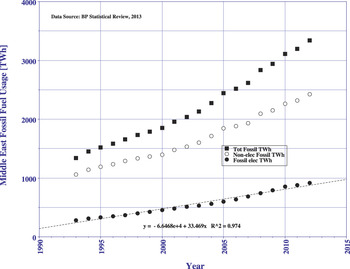
The Middle East
Figure 9 shows the FFEG of the Middle East during the past 20 years, within the context of overall fossil fuel consumption of this region.4
The past twenty years of Middle East fossil fuel consumption.4

It shows a linearly rising trend in FFEG, at an approximate rate of 33.5 TWh y−1, and that electricity presently constitutes approximately 28% of the total use of fossil fuel in the region.
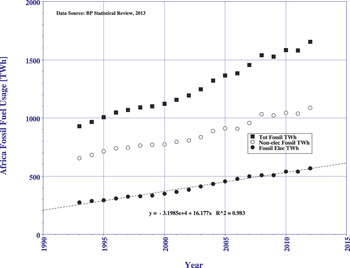
Africa
Figure 10 shows the FFEG of Africa during the past 20 years, within the context of overall fossil fuel consumption of this continent.4
The past twenty years of Africa's fossil fuel consumption.4

It shows a linearly rising trend in FFEG, at an approximate rate of 16.2 TWh y−1, and that electricity presently constitutes approximately 34% of the total use of fossil fuel in the region.
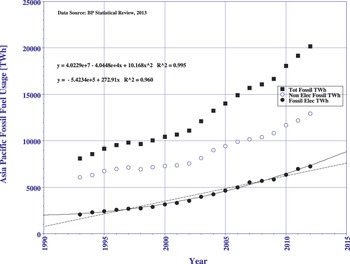
Asia-Pacific
Figure 11 shows the FFEG of the Asia-Pacific region during the past 20 years, within the context of overall fossil fuel consumption of this part of the world.4
The past twenty years of Asia-Pacific fossil fuel consumption.4

Figure 11 shows that electricity generation presently constitutes approximately 36% of the total use of fossil fuel in this region. A linear least-squares fit to the FFEG data in Fig. 11 (broken line) yields a slope of 273 TWh y−1 (R 2 = 0.960). This rate of increase is probably unrealistically low, because a quadratic least squares fit (bold curve) provides a significantly better fit to the data (R 2 = 0.995, compared to 0.960 for the linear fit). For a quadratic fit, the slope for 2012 is 468 TWh y−1. The difference in these two slopes is so large that in the following discussion both the linear and quadratic growth possibilities will be discussed separately as regards their implications.
A wind and/or solar alternative: scale and technical feasibility
Scale
The review thus far has emphasized electrical energy requirements, whereas electricity-generating plants are usually rated and purchased according to their name-plate power ratings. In the case of conventional power generation, the amount of energy generated in a year is simply the power rating, multiplied by the number of hours in a year, multiplied by the effective fraction of the year during which the plant was operating at full power (its so-called capacity factor). However, in the case of solar and wind plants, the amount of annual energy they generate, for a given name-plate rating, will depend upon the climatic features of the region in which they operate. For example, one well-documented 3.5 MW utility-owned PV system at Springerville in the Arizona desert yielded an average 1707 kWh y−1 per kW during its first 3 years of operation.Reference Moore and Post5 On the other hand, PV plants located in Europe, owing to that continent's lower insolation levels, understandably produce lower annual energy yields per name-plate rating.Reference Leloux, Narvarte and Trebosc6 In a similar manner, the annual performance of wind plants will also depend upon local climatic conditions – wind rather than sunshine being the relevant energy source. For example, a recent study of the performance of wind plants throughout Europe found that national capacity factors varied in the range 0.175–0.293, the continental average being 0.208.Reference Boccard7 Therefore, to overcome this complication in a manner that is easy to correct for any specific situation of interest, the present paper makes a number of assumptions:
Assumption 1a. For the sake of specificity, it will be assumed that all new PV plants would give an annual yield of 1500 GWh GW−1 (i.e., a capacity factor of 0.171) no matter where they are located. This is a definite number that: (a), as Ref. Reference Moore and Post5 demonstrates, is achievable in some places; (b) can be corrected depending upon the solar radiation statistics for any particular site of interest.
Assumption 1b. Again for the sake of specificity, it will be assumed that all new wind plants will have an annual yield of 1752 GWh GW−1 (i.e., a capacity factor of 0.2). Again, this (a) is manifestly achievable, as evidenced by Ref. Reference Boccard7; (b) can be corrected depending upon the wind statistics for any particular site of interest.
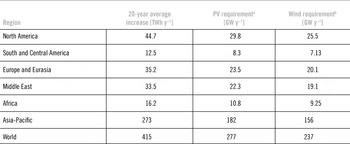
Using these assumptions, Table 1 lists the magnitude of the PV or wind plants that each of the regions under discussion would need to install each year, in order not to have to continue building new FFEG plants.
Annual PV or wind requirement for overcoming the present need for increased FFEG.

a Based upon nominal 1500 GWh y−1 GW−1.
b Based upon nominal 1752 GWh y−1 GW−1.
The table shows, e.g., that North America would need to install 29.8 GW of PV, 25.5 GW of wind, or some combination of the two, each year, to be able to obviate the need for new FFEG plants.
Technical feasibility
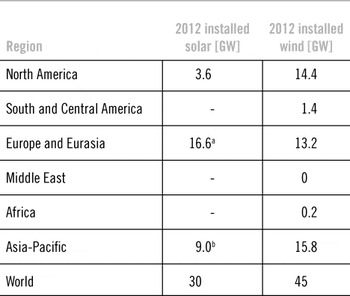
As a first indication of the feasibility of such implementation, it is instructive to examine the amount of new renewable energy generating capacity that each of these regions actually installed during the year 2012. These figures are shown in Table 2.4
New solar and wind capacity installed during 2012.

a Includes PV and solar-thermal.
b Includes only Australia, China, India, Japan, South Korea, and Malaysia.
The encouraging picture that emerges, if one compares Tables 1 and 2, is that North America's wind and solar installation during the year 2012 – if it could be increased by approximately 50% and continued on an annual basis – would be just about sufficient to offset the need to construct new FFEG plants in that continent. In other words, North America probably has the necessary PV and wind manufacturing capacity for such a program. Somewhat more promising is the fact that Europe's construction of new renewable energy plants during 2012, if repeated each year, could actually change the sign of the past (upward) trend in Fig. 8 thus, not only obviating the need to build new FFEG plants, but also allowing the possibility of shutting down some of that continent's older power plants.
For South and Central America, the Middle East, and Africa, the introduction of solar PV and wind plants during 2012 was almost negligible when compared to those regions' rising construction of FFEG plants. However, because their rates of power plant construction have hitherto been much smaller than those of North America and Europe–Eurasia, the scale of solar and wind implementation in the latter two continents indicates that enough renewable energy technology could, in principle, be exported to the other three regions to enable them to halt the construction of new FFEG plants.
Asia-Pacific is the most problematic region. Here, the 2012 level of introduction of renewable energy plants would need to be increased by a factor of 5 to 6 and then continued on an annual basis. And this is based upon the linear fit to the data in Fig. 11 rather than a quadratic fit. If the latter is a more realistic indication of forthcoming needs, then the region would need to increase its annual introduction of wind and/or PV by a factor of 10 compared to its 2012 level. Therefore, perhaps the most pressing global question is whether it would be possible for the Asia-Pacific group of countries to stop building FFEG plants and provide their growing need for electricity with solar PV and wind. Quantitatively, a quadratic fit to their electricity generating data indicates that new FFEG plants are probably being introduced into the Asia-Pacific region at a rate of 468 TWh y−1. If these plants have a typical capacity factor of 0.6, then this translates into 1700 GW of new plant each week. To halt this growth in fossil-fuel usage, it would require the annual installation of 312 GW of PV, or 268 GW of wind, or some combination. To seek an answer to whether implementation on such a scale is feasible, it is instructive to examine the case of China, because that country has what is probably the largest solar and wind manufacturing capability in the world at the present time.
China
Figure 12 shows China's use of fossil fuel for the past 20 years.4
The past twenty years of China's fossil fuel consumption. Data from Ref. 4.

From these graphs, it is evident that electricity generation constitutes approximately 35% of the country's use of fossil fuel. Moreover, a linear least-squares fit to the electricity data (broken line) indicates an average annual increase at the rate of 174 TWh y−1. However, a quadratic curve (bold curve) provides a better fit to the data (R 2 = 0.992, compared to 0.924 for the linear fit) and has a slope of 350 TWh y−1 for the year 2012. Therefore, to discontinue the construction of new fossil-fueled plants, China would need an annual installation of at least 99 GW of wind turbines or 116 GW of PV plants, or some combination. On the other hand, if the quadratic fit is more realistic, 200 GW of wind or 233 GW of PV would be needed – annually.
To assess how realistic such a program could be, one must ask: (a) whether PV plants can be constructed at the GW scale on an annual basis; (b) whether there is enough available land area to support such growth; and (c) Whether there is sufficient manufacturing capability.
Scale and rate of introduction for China
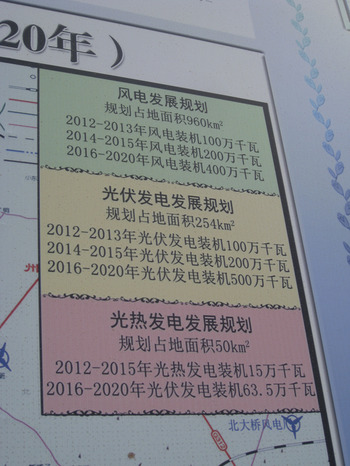
On a visit to Gansu Province in China during the summer of 2012 the author was taken to a wind farm at Yumen, consisting of 1160 turbines, each with a rating of at least 1.5 MW, and a PV installation at Dunhuang with a name-plate rating of 1 GW. Therefore, GW-scale wind farms and solar PV installations are already a practical feasibility. Furthermore, the construction program for the coming years at Dunhuang is displayed prominently on a large on-site bill-board, as shown in Fig. 13. It is particularly instructive.
Billboard at a 1 GW PV installation site in Dunhuang, Gansu Province, China, advertising plans for installing renewable energy plants at that site during the period 2012–2020. (Photographed by the author in July 2012.)

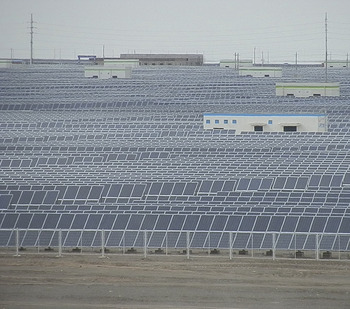
The upper block in Fig. 13 indicates that 7 GW of wind turbines are planned for introduction at this site by 2020. The middle block indicates that 8 GW of PV are to be constructed during the same time period, and the lower block indicates that 0.785 GW of solar-thermal plant will be installed there during that time. All of this at a single site. If such a program is indeed carried out – and the first GW of PV was in evidence there in July 2012 (Fig. 14) and ostensibly nearing grid-connection – it will demonstrate that it is feasible to construct GW-scale PV and wind plants on an annual basis.
Part of a 1 GW PV plant at Dunhuang, Gansu Province, China. (Photographed by the author in July 2012.)

Land requirements for China
There have been extensive studies on the question of land requirements for PV and wind as, for example, see Refs. Reference Ong, Campbell, Denholm, Margolis and Heath8 and Reference Denholm, Hand, Jackson and Ong9. However, in specific regard to China, a highly relevant item of information appears in the middle section of the bill-board in Fig. 13. It specifies the amounts of land area that have been allocated for PV and wind in this part of the country. They are 254 km2 for 8 GW of PV and 960 km2 for 7 GW of wind. This means that 31.75 km2 of land have been allotted to each 1 GW of PV, and that each 1 GW of wind will occupy 137.1 km2 of land.
To see what these figures imply for the scale of installation posited here, consider first the case of PV. Adopting the linear (quadratic) growth rate indicated in Fig. 12: to install 116 (233) GW per year, China would need to allocate 3683 (7398) km2 of land per year. An assumption here is that, if the quadratic curve is the more realistic fit to the past growth, future growth need continue only linearly, albeit at the 2012 rate, rather than continuing to rise quadratically. An immediate question, whichever growth rate is decided upon, is: How long is such growth possible, or even necessary? Naturally an absolute upper, albeit unrealistic limit, is that growth is possible until the country is completely covered with solar or wind plants. However, in practice, there will probably come a time, whatever the technology used, when China will decide that the country has enough electricity generating capacity. Naturally, there is no way of knowing what that capacity will be; however, it is possible to make an intelligent guess.
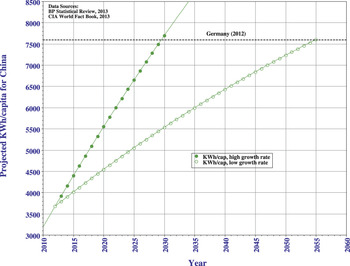
As a hypothetical target, the case of Germany is instructive. In 2012, Germany had a population of approximately 81.3 millionReference Boccard7 and generated 617.6 TWh of electricity.4 This translates into a per capita generation of 7596 kWh per year. Now, Germany is an example of a fully industrialized country, whose electricity needs are not being driven by population growth. It may thus be argued that the country has as much electricity as it needs for a comfortable life-style and a productive economy. It is therefore interesting to calculate how many years it would take China to reach the same per capita electricity generation that Germany enjoys today and what the land requirements would be for PV and wind. China's population and population growth rate are currently estimated to be 1.35 billion and 0.46% y−1, respectively.10Figure 15 accordingly plots the projected annual per capita electricity generation of that country under the two electrical growth scenarios 174 TWh y−1 and 350 TWh y−1. The two curves start at the value 3658 kWh per capita in the year 2012 and are continued until they meet the assumed German target.
Projected growth in China's per capita electricity production, assuming annual new generation of 174 TWh (open circles) and 350 TWh (filled circles). Starting point is China's total electricity generation of 4937.8 TWh for 2012.4 Assumed population growth rate = 0.46% y−1.10 Dashed horizontal line = Germany's 2012 per capita generation.

Figure 15 reveals that at the lower electricity growth rate the target would be met by the year 2055, and at the higher growth rate the target could be met by the year 2029. In terms of land coverage, if all new plants were to be of the PV variety, the shorter-term target of 17 years would require 126,000 km2, equal to 1.3% of the total land area of China. The longer-term target of 43 years would require 158,000 km2, equal to 1.6% of the country's land area. These percentages of land coverage are comparable to the percentage coverage of the USA by highways11 and hence are not unreasonably large.
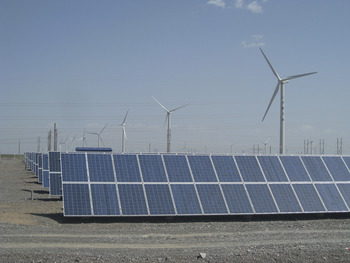
In the case of wind, it has already been seen that China would need to allocate approximately 4 times the amount of land compared to the PV case. However, in that situation, the land between the turbines could be used for other purposes – including the insertion of PV panels in regions where agriculture is not feasible. Such dual land usage is already being experimented in the desert at Yumen (Fig. 16).
Some of the 1160 wind turbines at Yumen, Gansu Province, China, with PV panels as “space fillers”. (Photographed by the author in July 2012.)

One may therefore conclude that by the massive introduction of PV technology, China could achieve similar per capita electricity generation as Germany for the expenditure of 1–2% of the country's land area, without the need to construct another FFEG plant. Furthermore, whatever power-generating technology is chosen, one notices that this target can be achieved by a linear rate of electrical growth into the future instead of the quadratic growth witnessed by the past 20 years of China's development.
Manufacturing capability of China
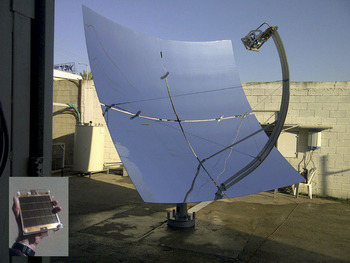
During each of the years 2011 and 2012, Chinese industry manufactured 20 GW of PV modules.Reference Sicheng12 Such a production rate is clearly too small to enable the annual construction of PV plants with even 116 (not to mention 233) GW name-plate ratings. The simple solution – bearing in mind that there could be a potential export market of 126–161 GW per year for PV modulesFootnote ‡ – might be to increase the number of existing manufacturing facilities in proportion to market requirements. However, there is also an alternative, which takes into account the possibility that concentrator PV (CPV) systems may become more suitable for desert sites than are today's non-concentrator systems. The reason is that CPV systems typically require three orders of magnitude less PV material than do conventional PV systems of the same power rating, as illustrated in Fig. 17.
A CPV unit consisting of a 10 m2 mirrored dish of 1000X concentration and a 100 cm2 CPV module (shown in the inset) of 2 kWp rating. [Photo credit: Roy Segev]

This proportion translates approximately into the amount of floor space per GW of the required cell fabrication plant. Therefore, if China were to convert 2% of its existing PV fabrication facilities to CPV, a single facility that today produces 400 MW y−1 of silicon cells could produce 400 GW y−1 of concentrator cells: enough, in principle, to supply the entire world, even if the quadratic fit to Fig. 5 is taken.
Without the need for discussing wind any further, it should thus be clear that China has or could have all of the necessary PV/CPV manufacturing capability for enabling itself – and possibly the rest of the world – to forego the need to construct any more FFEG plants.
The other two major electricity producers of this region are India and Japan. The former, like China, would have no land allocation problems for PVReference Sharma, Tiwari and Sood13 or windReference Sawyer, Pillai and Kymel14 plants. On the other hand, Japan, on account of its relatively small geographic size, would probably need to resort to substantial amounts of offshore wind plants.Reference Ushiyama15
The cost of renewable electricity
Conventional cost metrics
In comparing the cost of different power-producing technologies, it is conventional to calculate the levelized cost of energy (LCOE) over the expected plant life. For this purpose, many factors need to be included, most of which are not important for the estimates of relevance to the present discussion. However, the interested reader will find a comprehensive discussion applied to all power-generating technologies, including the renewable variety, in Ref. Reference Tidball, Bluestein, Rodriguez and Knoke16. A starting point for a full LCOE analysis is the installed cost of the plant. In the case of PV and wind, the installed costs of utility-scale systems have decreased substantially in recent years and this trend may be expected to continue as more large plants are implemented. A recent reportReference Feldman, Barbose, Margolis, Wiser, Darghouth and Goodrich17 indicates that in 2011, large PV plants were being installed in the USA at quoted costs as low as 2.45 US$/W. In the case of wind, a recent Environmental Impact Assessment (EIA) study18 indicates that for systems going on line in 2014, the so-called “overnight cost”Footnote § of land-based plants is 2.061 US$/W, but higher for offshore systems. For the case of specificity, this paper accordingly makes:
Assumptions No. 2a and 2b: Both PV and wind plants can be installed at 2 US$/W for an entire system.
As in the case of the previous assumptions regarding annual energy output, these cost figures can be readily corrected for any specific case of interest. The precise values will not affect the second main point of this paper (in subsection “Alternative funding mechanisms”) – which depends more on orders of magnitude than precise numbers.
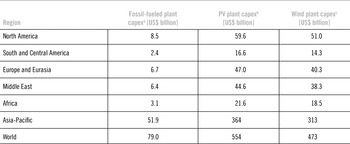
Enough data and assumptions have now been assembled to enable an estimate of the capital expenditure (capex) that each region in Table 1 would need to construct PV and wind plants instead of new FFEG plants. For convenience, the numbers are shown in Table 3. As a point of reference, Table 3 also estimates the capital cost of new FFEG plants under an assumed average installation cost of $1/W and a nominal capacity factor of 0.6. Modern FFEG plants are capable of being operated at significantly higher capacity factors.Reference Tidball, Bluestein, Rodriguez and Knoke16 However, the present estimates prefer a lower figure as being probably more representative of the manner in which FFEG plants are operated in regions that do not enjoy a well-developed and coordinated electricity grid. In any case, these figures are only intended to be indicative of the fact that the capex cost of FFEG plants is considerably lower than that of PV and wind plants.
Annual capital expenditure in new PV or wind generators needed to replace new FFEG plants.

a Assumes capex = 1 US$/W, c.f. = 0.6.
b Assumes capex = 2 US$/W, c.f. = 0.171.
c Assumes capex = 2 US$/W, c.f. = 0.2.
In the case of FFEG plants, there is a second major ingredientReference Tidball, Bluestein, Rodriguez and Knoke16 to the LCOE, namely the cost of the fuel that will be consumed during the plant life. Under the fuel prices that pertained when Ref. Reference Tidball, Bluestein, Rodriguez and Knoke16 was written, and the assumptions about fuel escalation rates made therein, the LCOE associated with fuel is typically of similar magnitude to the capex cost for the various types of FFEG plants, and in some cases, even more than the capex cost.
Table 3 reveals that the capex needed for large PV and wind plants is roughly a factor of 5 larger than that needed for conventional plants of the same annual energy output, if realistic capacity factors and contemporary cost magnitudes are taken into consideration. As previously indicated, the effective ratio is actually smaller because fuel costs have not been included. However, a major financial obstacle to the large-scale implementation of PV and wind, irrespective of fuel costs, is that their fuel saving has to be paid for upfront. For example, one of the projections shown in Ref. Reference Tidball, Bluestein, Rodriguez and Knoke16 indicates that although coal and wind were expected to have similar LCOEs to one another by the year 2015, almost 40% of the coal plant LCOE would come from its fuel consumption, the saving of which, in the case of wind, would need to be paid for in advance.
Naturally, for all technologies, as illustrated in Ref. Reference Tidball, Bluestein, Rodriguez and Knoke16 one must also include interest rates; expected plant lifetimes and rates of degradation; operation and maintenance costs, and the availability of subsidies. However, in the case of very large systems, one must also consider the readiness of banks to underwrite such investments.
Up until the present time, funding for solar PV and wind plants has been available, because the governments of a number of major energy consuming countries have internalized many of the external costs of fossil fuel via the introduction of mechanisms that render the payback period on renewable energy systems reasonable in the eyes of banks and other investors. Such mechanisms include the imposition of a “carbon tax” in proportion to CO2 emissions; tax relief for people and institutions who install solar PV or wind systems; a so-called feed-in-tariff, which requires utilities to purchase all solar- or wind-generated power at a guaranteed long-term tariff in excess of the present market price of electricity; and so-called “net-metering” that enables the PV system owner to use their own electricity and to sell only the surplus to the utility, thus obviating the need to pay retail prices for the portion they use. (Because there is an enormous literature and much controversy regarding the relative efficacy of these support mechanisms, the interested reader is referred to the respective Wikipedia review articles as useful starting points.)
However, in spite of these incentives, the systems that have been constructed under such scenarios are relatively small compared to those indicated in section “A wind and/or solar alternative: Scale and technical feasibility”. For example, the largest PV system installed to date, outside China, has a DC power rating of only 400 MW.Reference Morjaria and Anichkov19 Similarly, the largest wind farms outside of China typically have ratings of around 1000 MW.Reference Denholm, Hand, Jackson and Ong9
By the previously stated assumptions, the largest extant systems would have had capex costs close to US$ 1 billion. However, for North America, Table 3 shows that if solar and/or wind was to obviate the need for any new construction of FFEG plants, capital would need to be available at the rate of US$ 50–60 billion each year. Correspondingly, on a global scale, the capex investment in solar and/or wind plants would need to be approximately US$ 0.5 trillion every year. It is thus by no means obvious that financing on the GW scale would be available from the sources that have hitherto funded PV and wind on the MW-scale.
Alternative funding mechanisms
The previous section indicated that to be able to stop building new FFEG plants entirely, and to provide for the present increasing worldwide trends in electricity growth, the annual capex investment in solar PV and/or wind plants would need to be of the order of US$ 0.5 trillion per year. This sum is 2–3 orders of magnitude larger than the capex investment money that has hitherto been available for renewable energy plants. Furthermore, it is probable that except, perhaps, for countries with extremely strong economies and stable political systems, the necessary scale of financing would not be available from banks or private investors. It is accordingly necessary to examine some possible alternative paths for raising this capital.
One previous suggestionReference Faiman, Raviv and Rosenstreich20 was to issue government-backed bonds that would fund a credit line for the construction of large PV. The model suggested in Ref. Reference Faiman, Raviv and Rosenstreich20 involved the annual construction of GW-scale plants, which would start generating revenue, and hence returning investment costs, as soon as each went on line. For the specific examples of CPV plants given in Ref. Reference Faiman, Raviv and Rosenstreich20, it would take approximately 5 years for each plant to return its investment and approximately 20 years for a sequence of 15 plants to generate sufficient annual revenue to fully fund the continued yearly construction of new plants. This ability of the revenues from existing plants to “breed” new ones on an annual basis was referred to as “Type-2 Sustainability”. A 20-year bond issue would thus typically suffice to fund such a program. However, although such a funding scheme might be feasible for plants in the southwestern states of the USA, it is questionable whether a stable enough world market would exist that would enable the sale of US$ 0.5 trillion worth of new bonds every year.
Another possibility might be based upon the numerical coincidence that, according to a recent International Energy Agency (IEA) study,Reference Priddle21 annual fossil fuel subsidies are also approximately US$ 0.5 trillion. The authors of Ref. Reference Priddle21 already suggested that such subsidies might be better spent on renewables. However, the feasibility of transferring fossil subsidies to PV/wind would need to be examined on a country-by-country basis, particularly since “fossil fuels” in this context include subsidies for nonelectrical purposes, such as transportation fuel. But given that some portions of these subsidies are for electricity generation, the economics might turn out to favor a solar and/or wind alternative in certain cases.
By far, the most sustainable funding mechanism would be the imposition of an electricity consumption tax (ECT), the proceeds of which would be dedicated to the construction of appropriately scaled solar or wind plants, depending upon local climatic conditions. Some countries already impose such a tax, albeit not on a scale that enables them to cease the construction of new FFEG plants. Of course, the imposition of an ECT on the scale under discussion here would be fraught with problems, some of which will be discussed below. Nevertheless, an ECT would constitute a means of ensuring a constant flow of capital of the required order of magnitude, as will now be demonstrated.
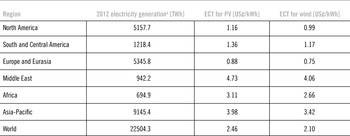
One may obtain a first approximation of the magnitudes involved, by dividing the capex cost of the required solar or wind plants for each region by the 2012 annual electricity generation of that region. For example, if the US$ 59.6 billion needed annually for PV plant construction in North America is divided by the 5157.7 TWh generated in 2012,4 it will be seen that an ECT of 1.16 US¢/kWh would cover the turn-key costs of all the required new solar plants for one year. Alternatively, an ECT of 0.99 US¢/kWh would pay for the equivalent in wind plants.
At this stage, these numbers serve only an indicative purpose. The reader should not infer that wind is economically superior to solar. There will, of course, be locations within North America where this is the case, and others where the opposite conclusion will hold. Adjustment must also be made between the difference of electricity “production” (used for the present ECT estimates) and “consumption” figures that may vary substantially, depending upon location and the possibility of cross-border trading. However, the picture that emerges from this simple estimate is that an ECT would be a small addition to what most residents of North America are currently paying for electricity. Within the spirit of these same assumptions, Table 4 indicates the corresponding PV and wind ECTs for each of the regions.
ECT needed to fund PV or wind generators that would replace the requirement for new FFEG plants.

a From Ref. 4.
Table 4 shows that, costly as solar and wind technologies are commonly held to be when viewed as capex cost per kW relative to FFEG plants, if viewed as an addition to what most consumers already pay for electricity in the developed countries the additional cost is relatively small.
Discussion
The present study has indicated that the continuing worldwide construction of FFEG plants could in principle be replaced by a corresponding construction of solar PV and wind plants, and that an ECT could provide the necessary funding.
A serious obstacle to the imposition of an ECT is that taxes are not usually designated for funding specific projects. Instead, governments normally try to use the proceeds of taxation, in as flexible a manner as possible, for the overall benefit of the economy. In this regard, to halt the production of new FFEG plants and replace them with any other kind of technology would itself constitute a serious disruption of an economic equilibrium that had hitherto been achieved as regards energy supplies, trade balances, employment, etc. Therefore, irrespective of the hardware under consideration or the method by which it is to be funded, the overall effects on the economy of replacing one kind of power production technology by another would have to be weighed with great care. Nevertheless, if climate change concerns were to become serious enough at international governmental levels to require such a technology change, then the foregoing analysis indicates that, huge as the required scale would be, PV and wind could obviate the need to build new FFEG plants and that an ECT could provide the necessary, assured, long-term funding.
In such a scenario, a related problem would be how to impose an ECT upon economically disadvantaged people, both within developed countries and, on a country-wide basis, in countries where such a tax would not constitute a small addition to existing electricity costs. This is an important social issue that is not covered in the present paper.
Two technical issues that would also need to be addressed, both of which would increase the costs discussed here, are short-term storage and long-distance transmission.
Since each of these topics requires a major discussion, attention here will be restricted to a small number of the most salient points. First, short-term storage (i.e., up to several hours) is for grid-matching purposesReference Solomon, Faiman and Meron22: not for day-to-night purposes, because most utilities generate more nighttime electricity than they can sell. As regards daytime grid-matching, the problem starts to manifest itself when PV or wind plants become sufficiently large that there are times when they generate more power than the electricity grid can use. At such times, the employment of storage enables these surpluses to be used at later times when solar or wind generation is lower. However, a number of different site-specific studiesReference Denholm and Margolis23,Reference Solomon, Faiman and Meron24 have found that storage would not start to become an important issue until the solar input approaches approximately 20–30% of total grid requirements. Such a state of affairs would normally take several years to achieve, even under the scale of the construction scenarios discussed here. In the case of China, Fig. 15 indicates that this level of penetration would be reached in approximately the fifth year. To begin with, only the energy capacity property of storage would be important. However, as the PV or wind input gradually becomes the dominant grid supplier, the power capacity property of storage becomes correspondingly important.Reference Solomon, Faiman and Meron25 This is because there would be times, particularly in winter, when storage is called upon to provide large amounts of power in short periods of time. Therefore, appropriate storage methods would need to be developed as part of the implementation of such a construction strategy.
There would also need to be a degree of regulation regarding the manner in which storage would be used. Specifically, it might turn out that local economic considerations could prefer the employment of storage for the arbitrage of night-generated energy from existing FFEG plants rather than for optimizing solar and wind input into the grid. The fact that under an ECT the public, rather than the utility, would have paid for the PV and wind farms, could contribute toward economic considerations of this kind. Such actions would need to be disallowed because on a wide-enough scale they could significantly neutralize the benefits of PV and wind.
Regarding long-distance electricity transmission, there are grounds for cautious optimism, because ultrahigh voltage DC lines over 1000 km stretches are already a reality, and so-called “high-temperature” superconducting cables are becoming commercially available. It is thus reasonable to expect that in the time period under discussion, the costs of transmission will diminish in a significant manner without the need for a major technology break-through. However, as with storage, there are a number of unknowns about transmission that would need to be considered by policy makers.
Finally, it must not be forgotten that, as seen in Fig. 4, the nonelectrical uses of fossil fuel are also rising. This rise must also be stabilized in any serious attempt to decrease the annual increase in CO2 emissions. Part of this increase, notably in the transportation sector, could be provided by solar PV and wind, but this would increase all of the present size and cost estimates substantially.
Conclusions
The atmospheric content of CO2 rose by approximately 16 Gt in 2012. A non-negligible contribution to this increase must surely have come from the 35 Gt of CO2 emitted by fossil fuel consumption that year, of which 11 Gt came from fossil-fueled electricity. Therefore, if the purpose of introducing PV and wind is to reduce such emissions on a significant scale, then a minimum consideration should be to halt all new construction of FFEG plants. Assuming that such an action could occur without causing economic havoc – itself a questionable assumption – the present paper has discussed, on a continent by continent basis, the possibility of providing for the world's presently increasing electricity requirements by PV and wind technologies, and the implications in terms of hardware, land availability, and costs. It has found that, in principle, PV and wind could obviate the need to build new FFEG plants but the annual capex cost would be of the order of US$ 0.5 trillion. Three novel methods for raising such amounts were examined: government bonds for providing credit lines; transferal of fuel subsidies to renewables; and an ECT. It was found that bonds could be feasible in situations where there is a stable economy; but that subsidy transfer is questionable except perhaps in very limited circumstances. Among the three, only an ECT could be capable of providing a long-term source of funding for renewables on this scale. In many countries, notably in North America and Europe, such a tax would constitute a small addition to present electricity tariffs (i.e., of order 1 US¢/kWh) but in others it could be as high as 2–5 US¢/kWh. Attention was drawn to a number of practical issues, social and technical, associated with the implementation of an ECT, each of which requires further study.
Acknowledgments
The author wishes to acknowledge helpful discussions with Professor Pinhas Alpert of Tel Aviv University, Dr. Honi Kabalo of the Israel Electricity Authority, Professor Armin Rosencranz of Stanford University, Professor Wang Sicheng of the Chinese Academy of Science, Professor Amos Zemel of Ben-Gurion University, and his colleagues in the Task 8 IEA Photovoltaics Specialist Working Group “Very Large-Scale Photovoltaic Systems”.