Adenovirus outbreaks in neonatal intensive care units (NICUs) are well described and are associated with significant morbidity and mortality.Reference Asencio-Duran, Romero-Martin and Garcia-Martinez 1 – Reference Piedra, Kasel and Norton 8 Retinopathy of prematurity (ROP) exams have been implicated as a mode of viral transmission in NICU adenovirus outbreaks.Reference Asencio-Duran, Romero-Martin and Garcia-Martinez 1 – Reference Percivalle, Sarasini and Torsellini 7 Once an outbreak has been identified, institutional management is critical to minimizing its extent and severity. Decisions regarding the duration of implemented infection control procedures are complicated by the characteristics of the virus, notably its environmental stability and ability to produce a prolonged asymptomatic shedding phase following active infection.Reference Gordon, Gordon and Romanowski 9 – Reference Allen and Demmler 11 We describe the epidemic features and management of a NICU adenovirus outbreak, including the novel use of qualitative and semiquantitative real-time polymerase chain reaction (qPCR) data to guide outbreak management strategies.
Methods
Setting and institutional review
This retrospective, observational study of an adenovirus outbreak was conducted in 2012 in a 60-bed, level IV NICU located in a tertiary-care pediatric center. The NICU is composed of individual patient rooms arranged around the perimeter of the unit. This research was approved by the Institutional Review Board of The University of Tennessee Health Sciences Center, Memphis, Tennessee.
Outbreak description
The outbreak was identified after 2 index cases had positive adenovirus qPCR studies obtained due to conjunctivitis, which led to the screening of all NICU inpatients with qPCR of nasopharyngeal (NP) swabs. Overall, 42 patients were screened and 13 were positive (day 0). Cases were defined as all NICU patients with at least 1 NP qPCR study positive for adenovirus during the outbreak period. Exposed individuals were defined as all patients with negative adenovirus screening tests in the NICU on day 0. In response to the outbreak, a multidisciplinary team was formed to guide response measures. Potential modes of transmission were considered, including nosocomial spread via healthcare workers and/or shared equipment, and spread via visitors or family members residing on the unit with their infants. Outbreak response infection control procedures, as detailed in Table 1, were enacted.
Summary of Outbreak Response Infection Control Procedures

To monitor the outbreak trajectory, serial NP qPCR assessments were planned. For adenovirus cases, NP qPCR studies were obtained 3 times weekly for the duration of the outbreak response period. Specimens were also evaluated using viral culture and serotyping. For the exposed group, NP qPCR screenings were performed on day 7, day 14, and day 21 after outbreak identification. On day 21, the NP qPCR studies for the 6 cases remaining in the unit were all negative; contact and droplet isolation precautions were discontinued for the exposed group. Based on the known adenovirus incubation period of 2–14 days and additional screens of cases remaining negative, general outbreak response procedures were discontinued on day 33.
Laboratory testing
The NP PCR specimens were obtained using flocked swabs (Copan Diagnostics, Corona, CA) inserted to depths past the choanae by NICU nurses. Specimens were placed in 3 mL of viral transport media (M4RT, Remel Products, Lenexa, KS) and frozen at −20°C until the test was performed. Specimens were analyzed with multiplex qPCR (ProAdeno Assay, Gen-Probe, San Diego, CA) performed on site. The test detects adenovirus types 1–51 but does not differentiate among them. In addition, DNA extraction was performed via NucliSENS easyMAG System using the automated magnetic extraction reagents (bioMérieux Clinical Diagnostics, Marcy l’Etoile, France). Amplification and detection were performed in a SmartCycler II instrument (Cepheid, Sunnyvale, CA) using the ProAdeno Supermix, which contains target-specific oligonucleotide probes, oligonucleotide primers complementary to a highly conserved region of the HAdV hexon gene, and a Taq DNA polymerase. 12
The ProAdeno assay has a reported clinical sensitivity of 97.5% (95% CI, 87.1–94.3) and specificity of 95.6% (95% CI, 94.3–96.7). 12 The qPCR cycle threshold (CT) value is the PCR replication cycle number at which the reporter dye emission intensity begins to rise logarithmically above the background noise.Reference Grove 13 The CT value is inversely proportional to the log amount of target nucleic acid present in the specimen; therefore, the lower the CT value, the higher the viral load in the patient specimen. Consistent with prior publications, in this study, CT values were used as a proxy measure of viral load.Reference Smit, Pronk and Kaandorp 14 – Reference Hernes, Quarsten and Hamre 16 The CT values were reported for all positive studies and trends were followed over time. The assay used in this study was run for 45 cycles. For clarity, the CT values are reported as 45 minus the CT value, which allows a lower value to represent a lower viral load.
Viral cultures on human lung carcinoma cell monolayers were performed in the institution’s virology laboratory. Adenovirus typing was performed via a neutralization reaction with specific typing antisera (test 81175, Focus Diagnostics, Cypress, CA).
Clinical data collection
Medical records of cases were retrospectively reviewed for clinical information. Findings considered consistent with adenovirus were signs and symptoms of conjunctivitis and/or viral upper (URTI) or lower respiratory tract infection (LRTI). Patients were concluded to have had conjunctivitis if any of the following were recorded in the chart without alternative explanation: conjunctivitis diagnosis; description of ocular signs and symptoms consistent with conjunctivitis; culture of eye secretions obtained; antibiotic eye drops started. For viral URTI/LRTI, these signs and symptoms included change in baseline respiratory support, physical exam findings consistent with upper (URTI) or lower respiratory infection (LRTI), or new infiltrate on chest radiograph. For description of the duration of clinical illness, the first mention of relevant findings was considered day 1, and the endpoint was the first date that any of the following was noted: resolution of conjunctivitis signs and symptoms, antibiotic eye drops stopped, respiratory support returned to baseline level, discharge, or death. Medical records of the exposed group were reviewed for demographic factors and the presence of potential risk factors for transmission.
Data analysis
Statistical analysis was performed using GraphPad Prism software, version 6.0c for Mac OS X (GraphPad Software, La Jolla, CA). Demographic continuous variables were expressed with medians and ranges; groups were compared using the Mann-Whitney test. Categorical values were compared using the Fisher exact test or odds ratio calculation. Laboratory continuous variables were expressed with means and confidence intervals. All P value tests performed were 2-tailed, and P values<0.05 were considered statistically significant.
Results
In total, 13 patients were qPCR positive for adenovirus. Additionally, 7 adults (3 NICU nurses and 4 family members) were noted to have conjunctivitis symptoms during the course of outbreak proceedings and were excluded from the unit according to the existing infection control policy. No healthcare workers had recent or ongoing illness consistent with adenovirus infection when the outbreak was identified. No new cases were identified among NICU patients after the outbreak was identified.
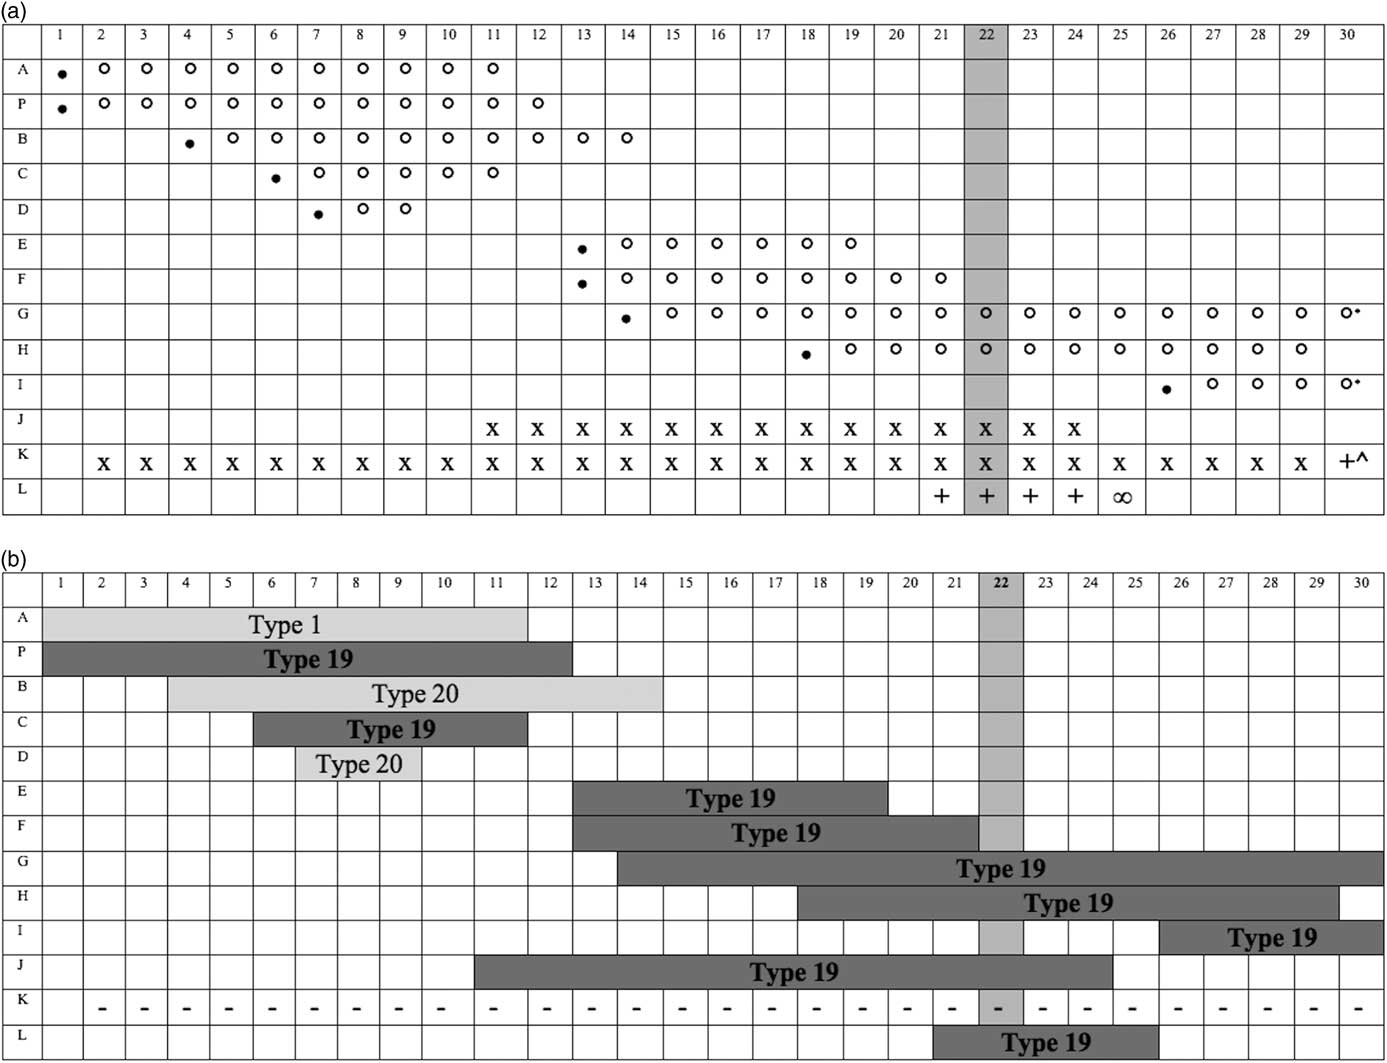
Among cases, only 4 patients had documented findings consistent with adenovirus infection at the time the outbreak was identified. Retrospective review identified clinical findings consistent with adenovirus in an additional 7 cases in the 3 weeks before and 1 week after outbreak identification. The timing of clinical illnesses is depicted in Fig. 1a. Two patients (J and K) required increases in respiratory support during the review period.
a. Timing of clinical findings for adenovirus-positive patients. The 13 adenovirus positive patients represented by rows with days from the initial symptomatic case represented as columns. Day 22 (darkly shaded column) indicates the identification of the outbreak. Legend: ∙, conjunctivitis diagnosis; °, conjunctivitis symptoms/topical ocular treatment; x, increased respiratory support, multiple potential etiologies; +, Increased respiratory support; ∞, death; *, topical ocular treatment continued: patient G to day 33 and patient I to day 37; ^, returned to baseline support on day 36. b. Adenovirus type. Adenovirus types corresponding to the clinical symptoms illustrated in Fig. 1a. Patient K was PCR positive, however, typing was not possible as the virus did not grow in tissue culture. This has been denoted as (−).

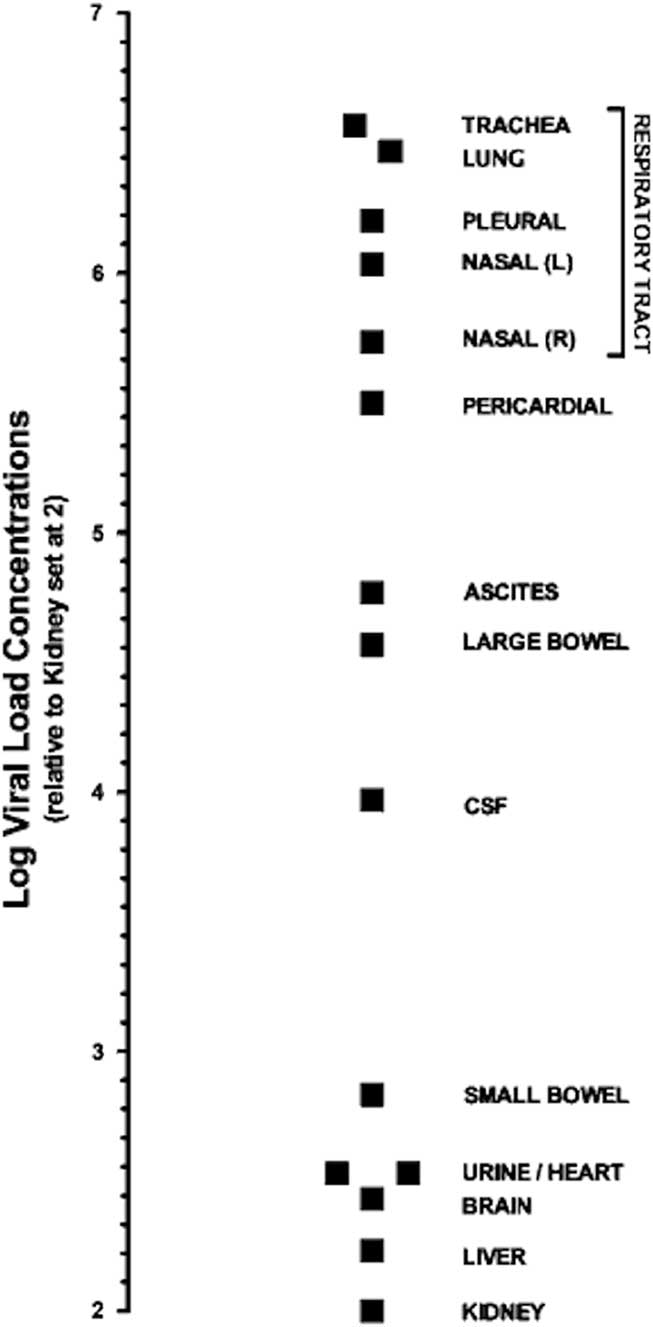
For the 11 patients considered to have adenovirus-consistent symptoms, clinical findings included 45% conjunctivitis alone (n=5), 36% conjunctivitis and LRTI (n=4), 9% LRTI alone (n=1), and 9% conjunctivitis and URTI (n=1). One patient (diagnosed with LRTI alone) died due to autopsy-confirmed adenoviral bronchopneumonia. The relative concentrations of adenovirus were assessed within the relevant tissues at autopsy aiding in the evaluation of specific transmission risk and assessing the cause of death (Fig. 2). The highest concentrations of adenovirus were found in the respiratory tissues, despite the multiorgan nature of the adenovirus type 19 infection. The other cases eventually recovered their clinical baselines.
Respiratory log viral load concentrations relative to other anatomic sites from autopsy tissues of deceased patient. Tissue specific semiquantitative PCRs were performed without flushing of blood from the specimens. The log viral load concentrations are represented relative to those in the kidney.

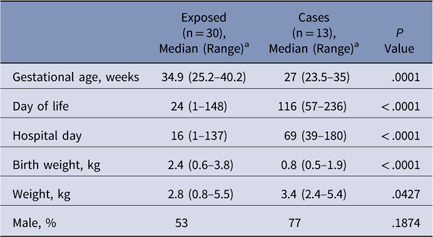
As illustrated in Table 2, the cases and exposed group were significantly different in that cases had younger median gestational ages, longer median duration of hospitalization at outbreak diagnosis and, subsequently, were older by median age at outbreak diagnosis.
Comparison of Uninfected and Infected Groups at Outbreak Identification

a Unless otherwise specified.
All case patients had had an ROP exam in the previous month (13 of 13, 100%), compared to 7 in the exposed group with an ROP exam in the same time period (7 of 30, 23%). The ROP exam in the last month was associated with greater odds of adenovirus infection compared to no ROP examinations (OR, 84.6; 95% CI, 4.5–1,601; P<.0001). Investigation into the sterilization procedure for ophthalmological instruments used for ROP exams revealed that the scleral depressor and blepharostat were brought to the NICU by the consulting ophthalmology team. The instruments were cleaned prior to use and between patients by wiping with alcohol antiseptic wipes, followed by washing with chlorhexidine gluconate solution, rinsing, and drying with paper towels. The instruments were sterilized at the conclusion of all exams.
After the outbreak was identified, the sterilization procedure was changed to require use of separate autoclaved instruments for each exam. Other procedures that remained in place after the end of the outbreak included enhanced enforcement of existing infection control procedures and continued contact and droplet precautions for cases for the duration of their hospitalization.
Laboratory results
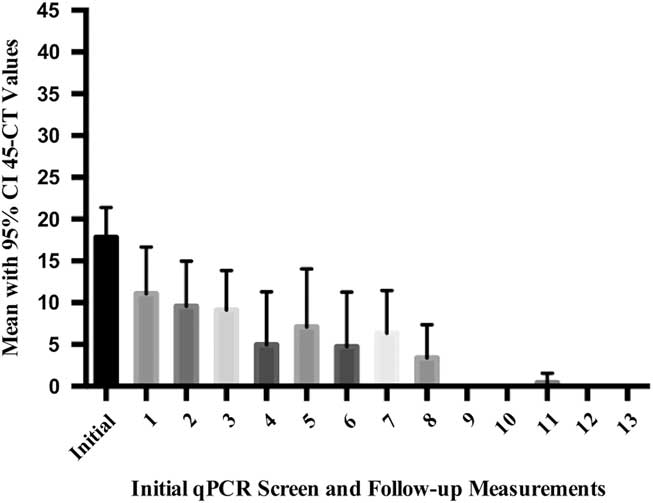
Serial NP qPCR assessments resulted in a total of 213 specimens being collected; 116 were from adenovirus-positive cases. Case patients had a median of 10 specimens obtained per patient (range, 1–14). Case patients were followed with serial NP qPCR studies until they were discharged from the unit (n=7), died (n=1), or remained inpatients whose infections were consistently undetectable (n=5). Of the 7 patients who had at least 1 adenovirus-undetectable specimen, 6 had at least 1 low-level positive specimen after the initial negative specimen. Counting from the date of outbreak identification, the median time to the first negative qPCR specimen was 9 days (range, 2–21 days) and the median time to sustained negativity (no additional positive specimens) was 21 days (range, 9–25 days). Figure 3 depicts the mean CT values of all positive samples at each sampling point during the outbreak response period. Of the 13 patients, 12 had positive viral cultures: 9 patients had type 19 (75%), 2 patients had type 20 (17%), and 1 patient had type 1 (8%) (Fig. 1b).
Discussion
Decisions regarding the duration of infection control procedures for adenovirus are complicated by multiple factors. Prolonged asymptomatic shedding of adenovirus following infection, particularly in infants, is well described, and our findings support this observation.Reference Calkavur, Olukman and Ozturk 3 , Reference Naghipour, Hart and Dove 17 – Reference Kalu, Loeffelholz and Beck 18 Additionally, adenovirus can persist in an infectious form in the environment for extended periods.Reference Hamada, Gotoh and Hara 19 A previously described NICU adenovirus outbreak was complicated by a second wave of cases, which may have been due to inadequate duration of outbreak response procedures.Reference Faden, Wynn and Campagna 6 Based on our hypothesis that the quantity of virus present in a defined population (population viral load) is related to the risk of viral transmission within that population, it is possible that real-time molecular diagnostic data may be a useful adjunct to outbreak response procedures in certain settings (Fig. 3). To our knowledge, our report is the first in the literature describing the use of molecular diagnostic data for adenovirus outbreak monitoring. Serial NP qPCR studies were used to screen for new infections in the exposed group and to monitor the viral clearance trends among cases. The availability of a rapid, reliable, in-house, real-time adenovirus PCR test made this outbreak monitoring approach feasible. After population viral loads declined, and after serial NP qPCR studies of cases remained consistently negative for adenovirus, we hypothesized that the risk of ongoing transmission was low. The outbreak response procedures were stopped and normal infection control procedures were reinstituted and reinforced, including the revisions that were made during the outbreak period: autoclave-sterilized instruments required for ROP exams and continued contact and droplet precautions for cases for the duration of their hospitalization.
The plausible mechanism of transmission via nonsterile ophthalmological instruments, precedents in the literature, predominance of ocular findings, and detection of AV within the upper respiratory secretions in high concentrations relative to other anatomic sites (Figure 2), all implicate ROP exams as the key mode of viral transmission in this outbreak.Reference Asencio-Duran, Romero-Martin and Garcia-Martinez 1 – Reference Percivalle, Sarasini and Torsellini 7 Additionally, the significant differences between the cases and the uninfected group with regard to prematurity, birth weight, age and weight at outbreak diagnosis, and duration of hospitalization may have been driven by the fact that prematurity and low birth weight are the criteria for requiring ROP exams. 20
Population viral load. The vertical axis of this figure shows the mean adenovirus viral load encountered within the entire outbreak investigation. This viral load is represented by the mean 45 minus the CT values of all patients tested at that time point with corresponding 95% confidence intervals. Once patients were discharged from the unit, they were removed from the analysis. The horizontal axis represents the initial qPCR screen at the time of outbreak identification followed by measurements 3 times weekly for the duration of the outbreak response (day 33).

As Figure 1 illustrates, the initial cluster of 5 conjunctivitis cases consisted of a mixed group of adenovirus types, suggesting the possibility of multiple mechanisms or episodes of viral entry into the unit. Such multitype outbreaks have been described in community and outpatient settings.Reference Guyer, O’Day and Hierholzer 21 , Reference Cheung, Bremner and Chan 22 Significantly, the second cluster of cases (occurring after day 11 in Fig. 1b) included only type 19, suggesting transmission from or a common mode of transmission with 1 or both of the earlier type 19 cases. Notably, isolation of the virus from the ophthalmological instruments was not possible due to preceding sterilization, so the hypothesis that ROP exams were the main mode of viral transmission in this outbreak is supported by the available evidence but was not microbiologically proven.
Unfortunately, adenoviruses’ environmental survivability and resistance to common disinfection methods make them particularly suited for transmission via hands or contaminated instruments.Reference Hamada, Gotoh and Hara 19 – Reference Guyer, O’Day and Hierholzer 21 Guidelines for disinfection of ocular equipment have shifted over time, and various germicide disinfectant approaches have been recommended historically. 23 – Reference Woodman, Coats and Paysse 27 However, more recent guidelines from the American Academy of Pediatrics recommend the use of sterile instruments in each ROP examination. 20 A review of the literature supports the recommendation that NICU best practice includes hospital provision of sterile instruments for ROP exams, and insistence on sterile instruments for each exam.Reference Hered 28 This recommendation can be met either by use of presterilized, single-use instruments or through heat sterilization of heat-stable instruments between uses.Reference Rutala 24 In light of our outbreak experience and review of the literature, our institution now uses heat-sterilized instruments for each exam and other components of best practice in the conduct of ROP examinations.
This adenovirus outbreak is a sobering reminder that our modern NICUs can still fall prey to a type of outbreak that was well described more than 20 years ago. We hope that describing our experience will prompt pre-emptive evaluation of potential modes of adenovirus transmission, including ROP exam procedures, in other NICUs. In our experience, real-time molecular diagnostic data helped guide outbreak response procedures that contained and fully terminated the outbreak, and we recommend consideration of the role of quantitative molecular diagnostic studies including population viral loads in the management of future adenovirus outbreaks. (Figure 3)
Acknowledgments
Financial support
No financial support was provided relevant to this article.
Conflicts of interest
All authors report no conflicts of interest relevant to this article.