Implications
Developing an alternative method to predict dry matter intake (DMI) in grazing lactating beef cows using non-invasive animal measurements may provide a cheaper, faster and more convenient way to estimate DMI. Dry matter intake estimates are a requirement for determining feed efficiency. A prediction model such as the one presented could make determining feed efficiency of beef cows easier. Improving feed efficiency could increase profitability.
Introduction
Feed costs are the largest factor impacting the profitability of beef production, accounting for over 75% of direct expenses (Finneran et al., Reference Finneran, Crosson, O’Kiely, Shalloo, Forristal and Wallace2010). In calf-to-beef production systems 66% of the total energy required is consumed by the cow (Murphy et al., Reference Murphy, Drennan, O’Mara and McGee2008). Selective breeding for feed efficiency would require feed intake estimates for a large number of animals. The biggest boundary to achieving these estimates is the difficultly and cost associated with estimating DMI of cows at pasture (Berry and Crowley, Reference Berry and Crowley2013). The difficulties associated with measuring DMI are directly associated with the environment where the measurements are recorded. Measuring DMI for cattle in confinement is substantially easier than for grazing cattle because of the availability of equipment capable of accurately and automatically collecting feed data. Methods to accurately estimate individual DMI of grazing animals tend to be marker techniques (Smit et al., Reference Smit, Taweel, Tas, Tamminga and Elgersma2005). Such techniques are only suitable under research conditions. The n-alkane technique is a marker technique frequently used to estimate DMI in grazing cattle. It facilitates the measurement of DMI while enabling cows to graze normally (Wright et al., Reference Wright, Lewis, Garry, Galvin, Dunshea, Hannah, Auldist, Wales, Dillon and Kennedy2019). Nonetheless, it is impractical for large-scale projects and on commercial farms due to the cost and labour-intensive nature of the technique.
Studies have attempted to predict DMI and efficiency from a range of individual animal measurements with varying results (Nkrumah et al., Reference Nkrumah, Crews, Basarab, Price, Okine, Wang, LI and Moore2007; Montanholi et al., Reference Montanholi, Swanson, Palme, Schenkel, McBride, Lu and Miller2010; Huntington et al., Reference Huntington, Cassady, Gray, Poore, Whisnant and Hansen2012). Skin surface temperatures of multiple body parts measured by infrared thermal imaging (IRT) have shown associations with feed efficiency in steers, where animals with a lower surface temperature had a lower residual feed intake (RFI; Montanholi et al., Reference Montanholi, Swanson, Palme, Schenkel, McBride, Lu and Miller2010). Similarly Huntington et al. (Reference Huntington, Cassady, Gray, Poore, Whisnant and Hansen2012) found that the surface temperature of the rib area in bulls was positively associated with DMI, average daily gains and negatively associated with RFI.
Feeding behaviour and feeding duration have shown positive associations with DMI in beef cattle in a feedlot environment (Nkrumah et al., Reference Nkrumah, Crews, Basarab, Price, Okine, Wang, LI and Moore2007), and with the advent of new technology, such as RumiWatchSystem recorders (Itin + Hoch GmbH, Liestal, Switzerland), measuring feeding behaviour at pasture is becoming more readily achievable (Werner et al., Reference Werner, Leso, Umstatter, Niederhauser, Kennedy, Geoghegan, Shalloo, Schick and O’Brien2018). High intake capacity has previously been associated with larger gastrointestinal tracts per BW in dairy cows (Beecher et al., Reference Beecher, Buckley, Waters, Boland, Enriquez-Hidalgo, Deighton, O’Donovan and Lewis2014). Therefore, physical differences in body measurements may offer potential as proxy measurements for rumen capacity, as suggested by Prendiville et al. (Reference Prendiville, Lewis, Pierce and Buckley2010).
Our hypothesis was that a combination of non-invasive animal measurements could be used to indirectly predict DMI. This is in contrast to previous studies that examined the ability of individual animal measurements to predict DMI (Huntington et al., Reference Huntington, Cassady, Gray, Poore, Whisnant and Hansen2012; Montanholi et al., Reference Montanholi, Swanson, Palme, Schenkel, McBride, Lu and Miller2010; Nkrumah et al., Reference Nkrumah, Crews, Basarab, Price, Okine, Wang, LI and Moore2007). The objective of the study was 1) to develop a model to predict the DMI of lactating beef cows using multiple animal measurements including grazing behaviour, body measurements, linear type scoring and thermal imaging and 2) to validate any developed model on an independent herd of lactating beef cows.
Materials and methods
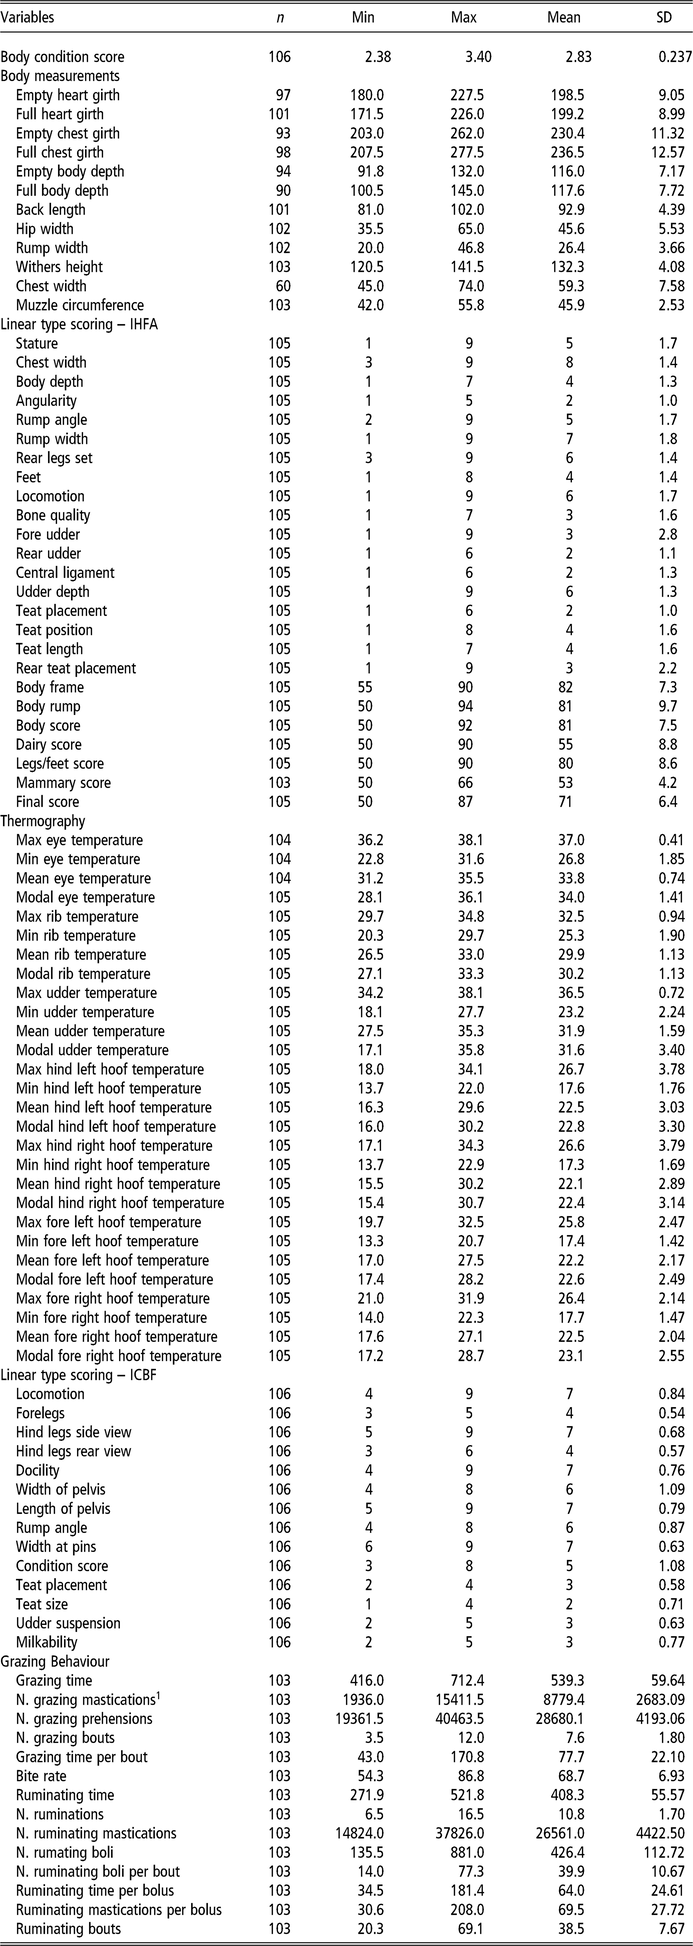
Initial measurements were conducted in 2015 on a herd of 106 lactating cows at Teagasc Grange Beef Research Centre, Co. Meath, Ireland (calibration dataset). The herd comprised cows of dairy and beef maternal origin, sired by Aberdeen Angus or Limousin bulls (McCabe et al., Reference McCabe, McHugh and Prendiville2017). The cows represented two genotypes (high and low Replacement index). The Replacement Index is published by the Irish Cattle Breeding Federation (ICBF) to assist beef producers in breeding decisions where the objective is to retain female offspring as replacement heifers and sell surplus female and male calves for beef production (www.icbf.com). The high index group had a Replacement Index value of €112 and the low index group had a Replacement Index value of €57 (McCabe et al., Reference McCabe, McHugh and Prendiville2017). Twenty-four cows were primiparous and the remainder in their second lactation, with a mean calving date of 17 March. The herd was managed under a rotational grazing system on a predominantly perennial ryegrass (Lolium perenne) sward. Ninety-four measurements in nine categories were recorded on all cows during lactation (Table 1).
Descriptive statistics associated with all variables available for analysis in the calibration dataset, recorded on cows in 2015

IHFA = Irish Holstein Friesian Association; ICBF = Irish Cattle Breeding Federation.
1 N = number.
A second study incorporating the same measurements was conducted in 2017 to validate the findings from 2015 (validation dataset). This study was conducted on an independent herd of 60 beef cows, at Teagasc Grange Beef Research Centre. The herd structure was similar to the original study (Woods et al., 2016), with a mean calving date of 14 March. The herd was managed under a rotational grazing system on a predominantly perennial ryegrass (Lolium perenne) sward.
Dry matter intake, body weight and body condition score
Individual DMI estimates for all cows were carried out using the n-alkane technique (Mayes et al., Reference Mayes, Lamb and Colgrove1986) modified by Dillon and Stakelum (Reference Dillon and Stakelum1989), three times during lactation in 2015 (56, 123 and 190 days in milk [DIM]). In 2017, individual DMI estimates were recorded for all cows twice (96 and 187 DIM) using the same technique. Body weight was recorded for all cows in 2015 and 2017 using a calibrated ‘Titan Weigh Crate’ (O’Donovan’s Engineering, Cork, Ireland) combined with Tru-Test software (Tru-Test Ltd., Auckland, New Zealand) every three weeks during the experimentation period. Body condition scores (BCS) were recorded concurrently by one trained observer (Lowman et al., Reference Lowman, Scott and Somerville1976).
Milk yield
Milk yield was estimated for all cows on three occasions in 2015 (50, 117 and 184 DIM), and on two occasions in 2017 (90 and 181 DIM) using the weigh-suckle-weigh technique, similar to that described by McGee et al. (Reference McGee, Drennan and Caffrey2005). In the afternoon prior to milk estimations, cows and calves were separated and muzzles were fitted to each calf. Cows and calves were returned to the paddock, where they remained until the next morning (15 h approx.). Cows and calves were separated, all muzzles were removed and calves were weighed. Calves were returned to their respective cows and allowed to suckle. Cows and calves were observed while suckling. Calves were weighed again before all muzzles were reattached. Cows and calves were returned to the paddock until 3 pm (7 h approx.) when the procedure was repeated. Differences in calf BW during morning and afternoon estimates were combined to estimate daily milk yield. Three 24 h estimations were carried out for each cow on three consecutive days. Milk yield was calculated as the average of these measurements. Where a cow was not fully suckled or a calf had lost a muzzle the data were excluded from the analysis.
Body measurements
Body measurements were recorded for all cows in 2015, once after cows had been held inside without access to food for 4 h (empty measurement, 150 DIM) and once after grazing ad libitum grass (full measurement, 169 DIM). The same measurements were repeated in 2017 at 96 and 187 DIM (full measurements) and at 84 and 210 DIM (empty measurements). Nine body measurements were taken at the time of the full measurement. These measurements included; heart girth, chest girth, body depth, back length, hip width, rump width, chest width, wither height and muzzle circumference. Only heart girth, chest girth and body depth measurements were recorded at the empty measurements. The method used to record each measurement was similar to that described by Alphonsus et al. (Reference Alphonsus, Akpa and Oni2009) and as follows: heart girth was measured as the body circumference behind the point of the elbow, shoulders and withers; chest girth was measured as the body circumference at the last rib; body depth was measured as the distance between the spine of the back and the shallowest point of the floor of the chest; back length was measured as the horizontal distance from between the hips to the top of the withers; hip width was measured as the highest point of the left hip to the highest point of the right hip; rump width was measured as the distance between the most outer bones of the right and left pin bones; chest width was measured as the distance between the top of the right front leg and the top of the left front leg; wither height was measured as the distance from the ground to the highest point of the withers; muzzle circumference was measured as the circumference directly behind the muzzle. Where a cow became agitated, the measurement was stopped and attempted at a later date.
Linear type scoring
Cows were linear type scored by ICBF once each year; 2015 (114 DIM) and 2017 (209 DIM) and once each year by the Irish Holstein Friesian Association (IHFA); 2015 (134 DIM) and 2017 (210 DIM) in accordance with their respective protocols (Irish Cattle Breeding Federation, 2002; Irish Holstein Friesian Association, 2016). The ICBF scored locomotion, forelegs, hind legs (rear and side view), docility, width of pelvis, length of pelvis, rump angle, width at pins and condition score on a scale of 1–10. They also scored teat placement, teat size, udder suspension and milkability on a scale of 1–5 (poor to excellent) (ICBF, 2002).
The IHFA recorded cow stature, chest width, body depth, angularity, rump angle, rump width, rear legs set, feet, locomotion, bone quality, fore udder, rear udder, central ligament, udder depth, teat placement, teat position, teat length, rear teat placement on a scale of 1–9. Body frame, body rump, body score, dairy score, legs/feet score, mammary score and final score were scored on a scale of poor to excellent (IHFA, 2016).
Thermography
Infrared thermal images were captured for all cows on two occasions in 2015 (150 and 168 DIM) and in 2017 on two occasions (108 and 196 DIM) using a portable FLIR T430sc thermal camera (FLIR Systems Inc., Stockholm, Sweden) as described by Byrne et al. (Reference Byrne, Berry, Esmonde and McHugh2017). All imaging was carried out in a covered shed without direct sunlight. Prior to the imaging, cows were given 30 min to acclimatise to the holding area. The cows were not handled during this period. All images were taken from the left side of the cow by the same operator. Images of each cow’s eye, ribs, udder, fore and hind hooves were taken from a distance of 1.25, 2, 1.5, 2 and 1 m, respectively. To ensure consistency for all images, distances were measured and marked prior to the capture of the first image. Three images of each body part were captured to ensure reliability of the measure (Byrne et al., Reference Byrne, Berry, Esmonde and McHugh2017).
The images were analysed using the ThermoVision LabVIEW toolkit 3.3 (FLIR Systems Inc.). All images were adjusted for emissivity, ambient temperature, humidity, distance and reflected temperature before analysis. Images were cropped to a predetermined area by one user (Byrne et al., Reference Byrne, Berry, Esmonde and McHugh2017), minimum, maximum, mean and modal temperatures were extracted from these cropped images.
Grazing behaviour
Grazing behaviour was recorded for all cows on two occasions in 2015 (159 and 177 DIM). Cows were fitted with Institute of Grassland and Environmental Research (IGER) behaviour recorders (Rutter et al., Reference Rutter, Champion and Penning1997) for two separate 24 h periods. For consistency, all recorders were fitted in the morning and cows were allocated a 24 h grazing block while the monitors were attached. Usable jaw movement recordings (n = 186 [corresponding to 103 cows]) were analysed using graze analysis software (Rutter, Reference Rutter2000).
In 2017, grazing behaviour was recorded for each cow over two 48 h periods (98 and 189 DIM) using RumiWatchSystem. The RumiWatchSystem was used in place of the IGER recording system. The technology has been evaluated against visual observation and validated in a grazing system by Werner et al. (Reference Werner, Leso, Umstatter, Niederhauser, Kennedy, Geoghegan, Shalloo, Schick and O’Brien2018).
Statistical analysis
All statistical analyses were completed using SAS 9.4 (SAS Institute Inc., Cary, NC, USA). All files containing variables were merged and where multiple measurements were available, averages were calculated. Cow was the experimental unit for this analysis. Maternal origin was the only classification variable in the model, it was coded as a dummy variable where zero signified the cow was a beef cow and one signified a beef–dairy crossbred cow. Descriptive statistics and normality checks were performed for each independent variable using SAS PROC MEANS and SAS PROC UNIVARIATE. No variable required transformation. Outlying values were examined and one cow was removed from the calibration dataset due to an abnormally high full heart girth measurement.
Using the calibration dataset, the relationship between each independent variable and DMI was investigated using SAS PROC CORR and SAS PROC SGPLOT. This established the strength and direction of the associations. A regression model including energy sinks (milk yield, BW) and adjustment variables (maternal origin, parity, calving day, sire breed and index group) was initially constructed using SAS PROC REG to establish the effects of these variables on DMI (dependent variable). Sire breed and index group were removed from further analysis as they did not have a significant effect on DMI (P = 0.58 and 0.24, respectively), supported by previous research (Steen, Reference Steen1995; McCabe et al., Reference McCabe, McHugh and Prendiville2017). Parity was retained in the model regardless of P-value, as it is a biological plausible adjustment variable and average milk yield was retained in the model as it showed a tendency towards significance. This model; milk yield, BW, maternal origin, calving day and parity will henceforth be referred to as the primary model. The effects of parity on DMI have been described by Berry et al. (Reference Berry, Veerkamp and Dillon2006).
Multivariable linear regression models were constructed using SAS PROC REG to access the association between DMI and each variable of interest (screening step). Models included DMI as the dependent variable, energy sinks and adjustment variables (milk yield, BW, maternal origin, calving day and parity) and one variable of interest. At this point, only cows with values for all variables were included in the analysis. Variables of interest with P < 0.25 were incorporated into a backward linear regression model using SAS PROC REG. Variables were retained in this model where P < 0.05, with the exception of adjustment variables and energy sinks which were forced into the model. This model was repeated to incorporate the maximum number of cows (cows with values for all the independent variables retained in the model). Multicollinearity between independent variables in the final model was investigated using variance inflation factors and the intercept adjusted condition index (Mason and Perreault, Reference Mason and Perreault1991) and found not to be a problem. The model assumptions; linearity, normality, homoscedasticity were assessed using SAS PROC UNIVARIATE and PROC SGPLOT. There was no concern for departures from these assumptions. The R 2 was used to estimate the proportion of DMI explained by the final model. The relationship between observed and predicted DMI was examined using SAS PROC GPPLOT.
The primary and final prediction models developed using the calibration dataset were applied to the animal records collected during 2017 (n = 60). The association between the predicted and observed DMI was assessed using regression analysis in SAS PROC REG. The predictability and robustness of the model was assessed using the R 2, regression coefficient (slope of the regression line), average bias, root mean square error (RMSE) and relative prediction error (RPE) (Fuentes-Pila et al., Reference Fuentes-Pila, Delorenzo, Beede, Staples and Holter1996). The relationship between observed and predicted DMI was examined using SAS PROC GPLOT.
Results
Model calibration
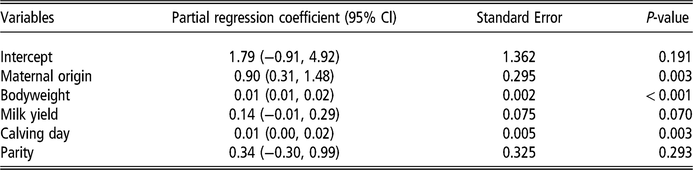
The primary linear regression model containing adjustment variables (parity, maternal origin and calving day) and known energy sinks (milk yield and BW) yielded an R 2 of 0.45 (Table 2). Calving day, BW and maternal origin had P-values significant at α = 0.05. Milk yield showed a tendency towards significant (P = 0.07) and was retained in the model. The primary linear regression model developed was:
 $$DMI = {\hat \beta} _0} + { {\hat \beta} _1}\left( {Origin} \right) + {{\hat \beta} _2}\left( {BW} \right) + {\hat \beta _3}\left( {MY} \right) + {\hat \beta _4}\left( {Calving day} \right) + {\hat \beta _5}\left( {Parity} \right)$$
where
 ${\hat \beta}_0$
is the estimated intercept (1.79) and
 ${\hat \beta}_{1 - 5}$
are the estimated partial regression coefficients of maternal origin (0.90), BW (0.01), milk yield (0.14), calving day (0.01) and parity (0.34).
Variables, partial regression coefficients (95% confidence interval (CI)), standard errors and P-values associated with the primary model to predict dry matter intake in lactating beef and dairy crossbred beef cows (R 2 = 0.29, RMSE = 1.78, RPE = 0.13)

RMSE = Root mean square error; RPE = Relative prediction error.
Parameter estimates showed an increase of 0.9 kg DMI in cows of dairy maternal origin compared with cows of beef maternal origin. Parity did not have a significant association with DMI but was retained in the model as a biologically plausible adjustment variable.
Of 94 variables investigated in multivariable regression models (screening step), 32 had P < 0.25. These variables were BCS, body measurements (full chest girth, empty body depth, full body depth, rump width and withers height), IHFA linear type scoring (rump width, feet, central ligament, rear teat placement, dairy score, mammary score and final score), thermal imaging (minimum, maximum, average and modal rib temperature, average udder temperature, maximum, average and modal left back hoof temperature, and maximum, average and modal right back hoof temperature), ICBF linear type scoring (width of pelvis, width at pins and teat size) and grazing behaviour (grazing time, number of grazing prehensions, ruminating mastications and ruminating mastications per bolus). All other variables were removed from further analysis.
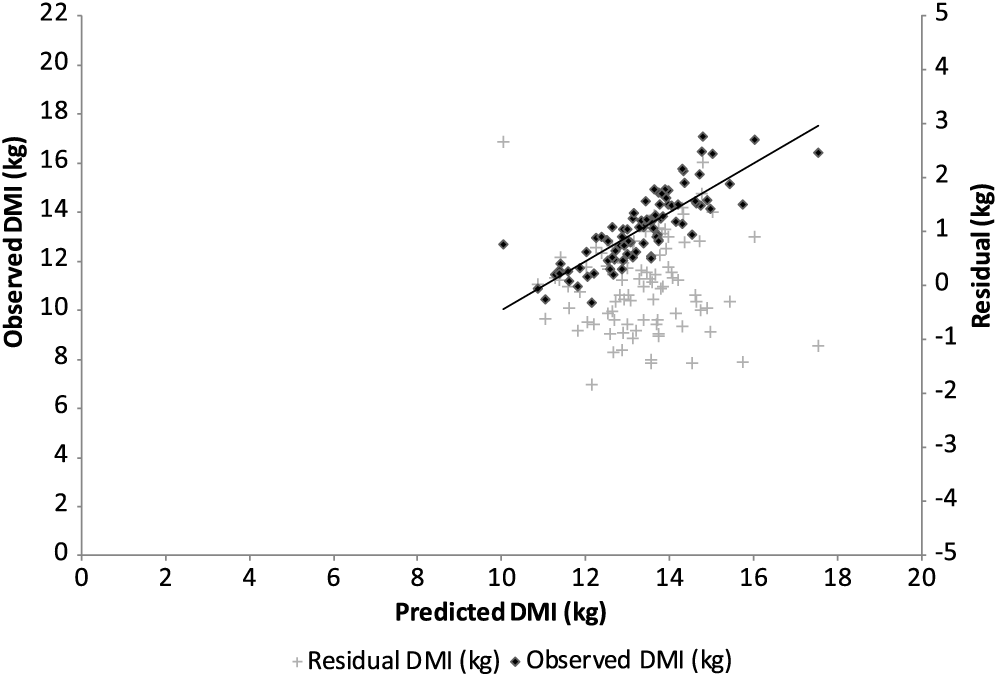
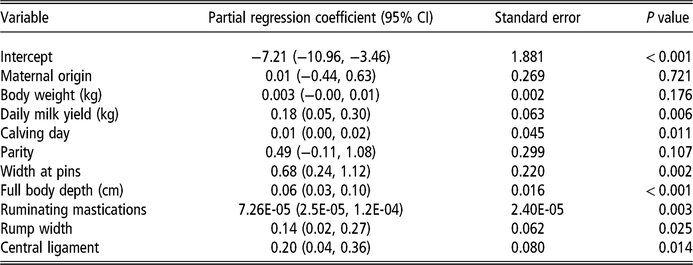
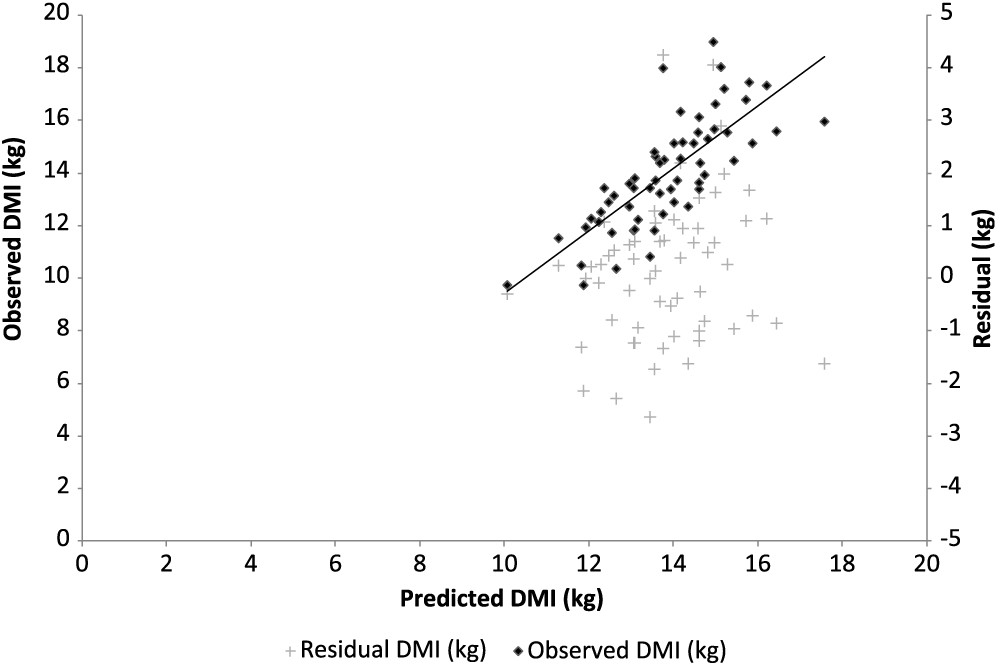
The model resulting from the backward linear regression incorporated 73 cows (cows with observations for all 32 variables that passed the screening step) and included width at pins, central ligament, width at rump, full body depth and ruminating mastications in addition to the primary model variables (Table 2). When the number of cows in the model was maximised (n = 88, all cows with observations for the variables in the final model), the parameter estimates and P-values were virtually unchanged (Table 3). This model had an R 2 of 0.68, representing a 0.23 increase in the predictability of DMI (R2) between the primary model and final model (Tables 2 and 3). The relationship between the observed and predicted values of DMI is presented in Figure 1. The prediction model developed was:
 $$\eqalign{ DMI = {\mathop \hat\beta _0} + {\mathop \hat \beta _1}\left( {Origin} \right) + {\hat \beta _2}\left( {BW} \right) + {\hat \beta _3}\left( {MY} \right) \cr + {\hat \beta _4}\left( {Calving day} \right) \cr+ {\hat \beta _5}\left( {Parity} \right) + {\hat \beta _6}\left( {WAP} \right) + {\hat \beta _7}\left( {FBD} \right) + {\hat \beta _8}\left( {RM} \right) \cr+ {\hat \beta _9}\left( {RW} \right) + {\hat \beta _{10}}\left( {CL} \right) \cr} $$
where
 ${\hat \beta}_0$
is the estimated intercept (-7.21) and
 ${\hat \beta}_{1 - 10}$
are the estimated partial regression coefficients of maternal origin (0.10), BW (0.003), milk yield (0.18), calving day (0.01), parity (0.49), width at pins (0.68), full body depth (0.061), ruminating mastications (0.00007), rump width (0.14) and central ligament (0.20) (see Table 3).
The relationship between the observed dry matter intake (DMI) of the lactating beef and beef-dairy cows and DMI predicted by the final model (maternal origin, body weight, daily milk yield, parity, width at pins, full body depth, ruminating mastications, rump width and central ligament) and the residual DMI for the cows in the calibration dataset.

Variables, partial regression coefficients (95% confidence interval (CI)), standard errors and P-values associated with the final model developed to predict dry matter intake in lactating beef and dairy crossbred beef cows (R 2 = 0.59, RMSE = 1.37, RPE = 0.10)

RMSE = Root mean square error; RPE = Relative prediction error.
Independent validation
The primary and final prediction models developed (outlined above) using the 2015 calibration dataset were applied to the independent validation dataset collected in 2017 to predict DMI. The primary model predicted DMI of the independent dataset with an R 2 of 0.29. The estimated regression coefficient for the model of actual DMI on predicted DMI using the primary model was 0.58 (standard error [SE] = 0.12). The primary model resulted in: average bias = –0.50, RMSE = 1.78 and RPE = 0.13. The final model predicted DMI of the validation dataset with an R 2 of 0.59. The estimated regression coefficient for the model of actual DMI on predicted DMI was 1.19 (SE = 0.13). The relationship between the observed and predicted DMI in the independent validation set is presented in Figure 2. The final model resulted in: average bias = 0.15, RMSE = 1.37 and RPE = 0.10.
The relationship between the observed dry matter intake (DMI) of the lactating beef and beef-dairy cows and DMI predicted by the final model (maternal origin, body weight, daily milk yield, parity, width at pins, full body depth, ruminating mastications, rump width and central ligament) and the residual DMI for the cows in the validation dataset.

Discussion
The objective of this study was to explore the potential to develop and validate a model to predict DMI in grazing lactating beef cows using a combination of non-invasive body measurements. Such a model could potentially be routinely utilised to capture the phenotypes required for genetic evaluations of feed intake and efficiency. Associations between DMI, grazing behaviour, thermal imaging, body measurements and linear type scoring were examined using linear regression. All of the measurements recorded in this study were expected to influence DMI, based on previous research (Nkrumah et al., Reference Nkrumah, Crews, Basarab, Price, Okine, Wang, LI and Moore2007; Huntington et al., Reference Huntington, Cassady, Gray, Poore, Whisnant and Hansen2012; Montanholi et al., Reference Montanholi, Swanson, Palme, Schenkel, McBride, Lu and Miller2010). However, in some cases the anticipated effects were extrapolated from dairy cows or growing beef animals rather than lactating beef cows, so it is not surprising that some measurements did not show a significant association with DMI in the current study. The results of the final model indicated that ruminating mastications, full body depth, width at pins, rump width and central ligament in addition to BW, milk yield, calving day, parity and maternal origin (dairy or beef) increase the predictability of DMI.
Milk yield, body weight, maternal origin, calving day and parity
Prior to the development of the final model, milk yield, BW, parity, calving day and maternal origin were incorporated into a primary model. These variables were included in all further models (screening step and final model) as known energy sinks (milk yield and BW) and adjustment variables (parity, calving day and maternal origin) as it was anticipated that they would influence DMI. All variables in this model showed a positive association with DMI with an R 2 as expected based on equations with similar variables in dairy cows (Fuentes-Pila et al., Reference Fuentes-Pila, Delorenzo, Beede, Staples and Holter1996; Zom et al., Reference Zom, André and van Vuuren2012). A 100 kg increase in BW was associated with a 1.3 kg increase in DMI, and a 1 kg increase in daily milk yield was associated with a 0.138 kg increase in DMI. Increased DMI has previously been associated with heavier and higher milk yielding cows, likely due to the increased energy required to maintain their size and milk production (Fuentes-Pila et al., Reference Fuentes-Pila, Delorenzo, Beede, Staples and Holter1996). Maternal origin had a significant effect on DMI with beef-dairy crossbred cows consuming an additional 0.9 kg of DMI per day compared with beef cows; this may be explained by the greater intake associated with dairy breeds (Buckley et al., Reference Buckley, Holmes, Keane and Murphy2005) and the increased milk yield of the beef-dairy cow (McCabe et al., Reference McCabe, McHugh and Prendiville2017). A one-day increase in calving day was associated with a 0.01 kg increase in DMI. Based on previous literature (Berry et al., Reference Berry, Veerkamp and Dillon2006), it was anticipated that parity would have a positive effect on DMI due to increasing cow size and milk yield potential. Although not statistically significant, likely due to all cows being in their first or second lactation, increased parity was associated with a numeric increase in DMI. The significance of the known energy sinks and adjustment variables changed between the primary model and the final model. Body weight and maternal origin did not have a statistically significant impact on DMI in the final model. This was likely related to correlations between body weight and the linear type scoring and body measurements included in the final model, however, multicollinearity was assessed and found not to be a problem.
Maternal origin, calving day and parity are details routinely available to commercial beef farmers making them straightforward to incorporate into a DMI prediction model. Body weight can be easily recorded on commercial beef farms on a regular basis using commercially available scales. A difficulty posed by the current model at a commercial farm level is the inclusion of the energy sink; milk yield. For the purpose of estimating milk yield, the weigh-suckle-weigh technique was employed. This time-consuming technique is impractical at commercial farm level. During this study, it involved six milk yield estimations per cow over three days, by means of separating and weighing calves four times a day. Calf weight, previously found to have a high correlation to milk yield, could be included in future models as a proxy for milk yield. The calf weights taken as part of the milk yield estimations in this study have correlations with milk yield of between 0.34 and 0.46 (Pearson correlation coefficient). This was not high enough to include calf weight in the model as a proxy for milk yield without compromising the R 2. However, pre-weaning calf weights (237 ± 10 days) have previously shown high correlations (0.76) with milk yield as measured by the weigh-suckle-weigh technique (Beal et al., 1990). The calf weights recorded prior to and at weaning in this study, at 204 and 225 days old, respectively, did not have a high correlation with average daily milk yield. The correlations of these weights with milk yield were 0.41 and 0.31, respectively. Further investigation into the relationship between calf weight and milk yield is warranted and may provide an alternative variable to be included in this model.
Grazing behaviour
Ruminating mastications recorded by IGER behaviour recorders in 2015 and RumiWatchSystem recorders in 2017 were retained in the final model. Both IGER behaviour recorders and RumiWatchSystem recorders were validated against visual observation (Rutter et al., Reference Rutter, Champion and Penning1997; Werner et al., Reference Werner, Leso, Umstatter, Niederhauser, Kennedy, Geoghegan, Shalloo, Schick and O’Brien2018). Each 1000-unit increase in ruminating mastications was associated with a 0.07 kg increase in DMI. Ruminating mastications per 100 kg BW had previously been positively associated with intake capacity and milk solids per 100 kg BW in dairy cows (Prendiville et al., Reference Prendiville, Lewis, Pierce and Buckley2010). Increased ruminating mastications would likely decrease particle size, which has been associated with improved movement through the rumen and increased feed intake (Martz and Belyea, Reference Martz and Belyea1986). Pahl et al. (Reference Pahl, Hartung, Grothmann, Mahlkow-Nerge and Haeussermann2016) found that feeding and chewing behaviour could be used to estimate feed intake in dairy cows and Montanholi et al. (Reference Montanholi, Swanson, Palme, Schenkel, McBride, Lu and Miller2010) found that meal size and eating rate were highly correlated with DMI in beef steers. Given both of these studies were conducted in indoor feeding systems, they are not directly comparable to beef cows in a grazing system. However, there is a lack of comparable data available from grazing studies. The ease of measuring grazing behaviour on commercial farms is increasing. When this study began, IGER behaviour recorders were used in the first year to measure grazing behaviour of individual cows. This technology had a maximum recording time of 24 h, before information needed to be downloaded and batteries charged. This procedure was laborious and problematic. The RumiWatchSystem, a modern replacement, has become available since and it was used for the remainder of the study. The RumiWatchSystem has been validated for grazing and ruminating time as well as grazing bites, ruminating mastications and ruminating boli in a grazing system, and with a longer recording time it is more suitable for a commercial environment (Werner et al., Reference Werner, Leso, Umstatter, Niederhauser, Kennedy, Geoghegan, Shalloo, Schick and O’Brien2018). Additionally, technology currently available for heat detection and health monitoring on commercial farms, such as the MooMonitor + (Dairymaster, Causeway, Co. Kerry, Ireland), already have the capacity to record feeding, ruminating and resting times. Further advances in this type of technology could make recording grazing and ruminating behaviours more accessible in the future.
Body measurements and linear type scoring
It was hypothesised that body measurements could be used as a non-invasive proxy measurement for rumen capacity. Allen (Reference Allen1996) reported that voluntary DMI may be limited by distention caused by restricted digesta flow through the gastrointestinal tract, and Beecher et al. (Reference Beecher, Buckley, Waters, Boland, Enriquez-Hidalgo, Deighton, O’Donovan and Lewis2014) found that Jersey cows with higher intake capacity had larger gastrointestinal tracts when expressed as a proportion of BW. Therefore, it was not surprising that measurements associated with the cow’s girth were associated with increases in DMI. A one-centimetre increase in full body depth was associated with a 0.0641 kg increase in daily DMI. A larger gastrointestinal tract would allow for greater gut fill and result in high DMI. Full body depth as measured in this study may represent the capacity of the gastrointestinal tract as cows had grazed ad libitum grass immediately prior to the measurement. Body measurements and linear type scoring could be easily undertaken on commercial farms as the only equipment required is a flexible measuring tape in addition to the scoring guidelines which are available from the respective associations. Through the continued advancements in on-farm technology, such as automatic body condition scoring equipment, achieving body measurements of lactating beef cows may become even easier (Azzaro et al., Reference Azzaro, Caccamo, Ferguson, Battiato, Farinella, Guarnera, Puglisi, Petriglieri and Licitra2011). Width at pins scored by ICBF showed a positive association with DMI, with a one-unit increase in width associated with a 0.68 kg increase in DMI. Rump width measured by the IHFA was also positively associated with DMI where a one-unit increase was associated with a 0.14 kg increase in DMI.
The inclusion of central ligament (the depth of the udder cleft) as measured by IHFA in the model may be explained as representing an increased dairy influence, and therefore a greater milk yield potential leading to increased intake. Central ligament has previously been positively associated with milk yield, milking time and milking duration in Jersey cows (Erdem et al., Reference Erdem, Atasever and Kul2010). Each one-unit increase in central ligament was associated with a 0.20 kg increase in DMI.
Thermal imaging
No thermal imaging variables remained in the final model developed in this study. During the screening step, eleven variables (including min, max and mean rib) were retained to be incorporated into the final model. There were no published studies where IRT had been used to predict DMI in grazing beef cows. However, a study conducted by Huntington et al. (Reference Huntington, Cassady, Gray, Poore, Whisnant and Hansen2012) found an association between DMI and the min, max and mean temperature of the rib area in Angus bulls, similar to the results of the screening step in the present study. Measuring IRT on commercial farms is difficult as cows need to remain still as the images are captured and cannot be handled immediately prior to imaging. Other potential issues that have been highlighted surrounding the use of IRT are the variation between operators and the need to capture three images of each body part to maximise accuracy (Byrne et al., Reference Byrne, Berry, Esmonde and McHugh2017).
Accuracy and application of the model
Previously, studies have focused on predicting DMI and efficiency during the intensive finishing period (Montanholi et al., Reference Montanholi, Swanson, Palme, Schenkel, McBride, Lu and Miller2010; Huntington et al., Reference Huntington, Cassady, Gray, Poore, Whisnant and Hansen2012) rather than in lactating beef cows. This is possibly due to the high-cost concentrate used in the finishing period or the increased feasibility associated with measuring feed intake in growing animals compared to mature cows. However, in a grass-based system where the emphasis has turned to increasing grass production and utilisation, as a cheap feed source, redirecting focus from increasing efficiency in the finishing period to improving cow efficiency may offer further gain. The beef cow remains in the herd for a much longer period and consumes 66% of the energy required for beef production (Murphy et al., Reference Murphy, Drennan, O’Mara and McGee2008). Increasing feed efficiency at this point in the production chain could greatly increase profitability for producers.
The final model developed in this study was used to predict DMI for an independent herd of beef and beef–dairy crossbred cows two years after the original data were generated. The final model presented provides a modestly robust and accurate prediction of DMI in lactating beef cows, as indicated by RMSE, RPE and R 2. When the results of the present study were compared to the prediction models for DMI in lactating dairy cows presented by Zom et al. (Reference Zom, André and van Vuuren2012) (RMSE 2.53 to 5.52, RPE 0.08 to 0.10, R 2 0.35 to 0.77) and Fuentes-Pila et al. (Reference Fuentes-Pila, Delorenzo, Beede, Staples and Holter1996) (RMSE 2.10 to 4.00, RPE 0.11 to 0.22, R 2 0.32 to 0.79) in non-grazing systems, the model produced in the present study performed equally as well as the best equations presented by either of these studies. It must be acknowledged that the datasets used for developing and validating this final model are relatively small; n = 88 and n = 60, respectively. This is due to the complexity and breadth of the measurements recorded. Given the reduced number of measurements in the final model, it may be advisable to validate with greater numbers prior to implementation at commercial farm level. In addition to validating the model on a larger number of cows, the general on-farm applicability on the model may be improved through simplification of the measurements, particularly ruminating mastications and milk yield. Heat detection technology currently available for use on commercial farms is capable of recording grazing and ruminating times (MooMonitor + , Dairymaster Causeway, Co. Kerry, Ireland). Further technological advances in similar management tools may incorporate more detailed grazing and ruminating traits, such as ruminating mastications. As previously discussed calf weight has been shown to be highly correlated with milk yield, increasing the frequency of calf weight recording in a further validation study may identify a suitable replacement for cow milk yield.
The variables included to represent milk yield and DMI are estimates rather than direct measurements. This is due to the complexity of directly measuring these traits in grazing lactating beef cows. Acknowledging the correlation between DMI estimated using the n-alkane technique and directly measured DMI is not one, the n-alkane technique has been shown to be sufficiently accurate (Smit et al., Reference Smit, Taweel, Tas, Tamminga and Elgersma2005; Wright et al., Reference Wright, Lewis, Garry, Galvin, Dunshea, Hannah, Auldist, Wales, Dillon and Kennedy2019). Particularly in perennial ryegrass swards with low levels of weed infestations such as those used in the present study (Smit et al., Reference Smit, Taweel, Tas, Tamminga and Elgersma2005). Estimating milk yield using the weigh-suckle-weigh technique, although not a direct measurement is considered the most prudent method of estimating milk yield in beef cows (McGee et al., Reference McGee, Drennan and Caffrey2005). Nonetheless, these estimated measures (DMI and milk yield) are likely to increase the residual variation in the model. One alternative to increase the accuracy of the model would be to include accurate data on feed characteristics such as grazing herbage mass or herbage allowance. Feed characteristics have been shown to improve the accuracy of the DMI prediction models in dairy cows (O’Neill et al., Reference O’Neill, Lewis, O’Donovan, Shalloo, Mulligan, Boland and Delagarde2013). Such feed characteristics were not included in the present study as they are not readily available on beef farms and where large numbers of phenotypes are available, indicators of DMI need only be moderately genetically correlated with actual DMI for genetic evaluations (Pszczola et al., Reference Pszczola, Veerkamp, de Haas, Wall, Strabel and Calus2013; Manafiazar et al., Reference Manafiazar, Goonewardene, Miglior, Crews, Basarab, Okine and Wang2015).
The present study further highlights the challenges associated with predicting individual DMI in a grazing environment. Accepting the limitations around the applicability in its current form, the relatively high R 2 of the model developed suggests it offers some potential as a means of phenotyping DMI on commercial farms. It may offer future opportunities to select for genetic improvement of feed intake and feed efficiency as technological advances make ruminating mastications and body measurements easier to record.
Acknowledgements
The authors acknowledge the financial support of the Department of Agriculture, Food and the Marine Research Stimulus Fund 13/S/496 RAPIDFEED. The authors gratefully acknowledge the technical assistance of M. McManus, N. Galvin and the Teagasc Grange farm staff.
Declaration of interest
None.
Ethical statement
The animal procedures undertaken in this study were approved by the Teagasc Animal Ethics Committee and licenced by the Health Products Regulatory Authority in accordance with Directive 2010/63/EU.
Software and data repository
None.