I. INTRODUCTION
Compared with common silicon steel, Fe–6.5 wt% Si steel has exhibited higher magnetic induction and lower iron loss characteristics due to very large electrical resistivity and the smaller eddy current loss.Reference Kim, Pan, Lin, Wang, Lin and Chen1 As a kind of nonoriented electrical steel with excellent soft magnetic properties,Reference Fu, Yang, Zhang and Xie2 it is widely used in high frequency fields, such as the choke coil, high-frequency transformer, high-frequency motor as well as magnetic shield.Reference Ros-Yáñez, Ruiz, Barros and Houbaert3 However, extremely poor formability at room temperature makes it very difficult to produce Fe–6.5 wt% Si sheets by using the conventional cold rolling processes,Reference Li, Yang, Cai and Wang4 so its manufacture and application are severely restricted. In recent years, various relevant techniques avoiding the brittleness of Fe–6.5 wt% Si steel have been invented, such as electro-chemical reduction,Reference Barros, Ros-Yañez, Vandenbossche, Dupré, Melkebeek and Houbaert5 physical chemical vapour deposition,Reference Wu, Fan, Wang, Li, Gan and Zhang6 spray forming, etc. But using the methods above can bring a longer production cycle and a high production cost. Therefore based on the traditional rolling techniques, developing the warm rolling method is urgent.
Presently, a number of studies about recrystallization behaviors and ordered phases of high silicon electrical steel with initial equiaxed or columnar grains have been carried out. T. Ros-Yañez et al.Reference Ros-Yañez, Houbaert, Fischer and Schneider7 studied a thermomechanical route about recrystallisation process and texture in hot rolled sheet for the production of high silicon steel. Jung et al.Reference Jung and Kim8 pointed out that the ordered phases of Fe–6.5 wt% Si steel had important effect on the iron loss of alloy through changing the cooling rate. But little work has been performed on warm rolling reduction causing the changes of microstructure and texture of Fe–6.5 wt% Si steel.
In previous work, we reported that ordered phases and microhardness of Fe–6.5 wt% Si steel sheet after hot rolling and annealing, and it built a foundation for further research on the warm rolling of Fe–6.5 wt% Si steel.Reference Li, Yang, Cai and Wang4 The different warm rolling reductions will have a key effect on the textures and grain sizes, thereby obtaining different magnetic properties. The aim in this study, the careful and overall work is to explain the effects of warm rolling reduction on the microstructure and texture, thereby allowing further knowledge about magnetic properties of Fe–6.5 wt% Si steel.
II. EXPERIMENTAL PROCEDURES
The Fe–6.5 wt% Si ingot was made from pure iron (99.5 wt%) and metallic silicon (99 wt%) in a high frequency vacuum induction furnace. The chemical composition of experimental steel is presented in Table I.
Chemical composition (wt%).

The ingot weighed 45 kg was forged into 50 mm sheet at 1200–1250 °C. The whole process of hot rolled sheets was divided into two stages. In the first stage of the process, the sheets with 50 mm thickness were rolled to 4 mm thickness sheets by 8 passes on a Φ450 mm hot rolling test, and hot rolling temperature was controlled between 1150 and 850 °C. The total rolling reduction ratio was 92%, concretely speaking, the reduction ratio in the first 7 passes was 28–30%, and the reduction ratio in the last pass was 20%. In the second stage, the reheated sheets with 4 mm thickness were hot rolled to 1, 1.43, 2 and 3.35 mm in thickness by 1 pass at 1050–850 °C, and cooled to room temperature in the air.
All hot rolled sheets were annealed at 950 °C for 1 h in a nitrogen atmosphere. Then they were cooled to room temperature in the air. All annealed sheets (1, 1.43, 2, and 3.35 mm in thickness) were put into the box-type furnace, warm rolled to 0.5 mm in thickness at 600 °C, the corresponding rolling reduction of 50, 65, 75, 85%, respectively. After warm rolled in each pass, they were reheated at 600 °C for 3 min in the box-type furnace. During warm rolling, the reduction ratio in each pass was 8–10%. After warm rolling, all the rolled sheets were annealed at 900 °C for 8 min in a nitrogen atmosphere.
Optical microscopy was used to observe the grains of hot-rolled and warm-rolled sheets on the longitudinal section of samples. The microstructures along the longitudinal section as defined by the rolling direction (RD) and normal direction (ND) were observed by an FEI Quanta 600 scanning electron microscope (FEI Company, Hillsboro, Oregon) with an OIM 4000 electron backscatter diffraction (EBSD) detector (FEI Company). The dislocation configuration was detected by means of Tecnai G2 F30 transmission electron microscopy (TEM; FEI Company). The orientation distribution function (ODF) was measured and calculated at center layer based on x-ray diffraction.
Magnetic inductions at 800 A/m (B8), 5000 A/m (B50) and iron losses at 50 Hz and 1.5 T (P15/50), 400 Hz and 1 T (P10/400), were respectively measured using a single sheet tester in the RDs of annealed specimens with 100 mm length and 30 mm width.
III. RESULTS
A. Microstructures and texture of the hot rolled sheets
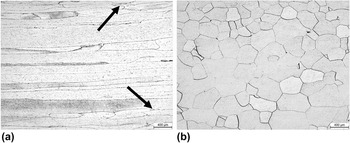
Figure 1 presents the microstructures of the 2 mm thick hot rolled sheet and sheet after annealing at 950 °C for 1 h. Owing to the dynamic recrystallization and the stored energy, some recrystallization grains had occurred on its surface (indicated by arrow above), as shown in Fig. 1(a). It could be seen that uniform and equiaxial recrystallization grains were observed, evenly distributing on the surface of annealed sheet, as shown in Fig. 1(b).
Microstructures of (a) the 2 mm thick hot rolled sheet and (b) sheet after annealing at 950 °C for 1 h.

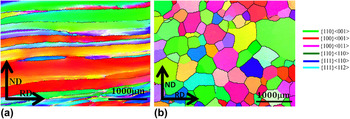
Figure 2 shows the orientation image map and corresponding φ2 = 45° section of ODF of hot rolled sheet and sheet after annealing at 950 °C for 1 h. There were some coarse grains with the {100}〈001〉 texture in the center area, and a little indistinctive copper and brass shear zone, some Goss-oriented grains on the surface layer, as shown in Fig. 2(a). These continuous {100} orientation included the cube orientation {100}〈001〉 and rotating cube orientation {100}〈011〉. Based on the nonhomogeneous deformation, Goss-oriented grains mainly originated within or around the deformed grains with the {111} orientation, usually resulting from the shear stress during hot rolling. There were the lower and dispersed grains with the {100}〈011〉 texture and large amount of Goss-oriented grains growing up by means of the migration of high-angle grain boundaries in annealed sheet. At the same time, deformation grains with the {100} orientation in the surface were changed into the grains with the {110} orientation owing to the shear action between the surface and subsurface, as shown in Fig. 2(b).
Orientation image map and corresponding φ2 = 45° section of ODF of (a) the 2 mm thick hot rolled sheet and (b) sheet after annealing at 950 °C for 1 h.

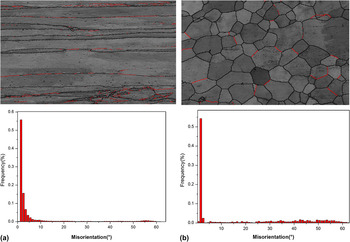
Figure 3 shows the frequency distribution of misorientations for the 2 mm thick hot rolled sheet and sheet after annealing at 950 °C for 1 h. As the figures show, grain boundaries were delineated: black for high-angle grain boundaries (>15° misorientation) and red for low-angle grain boundaries (<15° misorientation). Compared with hot rolled sheet, and a lower ratio of low-angle grain boundaries and a higher ratio of high-angle grain boundaries existed in annealed sheet, as shown in Fig. 3.
Frequency distribution of misorientations for (a) the hot rolled sheet and (b) sheet after annealing at 950 °C for 1 h.

B. Microstructures and texture of the warm rolled sheets
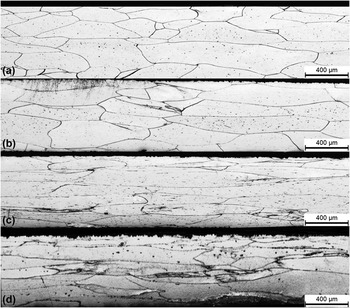
Figure 4 presents the microstructures of Fe–6.5 wt% Si steel with 50, 65, 75, and 85% rolling reductions when the warm rolling temperature is 600 °C. As the rolling reduction increased gradually, there were significant changes in the warm rolling microstructures, and the original equiaxed grains were gradually elongated along the deformation direction. A few recrystallization grains were found in the sheet with 50% rolling reduction, as shown in Fig. 4(a). Several shear bands occurred in the sheet with 85% rolling reduction, as shown in Fig. 4(d).
Microstructures of the warm rolled sheets with different rolling reductions (a) 50%; (b) 65%; (c) 75%; (d) 85%.

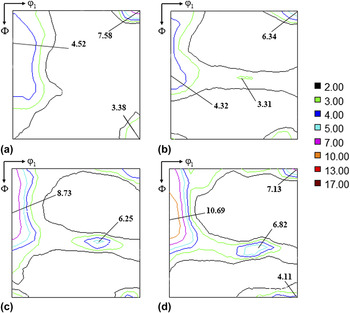
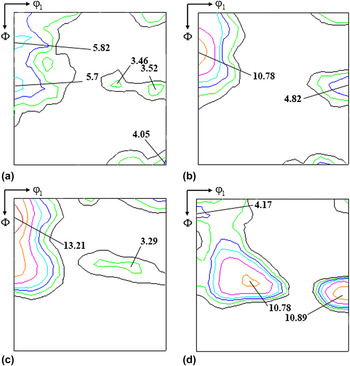
Figure 5 shows the textures in center layer of warm rolled sheets with different rolling reductions. The aggregation state of grain orientations could be seen from the ODF. It was clearly found that the deformed textures mainly concentrated on the α-fiber at the lower deformation, its textures with much weaker {111}〈uvw〉 component and strong {001}〈110〉 component in center layer, as shown in Fig. 5(a). And with the increase of plastic deformation, every crystalline orientation was constantly generated along α-fiber (〈110〉∥RD) and γ-fiber (〈111〉∥ND). The intensity of {001}〈110〉 component was on the decline, and the textures characterized by slightly stronger {112}〈110〉 component and weaker{111}〈112〉 component were transformed from Goss texture, as shown in Fig. 5(b). When the amount of deformation reached 75%, its intensity on γ-fiber was more obvious, and cube {100}〈001〉 texture began to develop gradually. With the increase of the deformation gradually, α-fiber dominated the warm rolling texture, in the meantime, the intensity of {001}〈110〉 component and Goss texture had been enhanced to a certain extent, as shown in Fig. 5(d).
Textures (φ2 = 45° section of the ODFs) in center layer of the warm rolled sheets with different rolling reductions (a) 50%; (b) 65%; (c) 75%; (d) 85%.

C. Microstructures and textures of the finally annealed sheets
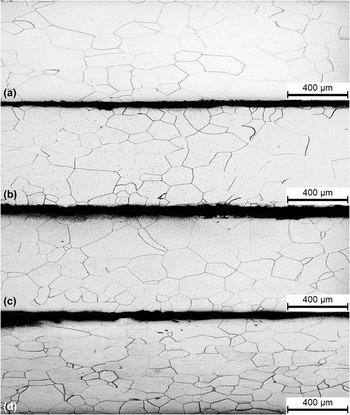
Figure 6 shows the microstructure of the final annealed sheets with different rolling reductions. It was clearly that a large amount of grains with minimum sizes existed in the sheet with 85% rolling reduction due to the larger accumulated deformation energy. After annealing, with increased the rolling deformation and stored energy, the sites of recrystallization nucleation in the matrix were on the increase, which led to the improvement of recrystallization nucleation rate and the decrease of recrystallization grain size. It was clearly that high warm rolling reduction was not conducive to obtain coarsened recrystallization grains.
Microstructures of the final annealed sheets with different rolling reductions (a) 50%; (b) 65%; (c) 75%; (d) 85%.

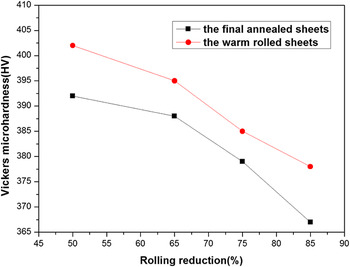
Figure 7 depicts the Vickers microhardness of the warm rolled sheets and the final annealed sheets with different rolling reductions (50, 65, 75, and 85%). Accompanied with an increasing warm rolling reduction, the values of Vickers microhardness in the warm rolled sheets decreased, and they were 402, 395, 385, and 378 HV, respectively. After annealing, they were 392, 388, 379, and 367 HV, respectively.
Vickers microhardness of the warm rolled sheets and the final annealed sheets with different rolling reductions.

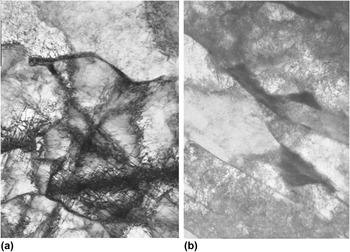
Figure 8 shows the TEM micrograph of the final annealed sheets with different rolling reductions (50% and 75%). In the sheet with 50% rolling reduction, its interior microstructure was divided by lots of dislocation cells, and the dislocation density was low within each cell, but very high on the cell wall. After annealing, owing to dynamic recrystallization, the dislocation density was greatly reduced and a large amount of cell structure occurred, which removed part of work hardening and effectively soften the alloy, as shown in Fig. 8(a). When the rolling reduction was up to 75%, the uneven deformation formed narrow nonequiaxial cell structure, and the dislocation density decreased, as shown in Fig. 8(b).
TEM micrograph of the final annealed sheets with different rolling reductions (a) 50%; (b) 75%.

Figure 9 shows the textures in center layer of the final annealed sheets with different rolling reductions. After annealing, in the sheet with 50% rolling reduction, it textures were mainly composed of uneven α-fiber and the weaker γ-fiber, as shown in Fig. 9(a). Accompanying by an increasing warm rolling reduction, the final textures were dominated by the {113}〈110〉 component and the {111}〈112〉 component. And the whole intensity of {100} plane texture was significantly reduced, in the meantime, the intensity of both α-fiber and the γ-fiber were sharply enhanced, as shown in Fig. 9(b). And it is similar, to the sheet annealed with 75% rolling reduction, the {111}〈110〉 texture was changed into the {111}〈112〉 recrystallization texture. When the amount of deformation reached 85%, after annealing, the grains with the {111}〈112〉 texture weren't transferred to new grains with {100} orientation, thereby obtaining more {111} orientation.
Textures (φ2 = 45° section of the ODFs) in center layer of the final annealed sheets with different rolling reductions (a) 50%; (b) 65%; (c) 75%; (d) 85%.

D. Magnetic properties
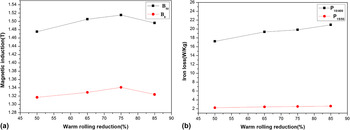
Figure 10 shows the effects of warm rolling reductions on B8, B50 and P15/50, P10/400 of the final annealed sheets with different warm rolling reductions. Liu et al. (2015) reportedReference Liu, Li, Li, Gao, Liu, Luo, Zhang, Chen, Cao, Liu and Wang9 that when the rolling temperature was 600 °C, the values of B8 and B50 in Fe–6.5 wt% Si steel with 65% rolling reduction were 1.32 T and 1.52 T, respectively. And the values of P15/50 and P10/400 were 2.425 and 23.5 W/kg, respectively. It could be clearly seen that as the warm rolling reductions increased, the magnetic induction (B8, B50) of final annealed sheets increased sharply up to a maximum value and then decreased to a certain value, and the values of iron loss (P15/50, P10/400) increased monotonically. After annealed, the values of B8 and B50 with different warm rolling reductions (50, 65, 75, and 85%) were 1.317, 1.329, 1.341, 1.324, and 1.475, 1.505, 1.515, 1.496 T, respectively. And the values of P15/50 and P10/400 were 2.221, 2.419, 2.494, 2.588, and 17.223, 19.342, 19.814, 20.941 W/kg, gradually increasing with the warm rolling reductions.
Effects of warm rolling reductions on B8, B50 and P15/50, P10/400 of the final annealed sheets with different warm rolling reductions. (a) B8, B50 and (b) P15/50, P10/400.

IV. DISCUSSION
A. Analysis on microstructure and texture of the hot rolled sheets
Many experiments have been conducted to investigate the mechanism of texture development in terms of stored energy and nucleation during recrystallization.Reference Liu, Zhang, Ren, Albert and Zuo10 The recovery and partial recrystallization happened during hot rolling, which resulted in a remarkably inhomogeneous microstructure, as shown in Fig. 1(a). Its inhomogeneity was attributed to the work hardening difference among the deformation grains with different orientations. Some recrystallization grains form on the surface of hot rolled sheet due to the higher stored energy. The plastic deformation occurs in each pass during the hot rolling, at the same time the internal stored energy increases as the deformation increases. When the stored energy is accumulated to a certain degree, there appears to be the dynamic recrystallization phenomenon, that is to say, the stored energy is as the driving force for the recovery and recrystallization. As a result, elongated grains become a fine fibrous tissue, retained until room temperature.
When annealing, the grain nucleation takes place on the original grain boundaries, and the nuclei in local regions with the highest stored energy grow up. Then the nucleation and growth rate are determined by various deformation stored energy in each grain (Taylor factors). Owing to γ-fiber with the higher Taylor factor, the recrystallization nucleation with γ-fiber is always formed first during annealing. The order from low to high of stored energy is {100}〈011〉, {111}〈110〉, and {111}〈112〉 components. So the deformation grains with the {111}〈110〉 and {111}〈112〉 components always lead to the recrystallization, then they are swallowed during annealing, and then the deformation grains with the {100}〈011〉 texture follow them. From this, it can be seen that the {111}〈110〉 and {111}〈112〉 components get more influence by annealing temperature. So after annealing at 950 °C for 1 h, the deformation textures mainly concentrated on the {110}〈001〉 Goss texture, {100}〈001〉 and {100}〈011〉 components, accompanying with the lower and dispersed {111}〈110〉 and {111}〈112〉 textures, which was helpful for the growth of grains and the improvement of magnetic properties.
The low-angle grain boundaries are formed through the dynamic recovery and partial recrystallization.Reference Hayakawa and Kurosawa11 After annealing, low-angle grain boundaries will evolve into high-angle grain boundaries, which is a process of ferrite recrystallization. The full recrystallization makes the vast majority of subgrain boundaries disappear, replaced with new high-angle grain boundary. In the conventional sense, the grain growth processes is completed by means of the migration of high-angle grain boundaries.Reference Morawiec12 Usually grains with relatively large size will swallow up the smaller grains around it and grow up, when confronting with the larger size grains, it also will be swallowed.
B. Effects of rolling reduction on microstructure and texture of the warm rolled sheets
Some oriented grains (such as γ-grains) with high Taylor factor are easy to happen in shear band that is closely related to the mode of deformation such as activation of slip systems and strain hardening.Reference Dafé, Paolinelli and Cota13 Consequently, suitable warm rolling reduction was responsible for the formation of shear band. The grain boundaries and lots of shear bands in rolled sheets can provide nucleation sites for Goss {110}〈001〉 and Cube {100}〈001〉 orientations, strengthening the magnetization during annealing.
All equiaxial grains were elongated along the rolling direction (Fig. 4), in the case of the slip deformation, owing to the regular rotation of slip plane, and the original orientation of each grain was gradually adjusted into the same orientation, thus forming the deformation texture. The warm rolled sheets with the fibrous deformed microstructure had formed the {001}〈110〉, {112}〈110〉, {111}〈110〉, and {111}〈112〉 textures in BCC metal. Generally, the warm rolling {111}〈110〉 and {111}〈112〉 textures were relatively weakened and the {112}〈110〉 component was the strongest texture (Fig. 5). The deformation textures are turned into recrystallization textures, according to oriented growth theory.Reference Stoyka, Kováč, Stupakov and Petryshynets14
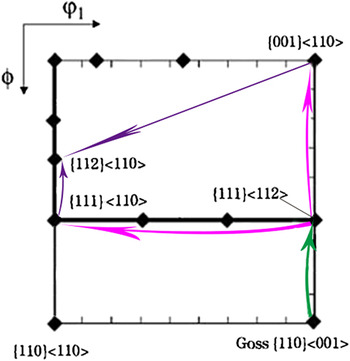
Figure 11 depicts the orientation rotation routine projection on φ2 = 45° section of main components in the warm rolled sheets. Both the {001}〈110〉 and {111}〈112〉 orientations are metastable during the warm deformation, Goss {110}〈001〉 orientation will rotate along the following two paths: {110}〈001〉 → {111}〈112〉 → {111}〈110〉 → {112}〈110〉 or {110}〈001〉 → {111}〈112〉 → {001}〈110〉 → {112}〈110〉. Owing to the instability of Goss texture, the {110}〈001〉 component will rotate the 〈110〉 axis to the {001}〈110〉 α-fiber texture and the {111}〈112〉 γ-fiber texture. Then with the increase of rolling reductions, the {111}〈112〉 component occurred in center layer [Fig. 5(b)]. The {001}〈110〉 and {111}〈112〉 orientations are both metastable orientations during warm rolling, which may form the {111}〈110〉 or {112}〈110〉 component. Therefore, when the amount of deformation reaches 85%, the main textures in center layer are dominated by the {112}〈110〉 and {111}〈110〉 α-fiber textures, accompanied by the weaker {111}〈112〉 γ-fiber texture.
Orientation rotation routine projection on φ2 = 45° section of main components in the warm rolled sheets.

C. Effects of rolling reduction on microstructure and texture of the annealed sheets
R. K. Ray et al.Reference Ray, Jonas and Hook15 had given the stored energy gradation with different orientations: E {001} < E {112} < E {111} < E {110}. The maximum stored energy is located in the grains with {110}〈001〉 Goss orientation, and the nucleation rate of recrystallized grains is higher in the {110} and {111} components than others. The recrystallized grains primarily nucleate at the location with those orientations, then grow into matrix material with near {111} orientation.Reference Wang, Li, Wang, Tian, Zhang and Zhang16
The {100} plane texture was developed in the warm rolled sheets, after annealing, it gradually disappeared, replaced by the {110} plane texture (Fig. 9). Recrystallization texture is determined by both the orientation of nuclei and their growth rate in the deformed matrix. Based on the oriented nucleation theory, compared with other orientations, special orientations in the nuclei are faster in terms of forming the recrystallization texture.Reference Bian, Zeng, Nan and Wu17
In the rolling deformation matrix, those grains with higher stored energy provide the nucleation energy for recrystallization grains priority in the grain boundary as a driving force during recrystallization annealing. So the {111} orientation with high deformation stored energy is easy to form in the grain boundary during warm rolling. On the one hand, the recrystallization nucleation with high-angle grain boundary is promoted by a large amount of sub-grains growing in the vicinity of grain boundary.Reference Rodríguez-Calvillo, Houbaert, Petrov, Kestens and Colás18 On the other hand, owing to the formation of small dislocation cell, the {111} recrystallization texture forms in high stored energy boundary. With the improvement of rolling reduction and stored energy, the finer ferrite grain size, the stronger intensity of {111} component.
With the warm rolling reductions gradually increased, their values of Vickers microhardness decreased (Fig. 7) due to the finer ferrite grain size (Fig. 6) and the decrease of dislocation density (Fig. 8), which made the warm rolling process easier. Compared with the warm rolling sheets, after annealing, their values of Vickers microhardness were significant reduced owing to the formation of recrystallization grains.
The microstructures (Fig. 4) with strong α-fiber texture (Fig. 5) in the warm rolled sheets at 600 °C could evolve into the microstructures (Fig. 6) with strong α-fiber recrystallization texture besides mild γ-fiber recrystallization texture (Fig. 9) in the finally annealed sheets through the mechanism of strain-induced grain boundary migration.
It is well known that a significant competition exists between the {111}〈112〉 component and the {111}〈110〉, {112}〈110〉 components. The recrystallization grains with the {111}〈112〉 orientation will form nucleus and grow in the deformation matrix containing the {111}〈110〉 and {112}〈110〉 orientations.Reference Zhang, Xu, Liu, Li, Cao, Liu and Wang19 And the recrystallization grains with the {111}〈110〉 orientation will form nucleus and grow in the {111}〈112〉 orientation matrix. After annealing, the {100} orientation was changed into the {110} orientation owing to the shear action between the surface and subsurface, which made the whole intensity of {100} plane texture reduced significantly. The {111}〈110〉 texture was changed into the {111}〈112〉 recrystallization texture, its strongest intensity of the {111}〈112〉 component was 13.21 [Fig. 9(c)], which was higher than the strongest intensity in the sheet annealed with 75% rolling reduction.
The stronger {001}〈110〉 texture can be formed in warm rolling deformation. After the final annealing, it has been changed into the {111}〈112〉 texture with high intensity, at the same time the intensity of {001}〈110〉 and {112}〈110〉 components decreases significantly. The deformed γ-grains with high stored energy grow up and merge the adjacent α-grains and λ-grains(〈100〉∥ND) during annealing.Reference Bernier, Leunis, Furtado, Putte and Ban20 In annealing textures, there is a significant competition between favorable texture and γ-fiber recrystallization texture harmful for magnetic properties. The deformation grain with the {001} 〈110〉 component can promote the growth of {111}〈112〉 recrystallization grain.
The movement of superlattice dislocation helps contribute to the increase of energy in the alloy. In plastic deformation, a limited fraction of deformation energy is stored in the material in the form of elastic energy associated with the dislocation network, acting as a driving force for recrystallization as well as the crystallographic orientation of grains. In the process of dynamic recrystallization, the dislocation density was greatly reduced, and a large amount of dislocation multiplication led to the occurrence of cell structure [Fig. 8(a)], which effectively softened Fe–6.5 wt% Si steel. When the rolling reduction was up to 75% [Fig. 7(b)], the local uneven deformation formed narrow nonequiaxial cell structure.
D. Effects of microstructure and texture on the magnetic properties
It is well known that the 〈100〉 direction is the easiest magnetization direction in BCC iron, such as the {100}〈001〉, {100}〈011〉, and {110}〈001〉 components with excellent soft magnetic properties.Reference Kim, Lee and Koo21 The {100}〈0vw〉 texture has two easy magnetization directions in the {100} plane, which is known to be ideal for Fe–Si magnetic materials. But it is hard to obtain strong {100} textures because they do not evolve by conventional rolling process and recrystallization process in silicon steels.Reference Xu, Zhang, Wang, Li, Cao, Liu and Wang22 And γ-fiber is considered to be the worst fiber,Reference Ghosh, Chromik, Vashegi and Knight23 including the {111}〈110〉, {111}〈112〉 textures, etc., and causing a decline in the magnetic properties of annealed sheets.
The magnetic properties of Fe–Si alloy are mainly attributed to the silicon concentration, strip thickness, grain size, annealing microstructure as well as texture. The warm rolling reduction can play a key role in the microstructure and texture. Either stronger λ-fiber texture or bigger grain size can decrease the hysteresis loss. The weaker λ-fiber texture existed in all the final annealed sheets (Fig. 9), therefore, in the present work, the grain size might be the main factor to impact iron loss. The finer sizes of recrystallization grain were obtained through high rolling reduction [Fig. 6(d)], which was not conducive to the formation of favorable textures and the decrease of the 〈111〉 orientation, thereby increasing its iron loss (P15/50, P10/400). By contrast, the coarser grains can not only reduce iron loss, but also improve the favorable textures of final annealed sheets, thereby obtaining excellent magnetic induction.Reference Wang, Zhou, Yao, Li and Chen24
Texture evolution is also an important issue affecting the magnetic properties. It has been shown that the grain growth after recrystallization can strengthen the γ-fiber recrystallization texture and deteriorate magnetic properties.Reference Sha, Sun, Zhang, Patel, Chen, Kalidindi and Zuo25 The results indicated that as the warm rolling reductions increased, the magnetic induction (B8, B50) of final annealed sheets increased sharply up to a maximum value and then decreased to a certain value. As a microstructure sensitive performance, their grain sizes decreased with the increase of warm rolling reductions, and the iron loss values increased monotonically (Fig. 9). After annealing, the minimum B8, B50 values existed in the sample with 50% rolling reduction owing to coarsened grains. Compared with the γ-fiber recrystallization texture harmful to the magnetic properties, the amount of favorable textures was very less. With the decrease of grain sizes, the magnetic induction value (B8, B50) increased, when the amount of deformation reached 75%, its magnetic induction reached the maximum value. However, when the amount of deformation is increased up to 85%, the γ-fiber recrystallization texture had been significantly strengthened, which led to a decline in the values of magnetic induction. Generally, it was found that the grain size had a minor effect on the magnetic induction value when too high deformation produces extremely fine recrystallization grains, and thus the values of B8, B50 mainly depended on crystallographic texture.Reference Chen, Butler and Melzer26
The higher deformation (85% rolling reduction) during warm rolling deflected from the {100} orientation to the {111} orientation, accumulating a certain amount of γ-fiber, then γ-fiber recrystallization texture in the final sheets was very obvious. When the amount of deformation reached 75%, the amount of γ-fiber recrystallization texture decreased, and the {100} plane texture was largely retained, which improved the magnetic induction (B8, B50) of Fe–6.5 wt% Si steel.
In addition, F.J.G. Landgraf et al.Reference Landgraf, Emura, Ito and Carvalho27 proposed that the dislocation density had a great effect on the magnetic properties, and the deformation caused by the dislocations slip could make a great decrease in the values of magnetic induction. Besides the texture and the grain size, the distribution and density of dislocations also affect B8, B50 values. Owing to dynamic recovery in 600 °C, with the increase of rolling deformation, the dislocation density was greatly reduced. After annealing, when the warm rolling reduction was up to 75% [Fig. 8(b)], the local uneven deformation formed narrow nonequiaxial cell structure, at the same time, the dislocation density decreased, which led to the increase of B8, B50 values.
Given the above, the interaction of grain size and texture during warm rolling can be understood in a better way so that the optimum combination is found to improve the magnetic properties through changing different warm rolling reductions.
V. CONCLUSIONS
In the present work, the microstructure, texture and magnetic properties of Fe–6.5 wt% Si steel has been investigated on different warm rolling reductions. The main conclusions are summarized as follow:
(1) The EBSD results indicated that after hot rolling, accompanying with the {100}〈001〉 texture in the center area, and some Goss-oriented grains on the surface layer, remarkably inhomogeneous microstructure and continuous {100} orientation occurred in Fe–6.5 wt% Si steel. When annealing at 950 °C for 1 h, the deformed textures mainly concentrated on the {110}〈001〉 Goss texture, {100}〈001〉 and {100}〈011〉 components, at the same time the high-angle grain boundaries ratio of annealed sheet was significantly higher than that of hot rolled sheet.
(2) During warm deformation, it was clearly found that the deformed textures mainly concentrated on the α-fiber at the lower deformation, as the warm rolling reductions increased, Goss orientation and the {100}〈011〉 orientation gradually decreased. When the rolling reduction was up to 85%, the warm rolling textures were dominated by α-fiber texture, and the intensity of {001}〈110〉 component and Goss texture had been enhanced to a certain extent.
(3) After the final annealing, with the increase of rolling reductions, the grain sizes became finer, the whole intensity of {100} plane texture was significantly reduced, under 85% warm rolling reduction, the recrystallization microstructures with strong α-fiber recrystallization texture and γ-fiber recrystallization texture were responsible for a decline in the magnetic induction.
(4) With the warm rolling reductions increased, the values of magnetic induction (B8, B50) in the final annealed sheets increased sharply up to a maximum value and then decreased to a certain value, and the values of iron loss (P15/50, P10/400) increased monotonically.
ACKNOWLEDGMENTS
This work was supported by the National Natural Science Foundation Project (Grant No. 51174057, 51274062), the National High Technology Research and Development Program of China (Grant No. 2012AA03A503), and the Specialized Research Fund for the Doctoral Program of Higher Education of China (Grant No. 20130042110040).