


Introduction
The fresh-water budget of the Arctic Ocean has a major effect on its dynamics and hydrological cycle (Reference SemtnerSemtner, 1984; Reference CattleCattle, 1985; Reference Carmack, Lewis, Jones, Lemke, Prowse and WadhamsCarmack, 2000). Runoff from rivers represents the single largest source of fresh water flowing into the Arctic Ocean (Reference Bowling, Lettenmaier, Matheussen, Lewis, Jones, Lemke, Prowse and WadhamsBowling and others, 2000) and is a key contributor to the Arctic Ocean’s fresh-water budget (Reference Bowling, Lettenmaier, Matheussen, Lewis, Jones, Lemke, Prowse and WadhamsCarmack, 2000). Reference Vuglinsky, Aagaard, Hartmann, Kattsov, Martinson, Stewart and WeaverVuglinsky (1997) reported that the total runoff from the mainland to the Arctic Ocean is 3558 km3 a–1, with 51.4% of this runoff coming from four large rivers, the Ob, Yenisei, Lena and Mackenzie. To determine the quantity and processes of water-budget components over the Arctic drainage basins, a continental-scale analysis based on reanalysis data is often used (e.g. Reference Serreze, Lynch and ClarkSerreze and others, 2001; Reference Fukutomi, Hyroigarashi, Masuda and YasunariFukutomi and others, 2003) in climatology. Hydrological modeling is also used (e.g. KReference Kite, Dalton and Dionite and others, 1994; Reference Bowling, Lettenmaier, Matheussen, Lewis, Jones, Lemke, Prowse and WadhamsBowling and others, 2000; Reference Ma, Fukushima, Hiyama, Hashimoto and OhataMa and others, 2000).
The Lena river, eastern Siberia, is one of the major rivers entering the Arctic Ocean. The Lena basin covers 2.4×10⁶ km2 and provides >500km3 of annual average runoff water. Although Arctic rivers typically exhibit similar general characteristics (e.g. frozen in winter, first flood in spring), the seasonal runoff patterns for each Arctic river differ due to regional climate and landscape differences. Individual rivers can also show large annual runoff variations. The Lena river freezes over completely from early December until late April. Thawing begins from the upstream reaches in late April and then extends into the mid- and downstream regions. Downstream, the river does not thaw until late June (Reference Ma and FukushimaMa and Fukushima, 2002).
Figure 1 shows the daily hydrographs of the Lena river at Kusur station for the last 10 years. The time of flood rise in spring shows wide variation, and flood peaks are larger in spring than in summer. Runoff in the Lena river is influenced not only by snowmelt in the upstream reaches but also by ice jams in the mid- and downstream reaches (Reference Ma and FukushimaMa and Fukushima, 2002). In addition, some changes related to river discharge, river ice, snow cover and active layer over the Siberia region have been reported (e.g. Reference SmithSmith, 2000; Reference Zhang, Barry, Gilichinsky, Bykhovets, Sorokovikov and YeZhang and others, 2001; Reference PetersonPeterson and others, 2002; Reference VuglinskyVuglinsky, 2002; Reference Yang, Kane, Hinzman, Zhang, Zhang and YeYang and others, 2002,Reference Yang, Robinson, Zhao, Estilow and Ye2003). Three catastrophic floods, occurring in 1998, 1999 and 2001, have been recorded in the last 10 years by the Global Active Archive of Large Flood Events (http://www.dartmouth.edu/artsci/geog/floods/).
Hydrographs at Kusur, 1991–2000.

River-ice processes can greatly affect channel flow. Reference Kite, Dalton and DionKite and others (1994) obtained poor hydrological simulation results for the Mackenzie River, Canada, in the winter period; the large errors may have been due to river freezing. Reference Prowse and CarterProwse and Carter (2002) noted that ice formation during early winter stores water, which later contributes to the spring flood peak of the Mackenzie River. In a hydrological cycle study of the Lena river, Ma and others (2000) demonstrated that river-ice processes could not be ignored. Reference Ma and FukushimaMa and Fukushima (2002) showed that hydrological modeling of the Lena river can be successful when a river-ice model is combined with a river-routing model. The present study uses long-term modeling to confirm the model performance and to illustrate how river-ice formation influences the hydrological processes of the Lena river. An analysis of break-up dates along the main river is also carried out to provide information on the mechanisms of flood formation.
Method and Dataset
A combined hydrological model developed by Reference Ma and FukushimaMa and Fukushima (2002) was used to examine the effects of snowmelt and river ice on Lena river hydrological processes. The model is composed of four sub-models: a one-dimensional soil–vegetation–atmosphere transfer (SVAT) model, a runoff-formation model, a river-routing model and a river-ice model.
In the SVAT model, vegetation is described by a single layer, with the soil layer given as 6m thick. Snowpack accumulates in the winter. Phase change of soil water is considered together with the change in soil temperature. The model provides estimates of latent- and sensible-heat fluxes between the land surface and atmosphere, and temperature profiles in the soil layer. Daily routine meteorological data are required as model inputs, and the model is run in 1 hour intervals.
Runoff at the grid scale used in the SVAT model was simulated using a runoff model (Reference Ma, Fukushima, Hiyama, Hashimoto and OhataMa and others, 2000) modified from the HYCYMODEL developed by Reference FukushimaFukushima (1988). In the model, the active-layer depth determined by the SVAT model is used to account for changes in mean effective soil depth associated with active-layer growth in summer. Surface flow and base flow are estimated using a reservoir system. Model inputs are rainfall, snowmelt and evapotranspiration amounts calculated by the SVAT model.
River-ice growth and decay processes were determined by a simple method of accumulated degree-days. It was assumed that river ice expands when the air temperature is continuously below the freezing point, and that the river-ice decay begins when growth ends. In reality, processes of river-ice formation and decay are very complex, and are affected by numerous environmental conditions (e.g. solar radiation, water temperature and water flow velocity) (Reference AshtonAshton, 1979). However, data for all these factors are not always available for a large-scale river basin. Reference Ma, Fukushima and OhataMa and others (2001) reported a model application for the Lena river basin, and reasonable results were obtained by comparing observed data for river sections over the basin, with some assumptions added to simplify the model run (e.g. surface temperature of the ice layer is set equal to the air temperature; water temperature increases by 0.05˚Cd–1 during the river-ice decay period). Hydrological modeling of the whole basin using Reference Ma and FukushimaMa and Fukushima’s (2002) method is therefore practical.
In this model, river routing is designed as linear. That is, water flow is given a constant velocity in the channel system (Ma and others, 2000). Considering the peculiarity of the break-up period (high water level with high hydraulic pressure), part of the snowmelt over a certain depth is moved along the channel with high velocity (Reference Ma and FukushimaMa and Fukushima, 2002).
A meteorological dataset covering the Lena river basin from 1986 to 2000 is available from the Global Energy and Water Cycle Experiment (GEWEX) Asian Monsoon Experiment (GAME, http://www.hyarc.nagoya-u.ac.jp/game/). Forty stations were selected for this study (Fig. 2). The record for each station included daily measurements of 16 variables: mean air temperature (˚C), maximum air temperature (˚C), minimum air temperature (˚C), precipitation (mm), minimum relative air humidity (%), water-vapor pressure (hPa), saturation deficit value (hPa), mean wind speed (m s–1), maximum wind speed (m s–1), total cloud amount (in class), amount of low cloud (in class), sea-level atmospheric pressure (hPa), sunshine duration (hours), minimum land surface temperature (˚C), snow depth (mm) and extent of snow coverage (rate, 0–10). The wind speed was measured at 10m above the ground surface; other measurements were taken at 2m. Station data were interpolated onto the entire basin using the inverse of the distance between each gridpoint and the nearest three gauges (Reference Ma, Fukushima, Hiyama, Hashimoto and OhataMa and others, 2000). Although geographical factors should be considered in such data reprocessing, only temperature was corrected according to altitude, because no suitable method for correcting other variables according to geographic features has been found to date.
Map of the Lena river basin showing the location of 40 meteorological stations (circles) and main river sections along the river.
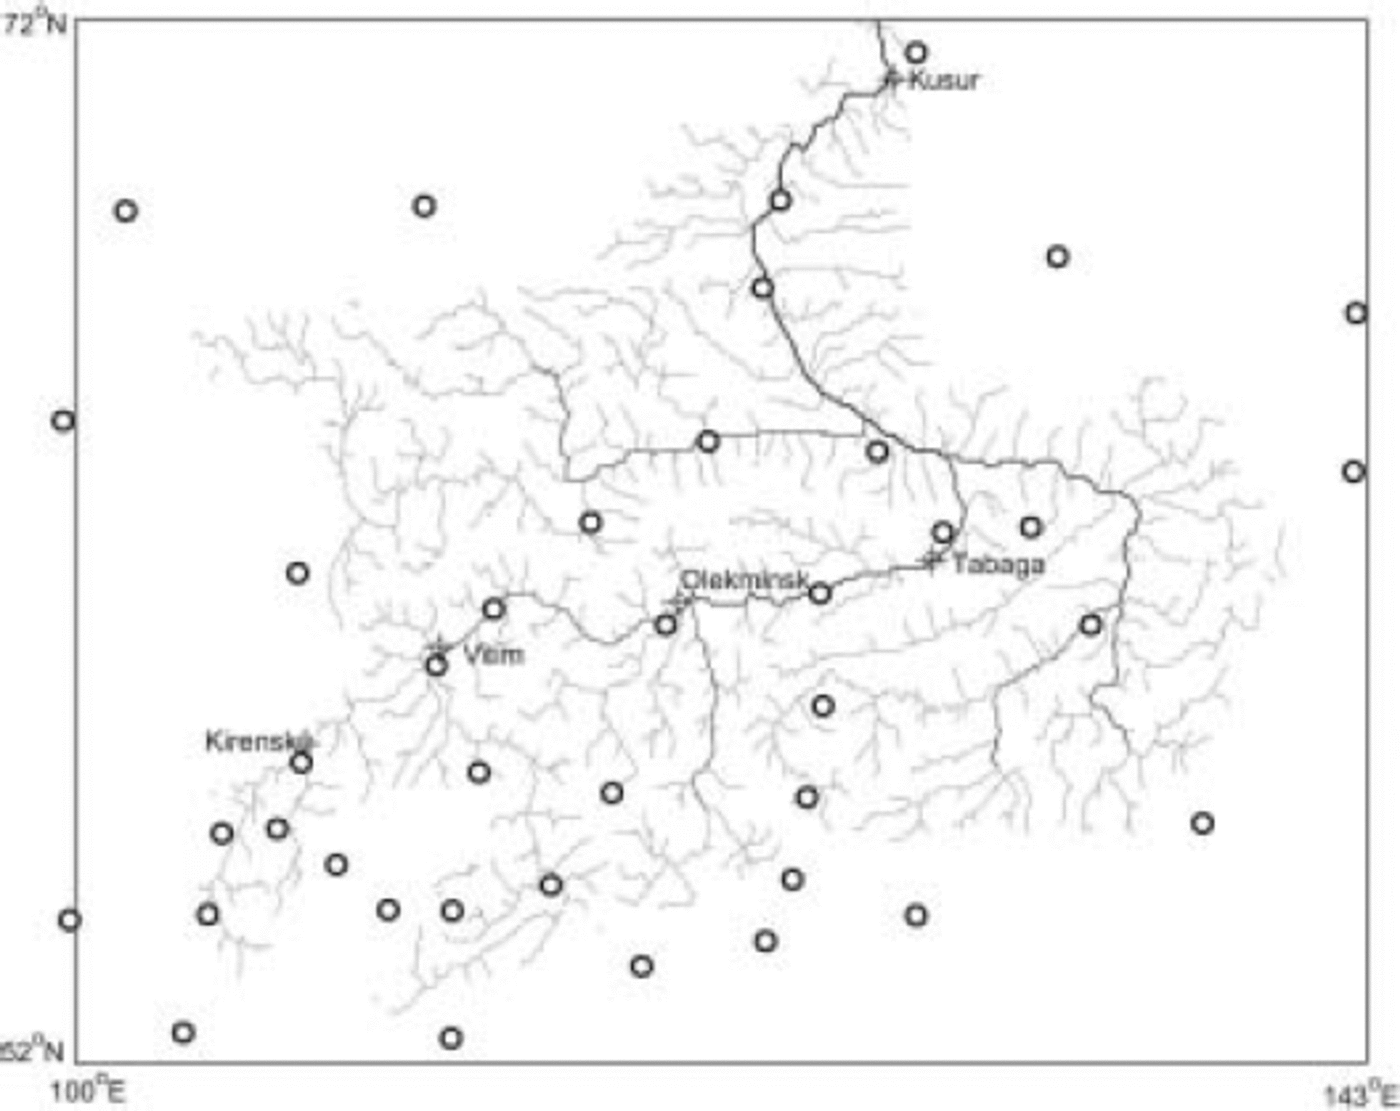
The GAME dataset also includes river-ice thickness data in 10 day intervals measured at 43 river sections over the basin from 1986 to 1988. The R-ArcticNet (version 3.0) data of the University of New Hampshire, USA (http://www.r-arcticnet.sr.unh.edu/v3.0/index.html) provides discharge data for the Arctic region. Monthly discharge for the Lena river from 1986 to 1999 is available for Tabaga (61.83° N, 129.6° E; 897 000 km2; Fig. 2).
Results and Discussion
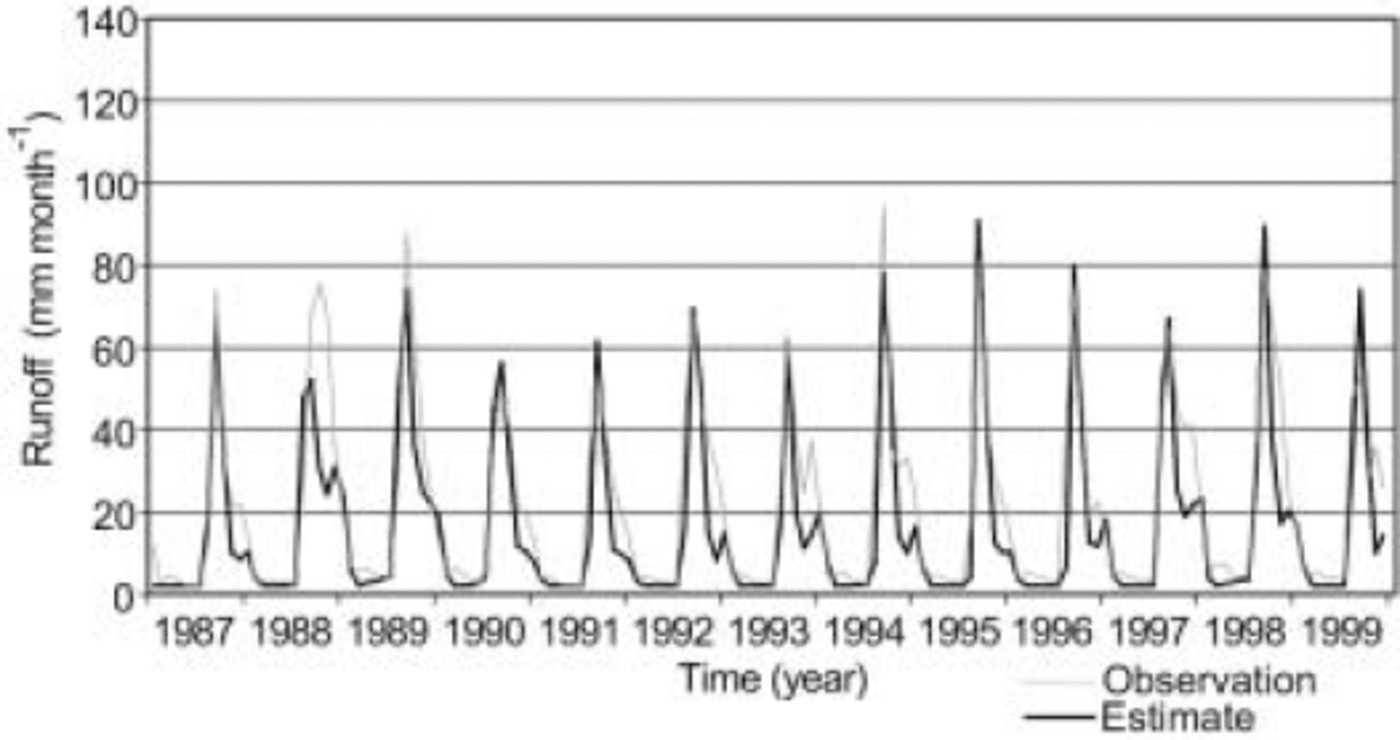
Reference Ma, Fukushima and OhataMa and others (2001) applied the river-ice model to the Lena river and showed that the estimated river-ice break-up dates were consistent with those observed in about 60% of the 43 river sections of the Lena river basin in 1987. Reference Ma and FukushimaMa and Fukushima (2002) reported that the hydrological modeling results noticeably improved in daily hydrographs at five stations on the Lena river when the river-ice model was added to the hydrological model in 1987. Figure 3 shows the monthly hydrographs at Tabaga from 1987 to 1999. Although there are some errors in the spring flood peak value, which may have been caused by the method of interpolating precipitation and the lack of gauge correction for precipitation during winter, the simulated annual and seasonal discharges agree well with observed values at Tabaga. In particular, the timing of the spring flood rise is well represented in the simulation period. These results show that the model system that includes the river-ice model is fully functional.
Comparison of observed and simulated monthly hydrographs at Tabaga, 1987–99. The Reference Ma and FukushimaMa and Fukushima (2002) model with river ice was used to simulate runoff.
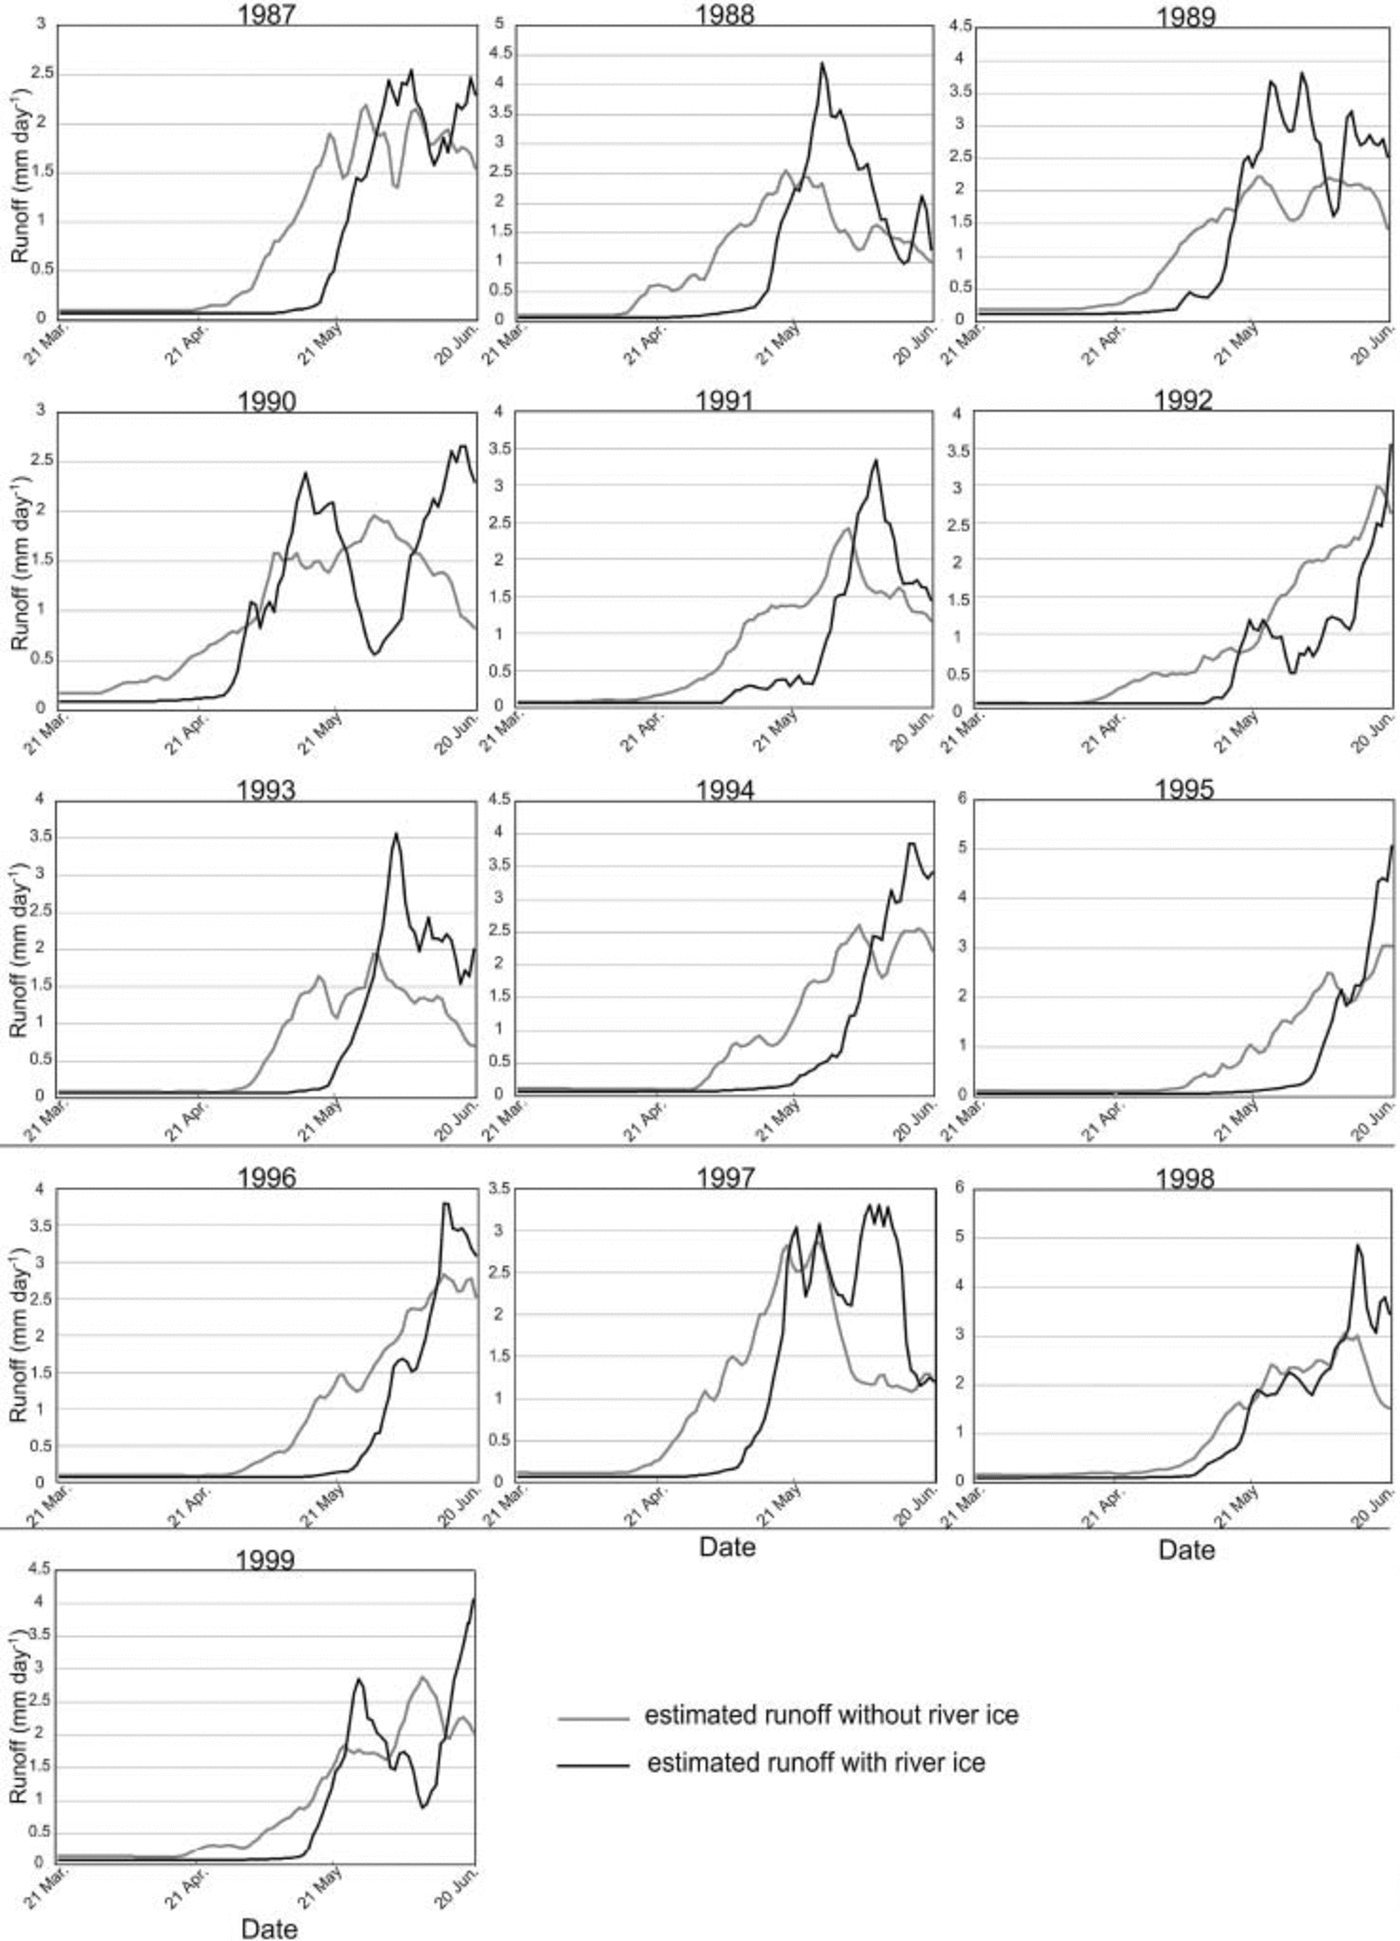
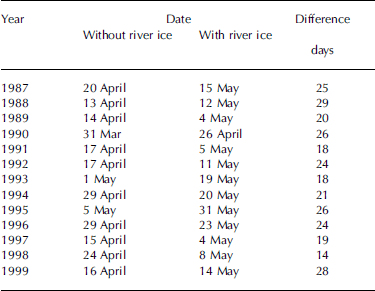
The hydrological simulation was then revised by taking out the river-ice function in the model system to examine the effect of river ice on flood routing along the river. Figure 4 shows the simulated hydrographs at Tabaga with and without river ice in the period 21 March–20 June from 1987 to 1999. This figure clearly shows that there was a difference in flood appearance timing, of about 23 days on average, with a range from 14 days in 1998 to 29 days in 1988. The differences in the estimated dates of flood appearance are summarized in Table 1.
Comparison of hydrographs simulated by the Reference Ma and FukushimaMa and Fukushima (2002) model with and without river ice, 21 March–20 June, at Tabaga, 1987–99.
Comparison of flood-rise dates with and without river ice at Tabaga, 1987–99, estimated by the Reference Ma and FukushimaMa and Fukushima (2002) model
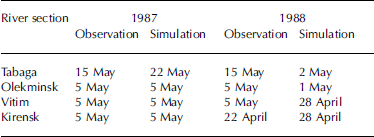
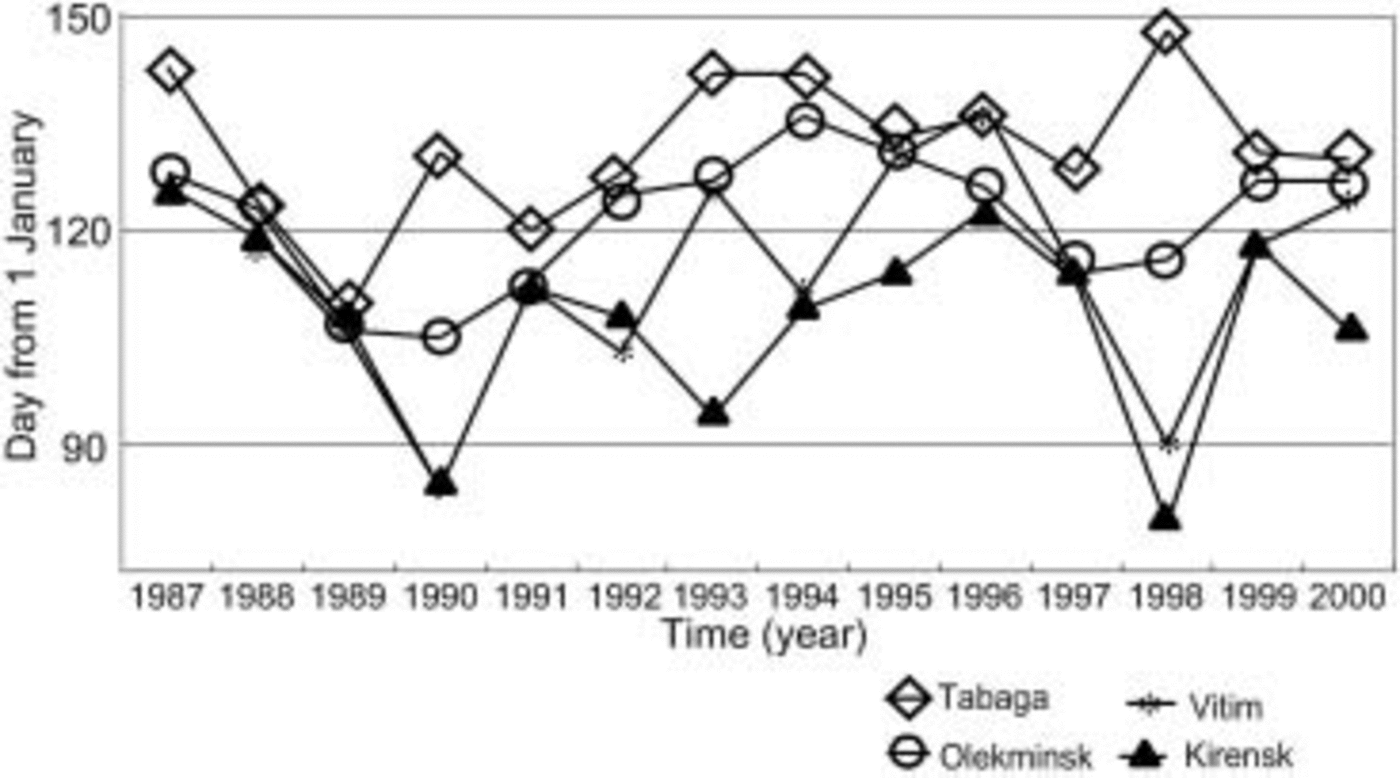
Annual variation in ice break-up timing along the main river is also of interest. To examine the response of river-ice processes associated with local climate change, a numerical analysis of river-ice break-up dates at Kirensk, Vitim, Olekminsk and Tabaga using the nearest meteorological data was conducted. Table 2 shows modeled and actual river break-up dates for four sections of the Lena river from 1986 to 1988. Most of the differences were <10 days. Figure 5 shows a long-term simulation of the break-up dates from 1987 to 2000 for the same four sections. In the first 3 years, the difference in break-up dates between Tabaga and Kirensk is <2 weeks. After 1990, however, the differences range from several days to >2 months. A maximum value of 69 days occurs in spring 1998. For the year, river-ice break-up occurred earliest at Kirensk and latest at Tabaga in the modeling period 1987–2000. This is considered to be related to a disastrous flood that occurred in the downstream area duting the year. In addition, since the tendency of annual variation of ice break-up date at each point varies, it is thought that change in local environment has a stronger influence on the ice break-up date than other changes.
Comparison of observed and simulated river ice break-up, 1987 and 1988
Simulated break-up date along the Lena river, 1987–2000.
Conclusion
River freezing in winter is common in the northern regions. Freezing affects how snowmelt flow enters the upstream reaches of a river before ice break-up. After break-up, floodwater flows into the mid- and downstream areas. This study quantitatively investigated the effect of river ice on river routing using a hydrological model. The results show that river ice creates an approximately 23 day (range from 14 days in 1998 to 29 days in 1988) lag in flood rise at Tabaga on the Lena river.
Break-up date modeling for four sections upstream from Tabaga was carried out during the same period (1987V 2000) using the river-ice model. The results show that the river-ice process is sensitive to changes in local environment. Each section showed wide variation in the annual break-up date, and the difference between the break-up date at Kirensk and Tabaga ranged from several days to several months. A maximum difference of 69 days occurred in spring 1998. Since the tendency of annual variation of ice break-up date at each point varies during the period 1987–2000, it is thought that change in local environment has a stronger influence on the ice break-up date than other changes.



