Introduction
Nutritional and endocrine disorders during critical phases of development, such as gestation, lactation, and puberty, can lead to deleterious metabolic consequences in adult life,Reference Fernandez-Twinn and Ozanne1 for example childhood obesity and high levels of circulating leptin and insulin early in life are factors for metabolic programming.Reference Habbout, Li, Rochette and Vergely2 Due to its particular genetic plasticity, neonatal period is critical for the determination of adult phenotypical characteristics, which orients the premise of cardiometabolic programming by early overfeeding (EO) during lactation; this period is susceptible to epigenetic changes, impacting gene expression and influencing the subsequent changes of developing metabolic diseases.Reference de Souza Rodrigues Cunha, Pereira and dos Santos Pereira3 The EO model is intrinsically connected to the developmental origins of health and disease concept, which over the years has accumulated evidence towards explaining the discrepancy observed in the actual prevalence of obesity and the estimated impacts of isolated changes to lifestyle, since the concept was introduced 30 years ago with the foundational papers put forth by Dr. David Barker.Reference Barker, Osmond, Golding, Kuh and Wadsworth4–Reference Barker, Winter, Osmond, Margetts and Simmonds6
It has also been observed that puberty is a critical risk period for nutritional disorders, such as anorexia and bulimia.Reference Klump7 Restrictive diets in other epigenetically plastic phases such as early life have been shown to cause metabolic programming.Reference Moreno Villares8 Food restriction (FR) is defined as a reduction in food intake when compared to ad libitum intake. In this way, the hormetic response to food or caloric restriction can be a stress, which is capable to inducing beneficial or detrimental effects, depending on the intensity of the restrictive intervention.Reference Mattson9,Reference Mattson10 More specifically, FR can induce cellular auto-repair and defense, and in certain intensities is beneficial, repairing oxidative damage to cells; however, in higher intensities it has deleterious effects, such as a reduction to life expectancy.Reference Speakman and Mitchell11
Cardiovascular disease emerges from changes to homeostasis, which can be caused by imbalances to a plethora of metabolic mechanisms responsible for regulating cardiovascular activity.Reference Lovren, Teoh and Verma12 Inflammation, abnormalities in lipid metabolism, insulin resistance, endothelial dysfunction, adipokine imbalance, inflammasome activation, and impaired autophagy have been suggested as the underlying connection between obesity and cardiovascular diseases.Reference Lovren, Teoh and Verma12,Reference Yiannikouris, Gupte and Putnam13 Impaired vasomotor responses, and consequently raised peripheral vascular resistance, are risk factors for the development of hypertension, which in turn leads to cumulative and progressive damage to the myocardium.Reference Santos14 However, one of the most prominent systems of cardiovascular regulation is the renin–angiotensin system (RAS), since angiotensin II (AngII) acts directly on cardiomyocytes, through the AngII type 1 (AT1) receptors, which stimulates pro-inflammatory, cell growth and proliferative pathways, culminating in the development of fibrosis, which impairs contractile function.Reference Yamazaki, Komuro, Shiojima and Yazaki15 However, AngII also stimulates AngII type 2 receptors (AT2), which have antagonistic effects to AT1, triggering cardioprotective effects.Reference Xu, Carretero and Liu16 Another important part of the functionality of the RAS system is the activation of MAS receptors by angiotensin 1–7. This receptor has been shown to induce antifibrotic, antihypertrophic, and antiproliferative effects, as well as vasodilatory responses.Reference Santos, Sampaio and Alzamora17,Reference Zhang, Tang and Sun18 It is important to also note that the cascade of signaling mediators that lead to pathological cardiac remodeling can start with AngII and leads to the release of extracellular signal-regulated kinase (ERK), which directly causes cardiomyocyte hypertrophy.Reference Shimizu and Liao19 There has not yet been enough exploration of how such mechanisms might be activated through metabolic programing, and no work as of yet explored the notion that FR during puberty might be a metabolically programing factor, seeing as puberty has already been demonstrated to be an epigenetically plastic period of development.Reference de Oliveira, de Moura and Miranda20
Thus, a better understanding of the mechanisms through which cardiometabolic programming takes place is greatly needed going forward, as obesity becomes each year a larger public health issue to contend with, and nutritional disorders become more common. This work aims to elucidate how cardiometabolic programming through EO interacts with high intensity FR, and if this nutritional injury during puberty would have any cardiometabolic programming potential on itself.
Methods
Ethical approval
The handling of animals and experimental procedures were performed according to the rules of National Council of Animal Experiments Control (CONCEA) and the Brazilian Society of Science in Laboratory Animals (SBCAL), and approved by Ethics Committee on Animal Use of Federal University of Goiás – CEUA/UFG (protocol no. 052/2017).
Experimental design and treatment
Wistar rats (70-day-old) were housed in the Animal Facility House of the Department of Physiological Sciences of the Federal University of Goiás in polypropylene cages (45 × 30 × 15 cm), maintained on a 12 h light–dark cycle (07:00 lights on) and controlled temperature (22.0 ± 2 °C). After 1 week of adaptation, the animals were mated in a ratio of two females (n = 24) to each male (n = 12). Pregnant rats were accommodated in individual cages throughout the pregnancy period. At delivery (PN1), animals were divided into two groups: normal litter (NL) and small litter (SL). At third postnatal day (PN3), NL litters were adjusted to nine pups per dam and SL litters were adjusted to three pups per dam, and these numbers were maintained throughout the lactation period. Only male offspring were used in this study. At weaning (PN21), both offspring were housed in polypropylene cages (three animals per cage). Some offspring from both groups (n = 15 rats/group) were fed ad libitum with standard nonpurified rodent chow (Nuvilab, Colombo, Paraná, Brazil), containing 63.0% carbohydrate, 23.7% protein, 4.1% fat (~4.5 kcal/g), and had unlimited access to food and water throughout the experimental period (until PN120). These groups were called normal litter normal fed (NLNF) and small litter normal fed (SLNF), respectively.
At PN30, another batch of NL and SL offspring (n = 15 rats/group) were subdivided into two groups: NL underwent FR (NLFR) and SL underwent FR (SLFR). Animals from FR groups were given 50% of the daily food intake of their respective control groups from PN30 until PN60. After the treatment period, free access to chow was provided to both groups until PN120. Food intake and body weight were evaluated daily from PN30 until PN60, and then every 5 d from PN60 until PN120.
Cardiovascular parameters
At PN120, some animals from both groups (n = 10 rats/group) were anesthetized (Ketamine 100 mg and Xylazine 10 mg/kg of BW; Syntec, São Paulo, Brazil) and submitted to the implant of a polyethylene catheter into the abdominal aorta through the right femoral artery for blood pressure (BP) and heart rate (HR) recording. After 24 h, cardiovascular parameters were recorded in conscious animals. BP signal was obtained by connecting the arterial catheter to a pressure transducer (MLT0699, ADInstruments, Bella Vista, Australia) coupled to an analog amplifier (Bridge Amp, FE221, ADInstruments, Bella Vista, Australia). Data were acquired at a frequency of 2 kHz using an analog/digital converter (PowerLab 4/25, ML845, ADInstruments, Bella Vista, Australia). Systolic blood pressure (SBP), diastolic blood pressure (DBP), mean arterial pressure (MAP), and HR were obtained from the BP signals, with algorithms performed by software (LabChart 7 v7.3.7; ADInstruments, Bella Vista, Australia). Analysis was performed after 30 min stabilization.
Euthanasia and samples collection
At PN120, another batch of fasted animals were anesthetized with Sodium Thiopental (40 mg/kg of BW, i.p.; Thiopentax, Cristália, Brazil) and euthanized by exsanguination for blood, heart, and retroperitoneal and mesenteric white adipose tissue (WAT) samples collection.
Histological analysis
Heart samples were sectioned in non-serial cuts of 6 μm thickness and stained with picrosirius red to cardiomyocyte diameter measurement, and to perivascular and interstitial fibrosis assessment. Morphometric analyses were performed using digital images (TIFF 24-bit color, 2560 × 1920 pixels) obtained with a light microscope (Olympus BX41, Tokyo, Japan) coupled to a camera (DM500 plus ICC50 HD, Leica Microsystems, Wetzlar, Germany). The diameter of the 20 cardiomyocytes was measured using 20 digital images (×1000 magnification) from each animal (n = 5 animals/group). Interstitial and perivascular fibrosis were assessed using 20 images (×100 and ×400 magnification, respectively) from each animal (n = 5 animals/group). Perivascular fibrosis index was determined by the ratio between total fibrosis area and the area of vessel lumen. Interstitial fibrosis was analyzed by stereology, using a grid made up of 300 test points, and interstitial fibrosis percentage was estimated by the ratio between the number of points marked by collagen and total test points. Cardiomyocytes diameter and perivascular fibrosis index analyses were performed using ICY software (Institut Pasteur, Paris, France). Interstitial fibrosis was performed using Image Pro Plus v6 (Media Cybernetics, MD, USA). Morphometric analyses were performed by an operator “blinded” to the corresponding groups.
Western blot
Left ventricle samples (n = 4 animals from different litters to each group) were homogenized in lysis buffer (PBS [137 mM NaCl, 2.4 mM KCl, 10 mM Na2HPO4, 1.8 mM KH2PO4, pH 7.4], 8.8 mM IGEPAL CA-630, 12 mM Sodium Deoxycholate, 3.47 mM SDS, 2 mM Na3VO4, 1 mM PMSF, 2.34 μM Leupeptin, 0.154 μM Aprotinin, 1.45 μM Pepstatin) in a glass homogenizer at 4 °C. Tissue extracts were centrifuged at 10,000 rpm at 4 °C for 20 min to precipitate insoluble material and collection of the supernatant. After centrifugation, supernatant total protein content was quantified by the Bicinchoninic Acid method (Sigma-Aldrich, Missouri, EUA), according to the manufacturer instructions. The samples were denatured in Laemmli buffer (50 mM Tris-HCl, pH 6.8, 10% Glycerol, 2% SDS, 1% 2-mercaptoethanol, 0.001% bromophenol blue). Aliquots of 40 μg of proteins from each sample were subjected to separation by SDS-PAGE. Later, proteins were transferred from gel to nitrocellulose membranes (Amersham Protran, GE Healthcare, Little Chalfont, BUX, UK). The membranes were incubated with a blocking solution (5% skim powdered milk, 10 mM Tris, 150 mM NaCl, 0.02% Tween 20) under mild agitation for 90 min at room temperature, and subsequently incubated with primary antibodies listed in Table 1. Then, the membranes were gently washed (3 × 5 min; 10 mM Tris, 150 mM NaCl, 0.02% Tween 20) and incubated with the manufacturer specific HRP-conjugated secondary antibody (Table 1) for 90 min, and covered with chemiluminescence detection solution (Amersham ECL, GE Healthcare, Little Chalfont, BUX, UK). The chemiluminescence was detected by an image documentation system (ImageQuant LAS 4000 series, GE Healthcare, Chicago, IL, USA), and images were captured. The intensity of the bands was quantified by relative optical density using FIJI software (ImageJ, NIH, Cambridge, MA, USA). GAPDH (glyceraldehyde-3-phosphate dehydrogenase) was used as load control.
List of antibodies used for western immunoblotting

Statistical analysis
Statistical analysis and graphs construction were performed using GraphPad Prism® software version 6 (GraphPad Software, Inc., La Jolla, CA, USA). The results are expressed as the mean ± standard error of the mean (SEM). The D’Agostino & Pearson normality test was used. Two-way ANOVA, with Tukey’s post hoc test, was used to evaluate body weight and food and liquid intake from PN30 until PN120. The other data were analyzed by one-way ANOVA, with Tukey’s post hoc test. The level of significance was set at p < 0.05.
Results
Effects of postnatal early overnutrition and FR during puberty on food intake and body composition
Fig. 1a shows the evolution of body weight from PN30 until PN120 throughout the experimental period. As expected, SLNF and SLFR rats had higher body weight at PN30 when compared to NLNF rats (p < 0.001; F (3, 54) = 41.09; Fig. 1a and F (3, 40) = 16.36; Fig. 1b). However, both experimental groups underwent FR had lower body weight than their control at PN60 (p < 0.001; F (3, 38) = 332.5; Fig. 1c). At PN120 the animals subjected to FR had caught up to the same weight as their control (p < 0.01; F (3, 41) = 11.67; Fig. 1d).
Effects of postnatal early overnutrition and food restriction during puberty on food intake and body composition. Body weight evolution curve (a), body weight at PN30 (b), body weight at PN60 (c), body weight at PN120 (d), food intake evolution curve (e), food intake from PN30 until PN60 (f), food intake from PN60 until PN120 (g), mesenteric (h) and retroperitoneal (i) WAT mass at PN120. Data are presented as mean ± SEM (n = 15). One-way ANOVA, *p < 0.05, **p < 0.01, ***p < 0.001, and ****p < 0.0001.

Fig. 1e shows the food intake curve from PN30 until PN120. Results observed were consistent with the hyperphagia that is expected of SLNF obese animals (p < 0.01; F (3, 27) = 74.63; Fig. 1e), with both FR treatment groups presenting lower food intake due to the treatment from PN30 to PN60 (p < 0.05; 235 F (3, 35) = 467.0; Fig. 1f). However, from PN60 to PN120, food intake returns to similar levels to their respective controls, with both small litter groups remaining hyperphagic (p < 0.05; 238 F (3, 17) = 21.73; Fig. 1g).
In Fig. 1h and 1i it can be observed that EO animals (SLNF and SLFR) had elevated mesenteric and retroperitoneal adipose tissue as compared to NLNF animals (p < 0.01). Interestingly, the FR did not impact adiposity on both groups in relation to their respective controls (p < 0.001; F (3, 55) = 38.39; Fig. 1h and F (3, 48) = 22.02; Fig. 1i).
Effect of postnatal early overnutrition and FR during puberty on cardiovascular parameters
Fig. 2 shows SBP, DBP, MAP, and HR recording at PN120. SLNF had higher SBP (p < 0.01; F (3, 23) = 7.477; Fig. 2a), DBP (p < 0.01; F (3, 23) = 9.235; Fig. 2b), and MAP (p < 0.01; F (3, 23) = 6.636; Fig. 2c) when compared to the control rats, while there were no differences in HR (Fig. 2d).
Effect of postnatal early overnutrition and food restriction during puberty on cardiovascular parameters. Systolic blood pressure (a), diastolic blood pressure (b), mean arterial pressure (c), and heart rate (d). Data are presented as mean ± SEM (n = 10). One-way ANOVA, **p < 0.01, and ***p < 0.001.

Effect of postnatal early overnutrition and FR during puberty on cardiac morphology
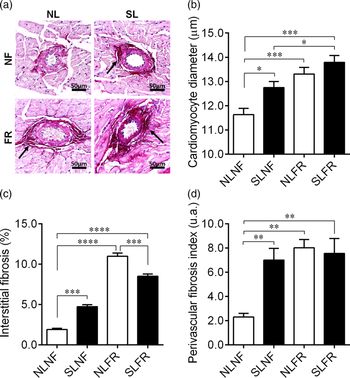
In Fig. 3 can be observed the impacts of the EO and FR on cardiac morphology. Cardiomyocyte diameter is higher in SLNF, NLFR, and SLFR animals compared to NLNF animals (p < 0.05; F (3, 76) = 11.92; Fig. 3). The SLNF, NLNF, and SLFR groups had higher interstitial (p < 0.001; F (3, 76) = 196.3; Fig. 3c) and perivascular (p < 0.01; F (3, 16) = 9.113; Fig 3d) fibrosis.
Effect of postnatal early overnutrition and food restriction during puberty on cardiac morphology. Representative photomicrographs (×400 magnification, scale bars = 50 µm) showing ventricular vessels transversal sections in the left ventricle stained with picrosirius red (a). Quantitative analysis of cardiomyocyte diameter measurements (b). Quantitative interstitial fibrosis analysis (c). Quantitative perivascular fibrosis analysis (d). Data are presented as mean ± SEM (n = 5). One-way ANOVA, *p < 0.05, **p < 0.01, ***p < 0.001, and ****p < 0.0001.

Effect of postnatal early overnutrition and food restriction during puberty on angiotensin II and angiotensin 1–7 receptors expression in the heart. AT1 (a), AT2 (b), and MAS (c). Representative immunoblots are shown below the graphs. Data are presented as mean ± SEM (n = 4). One-way ANOVA, **p < 0.01.

Effect of postnatal early overnutrition and FR during puberty on AngII and angiotensin 1–7 receptors expression in the heart
AngII and angiotensin 1–7 receptors expression were evaluated by western blot in the left ventricle samples. AT1 expression was higher in NLFR animals compared to NLNF animals (p < 0.01; F (3, 12) = 10.38; Fig. 4a). Interestingly, AT2 expression was higher in both FR groups (p < 0.01; F (3, 11) = 14.89; Fig. 4b). There were no differences in MAS expression (Fig. 4c).
Effect of postnatal early overnutrition and food restriction during puberty on extracellular signal-regulated kinase (ERK) expression in the heart. p-ERK (a), total ERK (b), and p-ERK/total ERK (c). Representative immunoblots are shown above the graphs. Data are presented as mean ± SEM (n = 4). One-way ANOVA, *p < 0.05, **p < 0.01, and ***p < 0.001.

Effect of postnatal early overnutrition and FR during puberty on ERK expression in the heart
The levels of both ERK and p-ERK were higher in both groups subjected to FR (p < 0.05; F (3, 12) = 18.49; Fig. 5a and F (3, 12) = 18.46; Fig. 5b); however, there were no differences in the ratio of ERK to p-ERK (Fig. 5c). No difference was observed in ERK and p-ERK expression in the heart from SLNF animals compared to NLNF animals (Fig. 5a and 5b).
Discussion
Obesity and nutritional disorders are both common issues in our society and becoming even more prevalent as the numbers of those affected by obesity rise each year. In this work we show the deleterious effects, particularly when regarding cardiovascular damage, of those two pathologies, with the commonly utilized EO model for obesity, and also a severely restrictive diet during puberty. We hypothesize that dietary restriction at the puberty in rats is an animal model to study nutritional disorders, such as anorexia and bulimia during this important period of the life. Our experimental design was guided by the high incidence of nutritional disorders particularly during puberty,Reference Klump7 and also by the phenotypic plasticity,Reference de Oliveira, Lisboa and de Moura21 making this period particularly prone to metabolic programming.
The severe FR utilized in this study acts as a stressing factor. In fact, we demonstrated for the first time that nutritional disorders at the puberty lead to cardiovascular disorders later in life, as can be observed for instance in our histological analyses, which show higher interstitial and perivascular fibrosis in both of the experimental groups which have been exposed to FR. On the other hand, the results concerning the evolution of body weight between PN30 and PN60 in FR groups seem to indicate that this severely restrictive diet has induced growth retardation in both FR groups.
There are several nutritional and environmental disturbances that are known to cause metabolic programming, such as protein restriction,Reference de Oliveira, de Moura and Miranda20 FR during pregnancy has been shown to metabolically program the offspring,Reference Lumey, Stein and Kahn22 and similarly we showed, in the present study, that restrictive diets have negative repercussions. Although it is worthy of note that in the previously mentioned study a far less intense food restriction was utilized, in contrast with the severely restrictive diet which has been shown in this work to have some deleterious effects, namely cardiovascular remodeling which can be observed in the histological results presented in this study. These histological results are also corroborated and somewhat justified by the results obtained in protein quantification. What we observed in this instance by higher p-ERK and ERK protein expression, which are among the last mediators leading to the pathological remodeling we observed in the hearts of these animals exposed to FR, and the pattern of the NLFR animals presenting themselves as more severely affected by the treatment remains present in these results. On the same mechanistic pathway, we have observed higher expression of both AT1 and AT2 receptors in the left ventricle of these animals, demonstrating both pathological imbalances to the homeostasis of the RAS towards the development of heart disease with the higher expression of AT1. The higher expression of AT2 receptors may be acting as a compensatory mechanism, seeing as AT1 receptors are known to cause impairments to heart homeostasis in the form of the activation of pro-inflammatory pathways,Reference Yamazaki, Komuro, Shiojima and Yazaki15 and the activation of AT2 receptors has antagonistically beneficial effects.Reference Xu, Carretero and Liu16
Our results suggest that the mechanisms by which SLNF obese animals develop hypertension might be different from those causing onset of fibrosis in the animals subjected to FR, independent from the influence of the RAS, potentially linked perhaps to other characteristics of the model such as oxidative stress, as shown in another study.Reference Aroor and DeMarco23 Recently, we have shown that EO induces cardiometabolic programming, leading to oxidative stress and cardiac remodeling in later stages of life.Reference Junior, Cavalcante and Ferreira24 However, inflammation or insulin resistance is also factors that can cause cardiac dysfunctions.Reference Ferrante25,Reference Ramon-Krauel, Pentinat and Bloks26
Thus, we have observed cardiovascular impairments in adult animals that have been subjected to FR during puberty, seen in the cardiac remodeling and the changes in expression of molecular mediators responsible for controlling cardiac homeostasis. We can surmise that FR during puberty is a cardiometabolic programming factor, particularly when we consider the NLFR group, which has shown that the impairments observed are independent from the presence of previous metabolic programming by EO. We can also note the development of hypertension in the SLNF animals, which was an expectation and already fairly well documented for the model,Reference Habbout, Li, Rochette and Vergely2 likely emerged through different mechanisms than the ones through which remodeling took place in the animals subjected to FR.
In conclusion, the present study showed that EO leads to obese phenotype in rats which presented with higher body weight and fat accumulation, as well as higher BP. Besides, it was demonstrated that severe FR during puberty itself had a deleterious impact on cardiovascular parameters in adult life, as observed by the presence of fibrosis and activation of the RAS and ERK systems.
Acknowledgements
LCC and RMG designed the study. LCC, GBR, KKS, ABSM, LAF, and DBTC treated the animals, performed and analyzed in vivo experiments, and performed euthanasia and collection of samples. GRP designed cardiovascular experiments. LCC, ABSM, KKS, and NOA designed, performed, and analyzed the cardiovascular parameters and the experiments. LCSR and LAF performed and analyzed histological analysis. LLC and LCSRC performed and analyzed western blot. RMG and LLC wrote the manuscript. All authors reviewed the manuscript.
Financial support
This work was funded by the Brazilian Foundations: Conselho Nacional de Desenvolvimento Científico e Tecnológico (CNPq) and Coordenação de Aperfeiçoamento Pessoal de Nível Superior (CAPES).
Conflicts of interest
The authors declare that there are no conflicts of interest.
Ethical standards
The authors assert that all procedures of this work comply with the ethical standards of the relevant national guides on the care and use of laboratory animals and have been approved by the institutional committee at Federal University of Goiás.