The development of new fabrication and testing methods at small length scales provides both challenges and opportunities to the understanding of fundamental deformation and failure mechanisms. A number of instruments are dedicated to the measurements and characterization of frictional behavior, including the atomic force microscope (AFM),Reference Carpick, Ogletree and Salmeron1–Reference Hölscher, Schirmeisen and Schwarz4 the multidimensional nanocontact system,Reference Lucas, Hay and Oliver5–Reference Gao, Xu, Oliver and Pharr7 the surface force apparatus (SFA),Reference Homola, Israelachvili, McGuiggan and Gee8, Reference McGuiggan and Israelachvili9 and other dedicated tribological instruments include scratch testers. The typical measured ranges of lateral contact stiffness for AFM and SFA are less than about 10–102N/m and larger than 106N/m, respectively, so it is often difficult for them to be used for the study of mechanical behavior at intermediate or mesoscopic length scales (10–1000 nm contact size). A recently developed multidimensional nanocontact system gives the stiffness range in between (i.e., 10–106N/m), and its usefulness for evaluating the tangential contact behavior at contact sizes ranging from tens of nanometers to submicrons has been recently demonstrated.Reference Lucas, Hay and Oliver5–Reference Gao, Xu, Oliver and Pharr7 This system is comprised of three independent, orthogonal nanoindentation actuators which can be used to make quantitative depth-sensing indentation and stiffness measurements along each axis. A small harmonic force is applied in any of the x-, y-, or z-axis and can be used to determine the stiffness of the contact. A vibration analysis can be used to deduce the contact stiffness from the harmonic response of the displacement and the phase angle shift measured by this frequency-specific, continuous stiffness measurement technique. The harmonic force is controlled such that the amplitude of the resulting displacement oscillation is maintained at a constant value, typically 0.7 nm, which is much smaller than the typical indentation depth (e.g.,hundreds of nanometers). This is similar to the force-modulation method of Carpick et al.,Reference Carpick, Ogletree and Salmeron1 but it is a load-controlled system.
In our previous study,Reference Lucas, Hay and Oliver5 the lateral to normal contact stiffness ratios have measured on copper and gold polycrystals with grain sizes much larger than the contact size, suggesting that these materials can be treated as single crystals if the indentation is far from a grain boundary. Although the crystallographic orientations were not known, when tests were performed within individual grains, the measured lateral contact stiffness as a function of indentation depth exhibited a significant crystallographic orientation dependence. As a comparison, a large number of studies on friction anisotropy at the nanoscale attribute the origin of the crystallographic dependence of friction behavior to the lattice structure mismatch or incommensurability.Reference Carpick and Salmeron2, Reference Hirano and Shinjo10–Reference Gao13 Similar dependence on lattice incommensurability has also been found at microscale smooth contact in the SFA tests on mica surfaces.Reference McGuiggan and Israelachvili9 A friction test on the Ni(100)/Ni(100) surface in an ultra-high vacuum (UHV) system suggests that the friction resistance correlates well to the easy slip direction.Reference Ko and Gellman14 A comparison between our experiments based on the multidimensional nanocontact system and the literature mentioned above indicates the mechanisms responsible for friction anisotropy at different length scales might be significantly different. Consequently, this article is concerned with a quantitative study of anisotropy in both elastic contact and friction based on lateral contact stiffness measurements performed at mesoscale contact size (10–100nm).
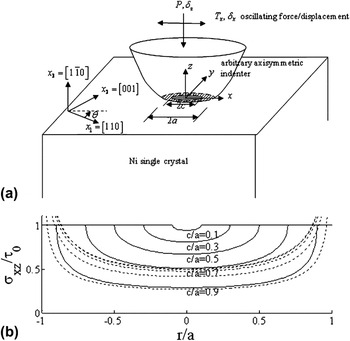
The native surface of a polished Ni single crystal in air is used with crystallographic orientations given in Fig. 1(a). The single-crystal Ni flat (Surface Preparation Laboratory, Zaandam, Netherlands) was cleaned in UHV via sputter cleaning and anneal cycles until LEED analysis revealed its crystallographic structure at the surface. The sample was then removed from the UHV into the ambient where it was initially mounted with the [110] direction aligned to one lateral axis on the indenter. To determine the normal and lateral stiffness, two separate experiments were needed. A Berkovich tip was brought towards the sample at a rate of 10 nm/s until the surface of the sample was found by a rise in measured stiffness. The tip was then loaded into the sample with a constant loading rate of 2 μN/s while a simultaneous oscillation in load was applied to the tip in either the normal or tangential direction. This harmonic load was varied to maintain a constant harmonic displacement of 0.7 nm allowing for the normal or tangential stiffness of the contact to be measured as a function of depth. The oscillation frequency is 160 Hz. Time dependence of friction was not a focus of this study. The applied load was then reduced by 60% and held constant for 60 s allowing a thermal drift correction to be determined. This procedure was repeated taking measurements of the lateral stiffness for 10° increments of sample rotation about the vertical axis of indentation through a full 90° as shown by the angle θ in Fig. 1(a). Lateral stiffness versus indentation depth and crystallographic orientation will be analyzed by the theoretical model presented shortly [with solutions plotted in Fig. 1(b)].
(a) Schematic of the multidimensional contact and conventions used in its analysis. Ni single crystals were adopted in our experiments. The lateral contact direction is given by angle θ which is measured in the (x 1, x 2) plane from the x 1 axis, i.e., θ = tan−1 (x 2/x 1). (b) Interface shear stress distribution [obtained from the solution of the external circular crack with annular cohesive zone in Eq. (5)] is plotted with varying slip zone size, c/ a. Dashed lines are elastic solutions in Eq. (4) at equivalent lateral loads.

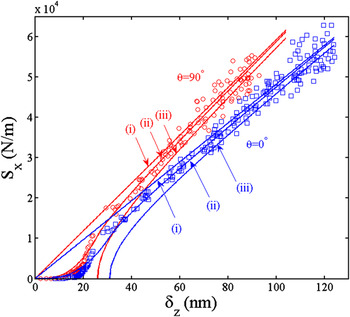
Typical experimental measurements of lateral contact stiffness are shown in Fig. 2 for tests along the [110] axis (i.e., θ = 0°) and the [001] axis (i.e., θ = 90°). The normal contact stiffness (data not shown for brevity) was found to be linear with the contact penetration depth (i.e., linear with the contact size for a Berkovich indenter). However, the tangential contact stiffness became linear only when the penetration depth was larger than about 40 nm. These results at large indentation depths are first analyzed by an anisotropic elastic contact analysis.

For axisymmetric contacts, the normal elastic contact stiffness is given by the Sneddon solution and the lateral one by the Mindlin solutionReference Johnson15, Reference Gao, Xu, Oliver and Pharr16

where A is the contact area, P and T are the normal and lateral contact force respectively, δz and δx are the normal and lateral displacement, respectively. These formulas are also true for elastically anisotropic solids with effective moduli given by

where E i = 1141GPa, G i = 533.2GPa, and ν i=0.07 are the Young’s modulus, shear modulus, and Poisson’s ratio of the diamond indenter, respectively, and  and
 are the effective moduli of the specimen. The latter quantities can be calculated using an anisotropic elastic contact analysis.Reference Willis17–Reference Gao20 If the indenter is rigid and the specimen elastically isotropic, then
 with ν being Poisson’s ratio of the specimen.Reference Lucas, Hay and Oliver5, Reference Reinstädtler, Kasai, Rabe, Bhushan and Arnold21, Reference Hurley and Turner22
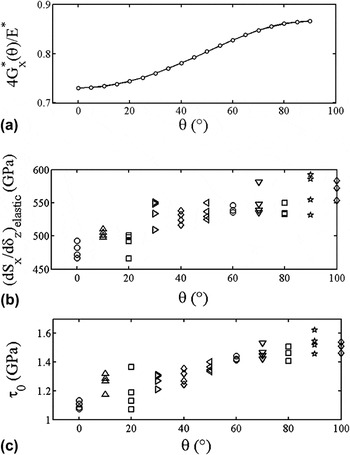
The stiffness ratio  can be used to evaluate the elastic anisotropy of the specimen. Using literature values of c 11 = 244GPa, c 12 = 158GPa, and c 44 = 102GPa for Ni single crystal, the predicted stiffness ratio from Eq. (2) is plotted as a function of the sample orientation θ in Fig. 3(a). When the lateral orientation rotates from [110] through [001], a 20% increase of the lateral contact stiffness is predicted. It should be noted that for Berkovich contacts, the analytical solutions need to be corrected with a prefactor in Eq. (1), being usually about 1.05.Reference Oliver and Pharr23 This uncertainty will not affect our analysis here because of the very large stiffness variation with respect to sample orientation in our experimental results. Fitting all the Sx∼Sz measurement data at large indentation depths to straight lines (e.g., lines marked as (i) in Fig. 2) with θ varying from 0º to 90º gives the plot of
 in Fig. 3(b). It is experimentally found that the lateral contact stiffness increases by about 20% while rotating from [110] to [001], which agrees well with the theoretical prediction in Fig. 3(a). Since the contact radius a (given by
 ) should be linear to the indentation depth for geometrically self-similar indenters, a linear ratio β = a/δz can be defined. Using Eq. (1) gives

With respect to test direction θ on single-crystal Ni (Fig. 1), plotted are the (a) predicted elastic contact stiffness ratio,  , (b) the fitted parameter
 , and (c) the fitted interface strength τ0.

A direct comparison between Figs. 3(a) and 3(b) gives β=1.57±0.04.
The reduction of lateral contact stiffness, relative to the elastic prediction at small indentation depths, is interpreted to be due to partial slip at the contact. Thus, the friction anisotropy may be evaluated at the mesoscale. It should be noted again that all the measurements were conducted by modulating harmonic load to maintain a fixed 0.7 nm displacement oscillation. It is rather counter intuitive that such a small oscillation in the tangential direction (subnanometer) causes such a significant deviation from the elastic solution for a contact radius of tens to hundreds of nanometers. Factors such as surface roughness and surface contamination are present only to the first nanometer of the surface and should not influence lateral contact stiffness at the indentation depths in this article. Tip bluntness, if existent, will make the lateral stiffness even higher at low loads, thus unable to explain the stiffness reduction observed in Fig. 2. In addition, the linearity between normal stiffness and normal indentation depth in our experiments suggests a high-quality Berkovich tip. This paradox can be understood by considering the friction-stress-based interface (micro-) slip model.Reference Gao, Lucas, Hay, Oliver and Pharr6 The key idea is summarized below. The analytical contact analysis has to be restricted to a circular contact—a limitation that will be addressed in future study. For elastic tangential contact, the interface shear stress field,

has an inverse-square-root singularity at the contact edge. Because of this stress singularity, the two contacting surfaces start to slip at the contact perimeter, and an annular slip zone (in the regime of c ≤ r ≤ a, where r is the radial coordinate and c is the stick/slip boundary) grows in size by reducing its inner diameter with an increase of the applied tangential force. The boundary value solution shown in Fig. 1(b) gives the interface shear stress distributionReference Gao, Lucas, Hay, Oliver and Pharr6, Reference Tada, Paris and Irwin24, Reference Johnson25

where τ 0 is the friction stress (often called the interface shear strength). Solid lines indicate shear stress distributions across the contact interface for several representative values of c/ a. Elastic solutions calculated using Eq. (4) are plotted as dashed lines in Fig. 1(b) for equivalent levels of lateral force. It should be noted that Eqs. (4) and (5) are valid for both elastically isotropic and anisotropic solids because WillisReference Willis17 has proved that the structure of the solutions for circular contact and externally circular cracks are identical when using the composite moduli of Eq. (2).
The theoretical contact stiffness is derived from a vibration analysis, in which an oscillation between 0 and δ max is prescribed for the tangential displacement. This stiffness is approximated by a linear average over  ,

where the lateral contact stiffness is given by

with  and
 . In Fig. 2, Eq. (7) is used to plot curves marked as (iii), while Eq. (6) gives the curves marked as (ii). For large indentation depths, i.e.,
 , the tangential contact stiffness is indistinguishable from the elastic contact solution and the size of the stick zone approaches the contact size, i.e.,
 . For small indentation depths, i.e., small
 , even an infinitesimally small tangential load can cause a large slip zone size (c << a), and the tangential contact stiffness can be significantly lower than the elastic solution. During lateral oscillation, it is interface microslip, rather than macroscopic sliding, that occurs. Sliding and slip (or microslip) are distinguished in the same manner as in the Cattaneo–Mindlin model. The latter denotes partial stick and partial slip on the contact, while the former corresponds a relative lateral displacement over the entire contact zone. Such a slidingless test to characterize friction behavior is essentially the same as the method used in Reina et al..Reference Reina, Paynter, Hills and Dini26 These authors, however, used the Coulomb friction to model the interface microslip for their macroscopic contacts.
When analyzing the experimental curves in Fig. 2, the stiffness data at large indentation depths are fitted to Eq. (3) (typically starting at indentation depths at least twice the onset of the stiffness reduction regime). Second, the parameter δ z,crt, is determined by fitting curves in Fig. 2 to Eq. (6). As part of the fitting procedure, a small adjustment in the point of contact (typically up to a 1–2 nm magnitude offset in δz) is allowed to reflect uncertainties in detecting the sample surface. Finally, the friction stress τ 0 can be calculated by

This instrument is load controlled, and the displacement oscillation δ max is quite accurate, in contrast to the large uncertainty of δ max in AFM measurements. Using δ max = 0.7 nm and β = 1.57 gives an increase of τ 0 from 1.1 to 1.6 GPa as the sample orientation rotates from [110] to [001]. This variation (∼50%) is about twice as large as that (∼20%) of the elastic stiffness. Note that the surface normal is  , so that θ = 0º corresponds to the closely packed direction. Consequently, our discovery seems to suggest a Schmid-type phenomenon, i.e., the direction with the lowest friction stress corresponds to the easiest slip direction.
It is worthwhile to compare our friction anisotropy study to the literature work. The observed friction anisotropy in our system is similar to the earlier tests on Ni(100)/Ni(100) surface by using a custom-made tribometer in UHV condition,Reference Ko and Gellman14 which also concludes that the friction resistance correlates well to the easy slip direction. Note that these authors have intentionally contaminated the surface and still found a similar Schmid-type behavior, which is indirectly supported here since our experiments were conducted in ambient condition. The contact size in their work is orders of magnitude larger than ours. The friction anisotropy may arise from lattice structure mismatch or incommensurability.Reference Carpick and Salmeron2, Reference McGuiggan and Israelachvili9–Reference Gao13 For instance, a twist of mica-on-mica contact leads to rapid decrease of friction force in SFA tests with contact sizes larger than micrometers). Similar dependence on incommensurability has been routinely observed in AFM tests. It is often explained by the collective behavior of individual atoms hopping on the atomic-scale surface corrugation potential—atoms on the incommensurate surface move randomly so that the statistical average annihilates the friction force. Lastly, it is recently suggested that friction at small scales is facilitated by the nucleation and propagation of interface dislocations.Reference Gao13, Reference Hurtado and Kim27, Reference Hurtado and Kim28 Only one or a small number of dislocations can be accommodated in nanocontacts. As pointed by Hurtado and Kim,Reference Hurtado and Kim27, Reference Hurtado and Kim28 a contact size of 10–1000 nm in our work will accommodate sufficient number of dislocations so that the friction should resemble a continuum slip. To this end, our work differs from both nanoscale and microscale friction studies because continuum slip rather than discrete defects or individual atom hopping must dominate in the contact sizes studied here, thus leading to the so-called mesoscale friction anisotropy.
In summary, using a multidimensional nanocontact system, the lateral contact stiffness versus indentation depth measurements have been performed by a frequency-specific, continuous stiffness measurement technique with lateral oscillation amplitudes under 1 nm, a condition which excludes macroscopic sliding. The friction anisotropy is observed for contacts of 10–100 nm in size, which is larger than friction anisotropy studies by AFM and smaller than those by SFA or custom-made tribometers. Further studies are required to study how the governing mechanisms transition across these length scales.
ACKNOWLEDGMENTS
Financial support for this work was provided by the Science Foundation of Ireland Grant No. 08/IN.1/I1932 and the SFI CRANN CSET Grant (JN and GLWC), the National Science Foundation Grant No. CMMI 0900027 (YFG), the Joint institute of Advanced Materials at the University of Tennessee (EGH), and by the Center for Defect Physics, an Energy Frontier Research Center funded by the U.S. Department of Energy, Office of Basic Energy Sciences (YFG). The authors are grateful to Dr. Warren C. Oliver for help discussions on the multidimensional nanocontact system, and to Prof. John B. Pethica for providing the Ni sample.