Introduction
The United Nations define urbanization as the movement of people from rural to urban areas with population growth equating to urban migration (United Nation, 2005). United Nations projections suggest that the proportion of urban population will continue to increase and by 2030 nearly two-thirds of the global population will be in urban areas; this means that for the first time, more people in the developing world will live in urban areas than in rural areas. At the same time, the population living in urban areas is projected to gain 2.9 billion, rising from 3.4 billion in 2009 to 6.3 billion in 2050. Thus, the urban areas of the world are expected to absorb all the expected population growth over the next four decades while at the same time drawing in some of the rural population. Virtually all of the expected growth in the world population will be concentrated in the urban areas of the developing regions, whose population is projected to increase from 2.5 billion in 2009 to 5.2 billion in 2050 (United Nations, 2009).
Achieving the United Nation's Millennium Development Goals, the international community's unprecedented agreement on targets towards the eradication of extreme poverty and hunger, and access to health care for all, will depend to a large extent on how well developing countries' governments manage their cities (Cohen, Reference Cohen2006). The economies of the world have improved with escalating urbanization. However, the process of urbanization in developing countries is not the same as that of developed countries. With the adoption of Liberalization, Privatization and Globalization (LPG) policies, the socioeconomic structure of urban areas of developing countries is changing immensely. In many instances, particularly in the developing world, the speed of urban growth has outpaced the ability of governments to build essential infrastructure that makes life safe in cities and towns (Brockerhoff & Brennan, Reference Brockerhoff and Brennan1998).
Urbanization is such a powerful phenomenon that it has become a major determinant of public health in the 21st century (WHO, Reference Satterwaite1999). It is generally understood that city dwellers, on average, enjoy better health than their rural counterparts; therefore, increasing urbanization has led to the continuous improvement in average health status (Timæus & Lush, Reference Timaeus and Lush1995). However, health information for urban areas is usually aggregated to provide an average of all urban residents rather than disaggregated by socioeconomic status. Very little is known about socioeconomic inequalities in health that exist within urban areas because average health information masks urban inequalities.
Recently, the distributional dimension of health inequality has become prominent in the global health policy agenda, as researchers have come to regard average health status as an inadequate summary of a country's health performance (WHO, 2000). Healthy urbanization programmes should generate new resources and stimulate action to iron out urban health inequity in both developing and developed countries. According to the World Health Organization, 2010 was the landmark year for urbanization and health. For the coming years, WHO has pledged to focus on health issues arising from the urban phenomenon (WHO, 2008).
Studies on socioeconomic inequalities in urban health are very scarce. Only very few studies have provided evidence of the higher heterogeneity of urban areas in the way that they harbour pockets of severe poverty and deprivation, and exhibit a substantial concentration of ill-health among the poor (e.g. Weeks et al., Reference Weeks, Hill and Stow2005; Fotso, Reference Fotso2006). The urban poor are highly vulnerable to macroeconomic shocks that undermine their earning capacity and lead to them eating less nutritious and cheaper foods. People in urban slums are particularly affected due to lack of good housing, proper sanitation, proper education and quality health care. Economically they do not have back-up savings or large food stocks that they can draw on (WHO, 2000).
The emerging phenomenon of urbanization has proportionately brought about considerable health inequalities between different socioeconomic groups within regions and between regions. Though there are significant health inequalities within cities not many studies have made a systematic attempt to quantify them. It is globally well recognized that children are the most vulnerable group and the first to be affected by an unplanned and unhealthy urban environment and socioeconomic deprivation (Fosto, Reference Fotso2006). Child health inequality in urban areas has been a growing concern of health policy interventions in recent decades (Weeks et al., Reference Weeks, Hill and Stow2005; WHO, 2008).
Do urban health inequalities matter for India?
At present India has the world's second largest urban population, next to China, and is facing an unprecedented scale of urbanization (United Nations, 2005). According to the provisional Census of India (2011), 377 million people are residing in urban areas, constituting 31% of the total population, and this is projected to increase to 900 million by 2050. This will be more than 2.5 times the size of the United States of America's current population. In other words, almost a billion people or 55% of India's population will reside in urban India by 2050 (United Nations, 2008; Office of Registrar General of India, 2011). Demographic trends show that while urban average growth rate stabilized at 3% over the past decade (1991–2001), the slum growth rate doubled at 5–6%. An alarming feature of urban population growth is the large proportion of people living in poverty (Office of Registrar General of India, 2001).
By 2015, India will have 34 cities in the population size range of 1.5 million and above, four of which will have crossed the 10 million mark, with the city of Mumbai having the largest concentration of more than 27 million. Such population concentration trends in India will surely subject its cities to a more unequal risk of life and wealth distribution due to extreme environmental disasters. At present around 50% of the population live in urban areas in poor or acute poverty (Government of India, 2008). It is projected that the number of urban poor in India will double in just 5 years (Agarwal & Taneja, Reference Agarwal and Taneja2005; Office of Registrar General of India, 2006b; Sanke et al., Reference Sanke, Vittal and Dobbs2010).
Cities and urban areas are supposedly centres of growth, dynamism, vibrancy and economic development. Growing urbanization has led to the continuous improvement in the average household socioeconomic condition and child health status of India; however, urban slums lack basic amenities such as safe and adequate water supply, sewerage and sanitation (Marina, Reference Marina1999). Indian cities are virtual hotspots that foster huge regional disparities in living and health conditions (Goli et al., Reference Goli, Arokiasamy and Chattopadhaya2011). This has also fuelled a debate on the impact of urban growth on socioeconomic and regional inequalities in child health (Agarwal, Reference Agarwal2011). Questions that arise include (a) whether urbanization drives average health improvement leading to child health inequalities; (b) whether child health inequalities are the same across the least developed Empowered Action Group states (EAG) and the more developed South Indian states of urban India, given the socioeconomic and cultural diversity of Indian cities (Goli et al., Reference Goli, Arokiasamy and Chattopadhaya2011). Among the states of India, the South Indian states are ahead in terms of development and demographic transition, while the EAG states are at the bottom of the spectrum (Visaria, Reference Visaria, Dyson, Cassen and Visaria2004a, Reference Visaria, Dyson, Cassen and Visariab). It is important to know how inequalities in health vary with the level of development of states, especially in the context of previous studies that have shown that improvement in level of development is accompanied by rising health inequalities (e.g. Wagstaff, Reference Wagstaff2000, Reference Wagstaff2002a; Naschold, Reference Naschold2002; Wagstaff et al., Reference Wagstaff, Doorslaer and Wantanbe2003; Graham & Kelly, Reference Graham and Kelly2004). The notable socioeconomic and demographic disparities across the cities of the EAG and South Indian states provide an ideal comparative setting for assessing child health inequalities.
To understand these critical questions, it is important to set aside the misconceptions that have prevented the health needs of urban populations from being fully appreciated. There is an urgent need to recognize and determine the social and economic distributional disparities among the urban population who are at different levels of development; this includes large groups of the urban poor whose health environments differ from those of the higher socioeconomic class.
Although a few previous studies (e.g. Agarwal & Taneja, Reference Agarwal and Taneja2005; Agarwal, Reference Agarwal2011; Kumar & Mohanty, Reference Kumar and Mohanty2011) have measured child health differentials within urban India, these studies have serious limitations on account of the method of quantifying the level of differentials and accuracy of estimations in terms of inequalities and the critical pathways that determine such inequalities. Decomposition analysis of inequalities in health can explore these pathways. No previous study has so far specifically focused on decomposing health inequalities in urban children, particularly in a varying regional and developmental context. The objectives of this study are two-fold: (1) the assessment of the socioeconomic inequalities in child health and the relative contribution of socioeconomic factors to total health inequalities among urban children in India; (2) the comparative assessment of health inequalities among urban children in the less developed EAG states and more developed South Indian states.
Data and Methods
The study uses data from the National Family Health Survey 2005–06 (NFHS-3), which is equivalent to the Worldwide Demographic and Health Survey (DHS). The DHS is the standardized survey over 80 countries with over 240 surveys worldwide. The sampling procedures and questions in these surveys are in a standard format across all countries. The NFHS-3 is the third survey in the series co-ordinated by the International Institute for Population Sciences (IIPS) and Macro International under the aegis of the Ministry of Health and Family Welfare, India. It provides information on important indicators of maternal and child health, fertility and mortality. In this paper, child-health-related information and household and parent socioeconomic information are used to estimate socioeconomic inequalities in child health.
This study focuses on a sample of urban children in the less developed EAG states of Rajasthan, Bihar, Uttar Pradesh, Madhya Pradesh, Odisha, Chhattisgarh, Uttaranchal, and Jharkhand and the more developed South Indian states of Tamil Nadu, Kerala, Karnataka and Andhra Pradesh. The sample of urban children is taken for two age groups, i.e. under age 5 and age 12–23 months. For immunization coverage, children in the age group 12–23 months are considered and for the nutritional indicators children under age 5 are considered. The outcome and predictor variables in the analysis are discussed below.
Outcome variables
Child health inequalities are assessed using the following child health indicators:
• Full immunization coverage
• Height-for-age (stunting)
• Weight-for-age (underweight)
Full immunization coverage
The NFHS-3 collected information on vaccination coverage for all living children born during the 5 years preceding the survey. According to guidelines developed by the World Health Organization (WHO, 1998), children in the age group 12–23 months who received one vaccination against tuberculosis (BCG), three doses each of the diphtheria, whooping cough and tetanus (DPT) vaccine, three doses of the poliomyelitis (polio) vaccine and one dose of the measles vaccine are considered to be fully immunized. For the analysis, a binary outcome variable of whether or not each of the live-born children aged 12–23 months of the women interviewed was immunized was calculated.
Nutritional indicators
The NFHS-3 included anthropometric components in which all children under 5 years of age were weighed and measured. The two standard indices of physical growth that describe child nutrition included in this analysis are height-for-age (stunting) and weight-for-age (underweight). These indicators are measured in terms of standard deviation units (Z-scores) from the median of the reference population. The estimates are based on a new international reference population recommended by the World Health Organization in April 2006 (WHO Multicenter Growth Reference Study Group, 2006). The indices provide information about growth and body composition. Children in the age group under 5 years are considered for the analysis. Children whose height-for-age Z-score is below minus two standard deviations (–2SD) from the median of the reference population are considered to be stunted (short for age). Weight-for-age is a composite index of height-for-age and weight-for-height. It takes into account both acute and chronic malnutrition. Children whose weight-for-age is below –2SD from the median of the reference population are classified as underweight. For the analysis, the binary outcome variable of whether an under-5 child's growth was as below –2SD or above –2SD for both height-for-age and weight-for-age was calculated.
Predictor variables
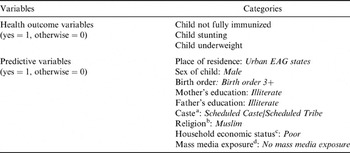
A long-standing issue in the literature on health inequality is whether all inequalities should be measured or just those that show some systematic association with health. However, it is largely accepted that measurement of socioeconomic inequality can be based on those indicators that are systematically associated with the health standing of a population (Gakidou et al., Reference Gakidou, Murray and Frenk2000; Wagstaff, Reference Wagstaff2002b; O'Donnell et al., Reference O'Donnell, van Doorslaer, Wagstaff and Lindelow2008). Therefore, the predictor variables were selected based on a systematic review of the literature (for example, Wagstaff, Reference Wagstaff2000, Reference Wagstaff2002a; Wagstaff et al., Reference Wagstaff, Doorslaer and Wantanbe2003; Hosseinpoor et al., Reference Hosseinpoor, Doorslaer and Speybroeck2006; Joe et al., Reference Joe, Mishra and Navaneetham2009; Pradhan & Arokiasamy, Reference Pradhan and Arokiasamy2010; Agarwal, Reference Agarwal2011). Table 1 provides a description of the health and predictor variables considered for decomposition analysis. The decomposition analysis is confined to nine critical socioeconomic factors that could explain the maximum dimension of socioeconomic inequality in child health, particularly in developing countries like India. The predictor variables are (i) place of residence, (ii) sex of the child, (iii) birth order, (iv) mother's education, (v) father's education, (vi) caste, (vii) religion, (viii) wealth quintile (household economic status), and (ix) mass media exposure.
List of variables included in the decomposition analysis

a The modern caste system in India includes the following four major groups, from low to high social status: (1) Scheduled Castes (SC), making up 16% of the total population of India (around 160 million), (2) Scheduled Tribes (ST), generally consisting of tribal groups, constituting 7% (around 70 million); (3) Other Backward Classes (OBC), consisting of more than 3000 castes, constituting around 52%, and are socially better off than SCs/STs, but backward compared with other castes; (4) Other Castes, including all forward castes and generally have a higher socioeconomic status. Non-Scheduled Castes in this study include OBCs and other forward castes.
b Re-coded as Muslim or non-Muslim (all other religious groups).
c The NFHS-3 constructed a household wealth index based on data from 10,9041 households. Wealth quintiles were based on 33 assets and housing characteristics; each household asset was assigned a weight (factor score) generated through principal component analysis, and the resulting asset scores standardized in relation to a normal distribution with mean of zero and standard deviation of one. The wealth quintile distribution was used to determine poor–rich households: the poorest and poorer are here recorded as ‘poor’ and ‘middle’, and the richer and richest wealth quintile as ‘non-poor’.
d Based on mother's exposure to both print and electronic media such as newspapers, radio and television, it was categorized as ‘mother has mass media exposure’, otherwise ‘no mass media exposure’.
Accordingly, the predictor variables for the decomposition analysis are dichotomized to indicate their advantageous and disadvantageous status. These include: place of residence (urban EAG states/urban non-EAG states), sex of the child (male/female), birth order (<3 or ≥3), education of mother (illiterate/literate), education of father (illiterate/literate), caste (Schedule Caste/Tribe (SC/ST)/non-SC/ST), religion (Muslim/non-Muslim), economic status (poor/non-poor) and mass media exposure (no mass media exposure/have mass media exposure). The predictive variables are dichotomized in a way that all the variables reflecting lower socioeconomic status are coded as 1 and 0 otherwise. Similarly, the dependent (health) variable is coded as 1 reflecting a poor health outcome, and 0 reflecting a good health outcome.
Statistical analysis
Statistical analysis was performed using STATA version 10.1 (Stata Corp LP, College Station, TX, USA) and Microsoft Excel. Previously used heath inequality measures such as concentration indices (CIs) only show the degree of socioeconomic inequality and do not throw sufficient light on the mechanism through which inequality occurs; therefore in this paper the decomposition of inequalities in child health is carried out following the method proposed by Wagstaff et al. (Reference Wagstaff, Doorslaer and Wantanbe2003). Moreover, the decomposition of inequalities in child health is critical to explore the pathways that lead to socioeconomic inequalities in child health and will also reveal the proportional contribution of socioeconomic variables to health inequalities (Wagstaff et al., Reference Wagstaff, Doorslaer and Wantanbe2003; O'Donnell et al., Reference O'Donnell, van Doorslaer, Wagstaff and Lindelow2008; Pradhan & Arokiasamy, Reference Pradhan and Arokiasamy2010; Arokiasamy & Pradhan, Reference Arokiasamy and Pradhan2011).
The decomposition of child health inequalities in urban India was carried out in two stages. In the first stage, child health inequalities were examined using CIs. In the second stage, decomposition analysis was carried out according to the steps described by Wagstaff et al. (Reference Wagstaff, Doorslaer and Wantanbe2003), Hosseinpoor et al. (Reference Hosseinpoor, Doorslaer and Speybroeck2006) and O'Donnell et al. (Reference O'Donnell, van Doorslaer, Wagstaff and Lindelow2008):
(a) The coefficients of the explanatory variables (βk) were estimated by regressing the health variables through a linear regression model for its socioeconomic predictors.
(b) The means of the health variable and each of its predictors (μ and xk) were estimated.
(c) Concentration indices for the health variable and its predictors (C and Ck) were estimated using eqn (1), along with the generalized concentration index of error term (GCε), where yi and μ are the value of the predictors for the ith individual and the predictor's mean, respectively.
(d) The absolute contribution of each predictor was estimated by multiplying the health variable elasticity with respect to the predictor and its concentration index:
. $$\left (\beta_k x_k \over \mu \right )C_k$$
(e) The percentage contribution of each predictor was calculated by dividing its absolute contribution by the concentration index of the health variable:
.$$\left (\beta_k x_k \over \mu \right ){C_k \over C}$$


The decomposition analyses were separately undertaken for the three dependent child health variables: (a) child not fully immunized, (b) child stunting and (c) child underweight. The above-mentioned steps were carried out adopting the given mathematical equations. The equation below gives the CI, which was computed as twice the (weighted) covariance of the health variables and a person's relative rank in terms of economic status, divided by the variable mean. The children were ranked in ascending order by household living standard in order to find out the cumulative fraction of, for example, children not fully immunized by their economic status (Wagstaff et al., Reference Wagstaff, Pact and Doorslaer1991).
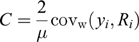 $$C={2 \over \mu} {\rm cov}_{\rm w} (y_i,R_i)$$
, where yi is the health status of the ith individual and Ri is the fractional rank of the ith individual (for weighted data) in terms of the index of household economic status; μ is the (weighted) unconditional mean of the health variable of the sample and covw denotes the weighted covariance. It reveals the concentration of inequalities among the subgroups of population. The weights are used to adjust for the design effect of the sample survey data. The value of CI lies between −1 and +1, where a negative value implies a concentration of outcome variable among disadvantageous groups and a positive value implies concentration among advantageous groups. A zero value of concentration index implies no inequality.
Wagstaff et al. (Reference Wagstaff, Doorslaer and Wantanbe2003) proposed the following linear regression model that links the health variable of interest, y, to a set of k health determinants, xk. This linear regression is estimated separately for each of the health variables, i.e. children not fully immunized, underweight children and stunted children, by linking them to the socioeconomic predictors explained in Table 1. The same predictors were used for all the child health indicators.
 $$y_i = \alpha + \sum \beta_kx_{ki} + \epsilon_i$$
, where εi is an error term. Given the relationship between yi and xki in eqn (2), the concentration index for y (C) can be written as:
 $$\sum \left( {\beta_k x_k \over \mu } \right) C_k + {GC_\epsilon \over \mu} = C_y = {GC_\epsilon \over \mu}$$
The above equation shows that C is made up of two components. The first is the deterministic or ‘explained’ component. This is equal to a weighted sum of the concentration indices of the regressors, where the weights are elasticities (elasticity is a unit-free measure of [partial] association, i.e. the percentage change in the dependent variable [child health variables] associated with a percentage change in the predictor variables), (βkxk/μ) of y with respect to each xk, the second is a residual or ‘unexplained’ component (GCε/μ), where GC is the generalized concentration index. The explained component reflects that proportion of inequalities in the dependant variable (health variable) that is explained by the systematic variation in the selected predictors, i.e. xk. The unexplained component reflects that part of inequalities that could not be explained by the selected predictors across socioeconomic groups.
Results
Socioeconomic and demographic profiles of the EAG and South Indian states
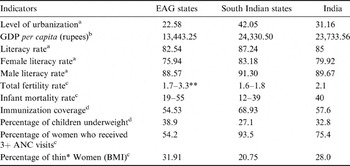
India's states and regions are at different stages of urbanization and socioeconomic and health transition. In accordance with state and regional variations, Indian cities are at different levels of socioeconomic and demographic progress due to their histogenesis, geographic location and industrial development (Goli et al., Reference Goli, Arokiasamy and Chattopadhaya2011). Therefore, to understand urban regional health variations, it is necessary to highlight region-specific socioeconomic variations in order to understand the urban health inequalities. Table 2 compares the socioeconomic and demographic differentials in urban areas of the EAG and South Indian states selected for the study. The results show substantial differences in level of urbanization and socioeconomic conditions between the two groups of states. The Gross Domestic Product (GDP) per capita of the South Indian states is (24,330 rupees), slightly more than all-India average of 23,733 rupees, but almost twice that of the EAG states (13,443 rupees). The performance of the EAG states in almost all social indicators is a long way behind that of the South Indian states. The total fertility rate (TFR), and the percentage of underweight children and of anaemic women in the EAG states, are much higher than the national average and those of the South Indian states. The TFR of the EAG states is 2.68, which is two-thirds higher than that of the South Indian states (1.7). The infant mortality rate for urban India is 40, which drops down to 31 in the South Indian states but rises sharply to 45 in the EAG states (Table 2). Overall, the South Indian states are at the better end of the scale, while the EAG states are at the lower end of the socioeconomic and demographic spectrum. Such striking contrasts between the developed South Indian states and the developing EAG states provide an ideal setting for comparative assessment of child health inequalities.
Socioeconomic and demographic factors for EAG states and South Indian states, urban India
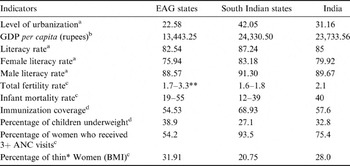
a Source: Census of India, 2011 (Office of Registrar General of India, 2011), New Delhi; the figures indicate the proportion of population residing in urban areas.
b Source: Indiastat.com (Data Net India Private Limited, 1981–2005); figures are the rural–urban average.
c Source: Sample Registration System, 2006 (Office of Registrar General of India, 2006a).
d Source: author calculations based on NFHS-3 data (IIPS & Macro International, 2007).
* Defined as a woman with a BMI <18.5 kg/m2.
** Excludes Chhattisgarh, Jharkhand and Uttaranchal as data for TFR are not available in the Sample Registration System, 2006.
Descriptive statistics of study population
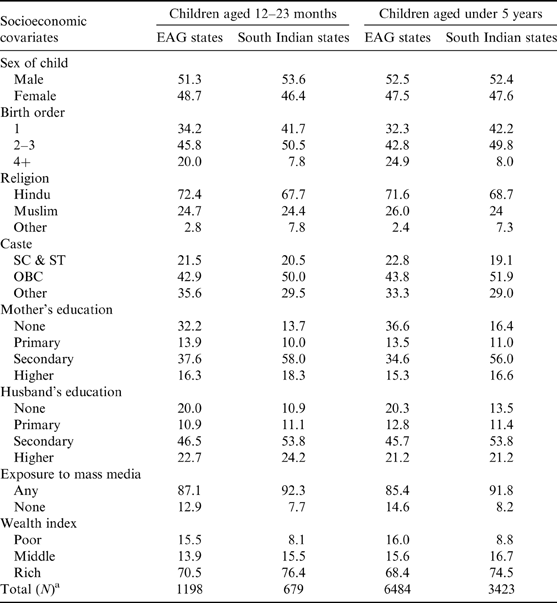
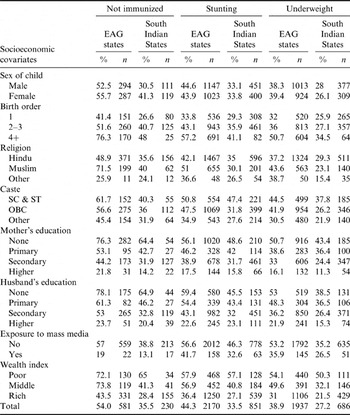
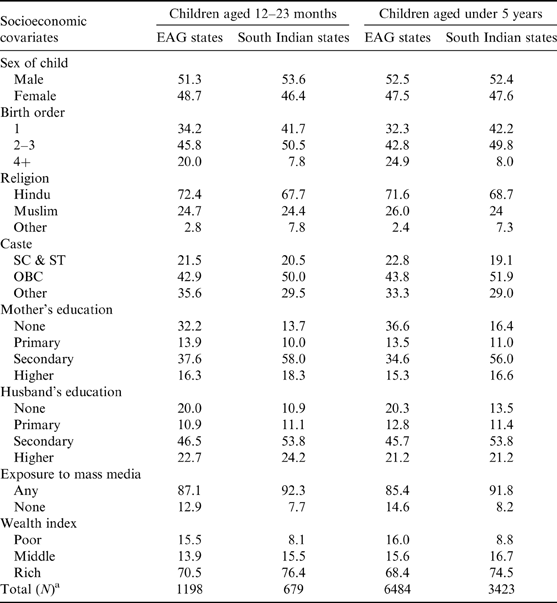
Table 3 presents the descriptive statistics of the child population considered for analysis in the EAG and South Indian states. Children in the age group 12–23 months are considered for immunization coverage and children under age 5 years for the nutritional status indicators, i.e. stunting and underweight. The sample size of the child population aged 12–23 months is 1198 and 679 in the EAG and South Indian states, respectively. In the case of children under age 5, the sample is 6484 and 3423 in the EAG and South Indian states, respectively. The sample distribution across the different socioeconomic characteristics indicates that the size of the sample is adequate to carry out robust estimations (Table A1).
Percentage distribution of children in the age groups 12–23 months and under 5 years in EAG and South Indian states, urban India, 2005–06
a Unweighted number of sample taken for analysis.
Child health inequalities in urban India
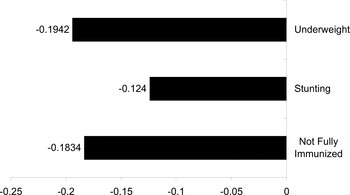
Figure 1 shows the CI values for urban India as a whole for the three child health indicators: absence of full immunization coverage, stunting and underweight. The CI values are negative for all three indicators, which implies absence of full immunization coverage and that stunting and underweight are more widely prevalent among children living in households of poor socioeconomic status. However, the socioeconomic inequalities in child health, as indicated by CI values, are most striking for underweight (−0.19420) followed by not fully immunized (CI=−0.18340) and stunting (−0.12400).
Concentration indices for child health indicators in urban India.

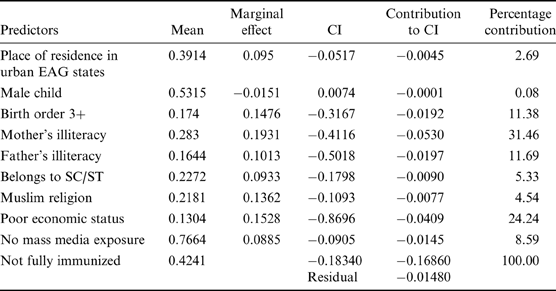
Table 4 presents the CI values and the contribution of demographic and socioeconomic predictor variables based on decomposition analysis for the child health indicator ‘children not fully immunized’ for urban India. The results reveal that, apart from sex of the child, all other predictors show a negative CI indicating socioeconomic inequalities are more concentrated among socioeconomically disadvantageous groups. The second column of the table shows the mean values of the health variable and the predictors. It shows that 42% of the children are not fully immunized in urban India. The marginal effect given in the third column of the table reflects the type of association between the health variable and predictors. The results reveal that, except for male children, all other covariates are positively associated with children not being fully immunized, i.e. with an increase in a predictor variable such as mother's illiteracy, there will be an increase in children not fully immunized. Poor household economic status has a greater absolute level of association with children not fully immunized, followed by mother's and father's illiteracy. Commensurate with the marginal effect, the CI values for full immunization coverage show huge levels of socioeconomic inequality in child full immunization coverage. However, the results of proportional contribution to CI indicate that mother's illiteracy is the highest contributor (31%) to inequality in children not fully immunized, followed by poor economic status (26%), father's illiteracy (12%) and birth order 3+ (11%). The proportion of inequalities that remains unexplained is very small, i.e. −0.01, which means that only 8% (−0.183) of inequalities are unexplained and the rest (92%) are explained by the selected socioeconomic predictors.
Effects and contribution of predictor variables based on decomposition analysis for children not fully immunized, urban India, 2005–06
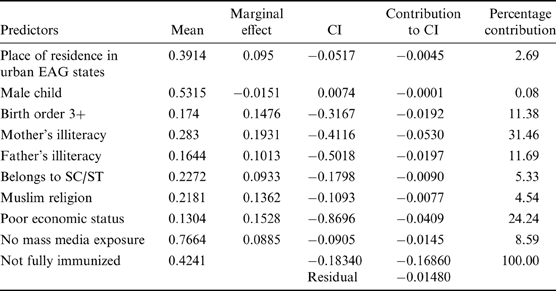
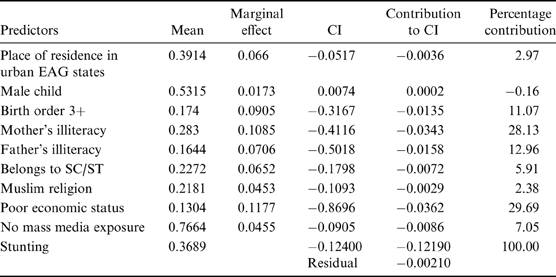
Table 5 presents the CI values and the contribution of predictor variables based on decomposition analysis for child stunting in urban India. The results show that 36% of children are stunted. The marginal effect shows a positive association with stunting for all the covariates, unlike for children not fully immunized. For child stunting, both the CI and decomposed proportional contribution to total child health inequality reveal that child stunting is highly concentrated among children from households of poor economic status (29%), closely followed by mothers with no education (28%). The value of the residual, i.e. unexplained component is −0.002, which implies that for child stunting the covariates explain 98% of inequalities, i.e. more than that explained for children not fully immunized.
Effects and contribution of predictor variables based on decomposition analysis for stunting, urban India, 2005–06
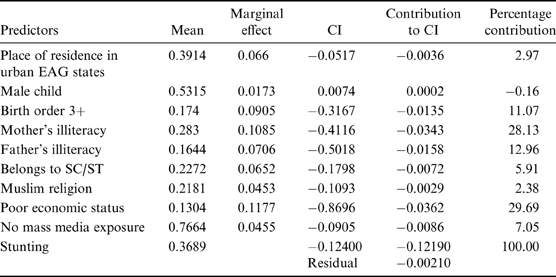
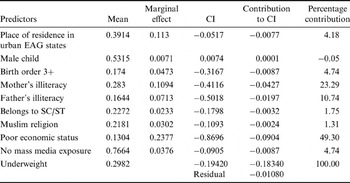
Table 6 presents the results of the decomposition analysis for child underweight in urban India. The results show that 38% of children are underweight. Consistent with the results of child stunting, the marginal effect reflects the positive association of all covariates with child underweight. The CI and decomposition results indicate that underweight children are greatly concentrated in households of poor economic status and among illiterate parents. Poor economic status is the largest contributor to children being underweight (51%), followed by mother's illiteracy (24%) and father's illiteracy (11%). The model explains 94% of inequalities among the underweight children as the value of the residual is only −0.01.
Effects and contribution of predictor variables based on decomposition analysis for child underweight, urban India, 2005–06

Overall, the results for all three child health indicators reveal that poor economic status of the household and parent's illiteracy are the key predictors that contribute to the total inequalities in health among urban children in India. This implies that the wealthiest households and literate parents have better health-care-accessing capabilities than their poor and illiterate counterparts. Another important outcome of the above results is that the residual (unexplained part) is very small for all the child health indicators, confirming that selected predictors best explain socioeconomic inequalities in child health indicators.
Comparison of health inequalities among urban children between EAG and South Indian states
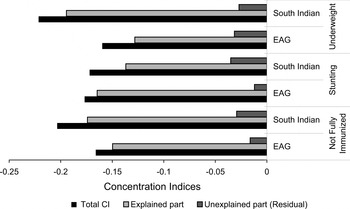
Figure 2 compares the assessment of inequalities in child health between the EAG and South Indian states. The negative outcome of selected child health variables is found to be concentrated in disadvantageous socioeconomic groups in both the EAG and South Indian states, as reflected by the negative values of the CIs. However, the inequalities in child health are more pronounced in the South Indian states than the EAG states, implying higher levels of health inequalities among urban children in more developed states compared with less developed states. Evidentially, the level of health inequalities among urban children is not necessarily negatively associated with the level of development or progress in average health. However, among the selected child health indicators, the inequalities are more pronounced for child underweight than for the other child health indicators in both the EAG and South India states.
Concentration indices for child health indicators in South Indian and EAG states.
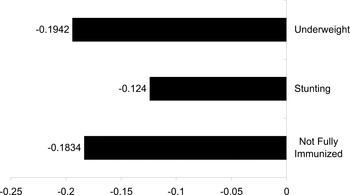
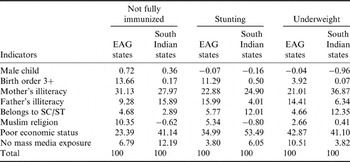
Table 7 compares the decomposition results of health inequalities for the three child health indicators in the EAG and South Indian states. The decomposition outcomes of CI for children not fully immunized reveal that in the EAG states, the largest contribution to health inequality among urban children is attributable to mother's illiteracy (31%); in contrast poor household economic status (41%) is the largest contributor to child health inequality in the South Indian states. Muslim religion and child of birth order 3+ are other factors that contribute significantly to inequality in immunization coverage in the EAG states. By contrast, the contribution of religion and birth order indicators to health inequalities among urban children is much less in the South Indian states.
Effects and contribution of predictor variables based on decomposition analysis for selected child health indicators in EAG and South Indian states, urban India, 2005–06
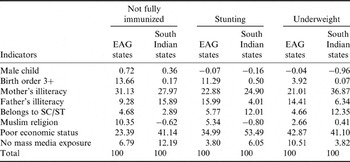
For the child nutrition indicators (stunting and underweight), poor household economic status emerges as the main contributor to total child health inequality among urban children, followed by mother's and father's illiteracy in both the EAG and South Indian states. This pattern of results confirms the strong association between household economic condition and child nutrition. Among the other background variables, SC/ST caste shows considerable contribution to inequality in child nutritional status in the South Indian states, but is a less significant factor in the EAG states. Among the demographic variables, child birth order 3+ contributes considerably to inequality in child nutritional status for the EAG states but has a much lesser contribution in the South Indian states.
Overall, the decomposition analysis provides evidence that inequality for the child health indicators is mainly accounted for by poor economic status, mother's illiteracy and SC/ST caste in the South Indian states. In contrast, parent's illiteracy is a key determinant of inequalities in child immunization and poor household economic status in child nutrition among urban children in the EAG states. Interestingly, for two of the three child health indicators, the contribution of mass media exposure to child health inequalities is more prominent in the South Indian states compared with the EAG states.
Discussion and Conclusion
India's unprecedented urbanization represents a huge opportunity for increasing the quality of life of urban people, but it also poses formidable challenges for dealing with mounting socioeconomic urban disparities and rising health inequalities. The results of decomposition analyses of inequalities for three child health indicators by their socioeconomic predictors reveal distinguishable contributions in order of their importance. Poor economic status emerges as a critical determinant of child nutrition; and mother's illiteracy is the key determinant for children not being fully immunized. However, child underweight is more sensitive to changes in socioeconomic inequalities and has a less pronounced association with development.
Comparative assessment indicates, in order of their importance, more pronounced contributions of household poor economic status, parent's illiteracy and caste in the South Indian states; whereas, parent's illiteracy, poor economic status and being Muslim have greater contributions to the total child health inequalities in the EAG states. Compared with the EAG states, the levels of socioeconomic inequalities in child health are more pronounced in the South India states, implying that the levels of inequalities in child health are not necessarily negatively associated with levels of development across the states. In a similar vein, the results also imply that levels of inequality in child health are not necessarily negatively associated with average health improvement. This is in accordance with previous literature, which found that progress in average health is not necessarily associated with reduced health inequalities (Wagstaff, Reference Wagstaff2002a).
The pattern of varying contributions of socioeconomic factors to child health inequalities between the more developed South Indian states and the less developed EAG states suggests the need to adopt different strategies of health policy intervention. First, average levels of the child health indicators are insufficient for determining the right approach to health intervention programmes. Second, the findings provide a useful basis for a region-specific urban health policy intervention approach: for instance, to improve child immunization coverage, increasing the educational levels of parents is critical in the EAG states, whereas improving the household economic status of disadvantageous populations is crucial in the South Indian states. Health policy interventions have to focus ideally on both health averages and within- and between-group inequalities, but should be based on region-specific evidential outcomes on varying contributions by socioeconomic factors. Third, the results suggest that progress in economic growth and average of literacy and health outcomes cannot be expected to lead to a reduction in inequality among urban children in India.
Public health and social policy initiatives and programmes aimed at reducing social disparity and income-related inequality in health should be targeted at specific dimensions of health for specific populations. The health goals for urban India have to focus on equitable access to quality health care across a varying socioeconomic spectrum to achieve a healthy and sustainable urban India. Achieving health equity for India's urban children remains a critical challenge of India's urban health mission.
Percentage of children not fully immunized, stunted and underweight in EAG and South Indian states, urban India, 2005–06