I. INTRODUCTION
3D stacked integrated circuits (3D ICs) with vertical through-silicon vias (TSVs) are complex structures formed with materials that have very different thermal and mechanical properties. During wafer-level manufacturing, assembly, and packaging operations, the 3D ICs are exposed to a number of thermal cycles. Due to the material property differences like the coefficient of thermal expansion (CTE) between the constituent materials, these thermal cycles lead to thermomechanical stresses in the 3D ICs.Reference Wunderle, Mrossko, Wittler, Kaulfersch, Ramm, Michel, Reichl, Bower, Garrou, Ramm and Takahashi1 The process induced thermomechanical stresses could alter the carrier mobility in the MOSFET transistor channel.Reference Karmarkar, Xu and Moroz2 Furthermore, the mechanical stresses affect the reliability of Cu/low-k backend-of-line (BEoL) structures due to the so-called chip–package interaction (CPI) and may lead to cracks and failures.Reference Lu, Zhang, Ryu, Huang, Ho, Zschech, Ho and Ogawa3, Reference Karmarkar, Xu, Ramaswami, Dukovic, Sapre, Bhatnagar, Bartha, Borst, DeNardis, Rao, Kim, Naeemi, Nelson, Ro and Toma4 All of these effects and their correlations with various material and geometry parameters can be examined using physics-based models and advanced numerical simulation tools.Reference Sukharev, Kteyan, Khachetryn, Hovsepyan, Torres, Choy, Markosian, Zschech, Ho and Ogawa5, 6 The applications of simulation tools for designing 3D ICs with high transistor and interconnect density, however, require knowledge of materials behavior at extremely small dimensions and its correlation with the numerical results. Here, nanoindentation and electron backscatter diffraction (EBSD) methods are used to determine the elastic anisotropy and the orientation of Cu grains in a TSV.
During the previous decades, many indentation analysis approaches were developed to extend the measurement of elastic modulusReference Li, Randall and Vlassak7 and fracture toughnessReference DeBoer and Gerberich8, Reference Yeap, Zeng and Chi9 to the submicrometer length scale. It is a well-known fact that large indentations (several-100 nm) on an elastically anisotropic material, e.g., Cu and Si, result in an elastic–plastic deformation, and the analysis of the elastic unloading curve yields a weighted average elastic modulus which depends on the orientation of the Berkovich tip with respect to the solid.Reference Hill10–Reference Kumar, Rabe, Hirsekorn and Arnold12 Vlassak and NixReference Vlassak and Nix11, Reference Vlassak and Nix13 showed that the well-known Oliver and Pharr’s (O&P) analysis on the unloading curveReference Oliver and Pharr14 is still applicable on elastically anisotropic materials, as long as the resulting E R value is corrected with the Poisson’s ratio and the shear anisotropy factor.
However, for small indentations (sub-10 nm), the deformation may be fully elastic, i.e., the unloading curve follows exactly the same path as the loading curve, and consequently, the whole indentation load–penetration (P–h) curve consists of loading–unloading curve can be described by the Hertzian elastic theory.Reference Timoshenko and Goodier15 Interestingly, the E R values determined by the Hertzian curve fitting on the loading–unloading curves of small indentations are significantly different from those values determined by the O&P analysis on the unloading curve of large indentations.Reference Vlassak and Nix13, Reference Dub, Lim and Chaudhri16–Reference Wang and Lu18 Particularly, the elastic modulus values of Cu single crystals obtained from small indentations are much closer to the unidirectional values, i.e., uniaxial tensile values, than to the average values.
The thermal cycles during the semiconductor manufacturing process increase the Cu grains size in TSVs. As the grain size increases, for TSVs with small via diameter, the top-end or the bottom-end may be composed by one or two Cu grains only. Since the single crystalline copper has strong elastic anisotropy, simulations based on isotropic material properties that correlate with polycrystalline copper may result in inaccurate thermomechanical stress prediction for TSVs with single grains at the via top.
This article presents an experimental study on the transition of elastic modulus from average values to unidirectional values for the Cu single crystals, as the indentation deformations reduce from several-100 nm to sub-10 nm depths. The nanoindentation study of elastic anisotropy of Cu is extended to the single grain at a cross section of a TSV. Based on the indentations on Fe–3%Si alloys with grain sizes of several millimeters, Pathak et al.Reference Pathak, Stojakovic and Kalidindi19 have shown the procedure to determine the elastic modulus of an individual grain by the Hertzian model. This study presents the extension of the measurement procedure to determine the reduced modulus, E R, of an individual grain with several micrometers diameter. Furthermore, to demonstrate the importance of Cu microstructure and elastic anisotropy measurements toward the design of 3D ICs, technology computer-aided design (TCAD) simulation is used to evaluate the impact of Cu elastic anisotropy on the thermomechanical stress field and the carrier mobility variation in the active silicon region around a TSV with one single grain at the via top.
II. SAMPLES
The samples used in this study are Cu single crystals and Cu-filled TSV arrays. The preparation of the Cu single crystals begins with the Bridgman casting process using high-purity Cu (99.9% purity). Three Cu crystals were cut from the Cu ingot by electrical discharge machining at (100), (110), and (111) planar orientations. The Cu(100), Cu(110), and Cu(100) samples were grinded mechanically, then polished firstly with alumina and subsequently electrolytically. The electrolytic polishing was performed using Struers Elektrolyt-D2 (Struers, Ballerup, Denmark) at room temperature with a 1-mm2 mask (applied voltage = 20 V; flow rate = 13; duration = 15 s). An acidic solution (1 g of citric acid dissolved in 50 mL of DI water) was used to etch away the oxide layer prior to the indentation tests. The surface roughness after the chemical etching process was found to be 2 nm by scanning-probe microscopy (SPM) method.
The Cu-filled TSV array was fabricated using the industrial electrochemical deposition process. Before filling the TSVs with Cu, an oxide liner (300 nm), a TaN barrier layer (50 nm), and a Cu seed layer (500 nm) were deposited. The dimensions of the TSVs are (a) 10 μm diameter and 50 μm length and (b) 5 μm diameter and 50 μm length. A cross section along the axis of the TSV was then prepared by mechanical grinding and polishing. The surface of the Cu grains at the TSV cross sections after mechanical polishing had a very high roughness. Focused ion beam (FIB) milling was performed on the cross-section surface of the TSV with a very small ion beam dose (current=80 pA, voltage=30 mV) to prepare some very flat topographic hills and valleys, which define the Cu grains on the planar surface. The ion channeling contrast was used to image the Cu microstructure. All indentation tests on Cu TSVs were performed immediately after the FIB milling, to keep the native oxide relatively thin while E R was measured.
III. EXPERIMENTAL METHODOLOGY
All the indentation experiments in this study were performed using the Hysitron Triboindenter TI-950 system (Hysitron, Minneapolis, MN). Two Berkovich tips with different tip radius, R, were used in this study. The values of R for the two tips are 114 and 250 nm as calibrated based on the Hertzian fitting of the fully elastic P–h curves from small indentations (h < 10 nm) on fused quartz. The Berkovich tip with the large radius was used intentionally to facilitate the fully elastic response on the Cu crystals. Cu has a very low yield stress and may show a mixture of fully elastic or elastic–plastic responses even with this precaution. To identify the indentation response (fully elastic or elastic–plastic), the low noise floor indentation equipment (force noise floor <30 nN and displacement noise floor <2 Å) with an accurate experimental control (feedback rate, 78 kHz) and a low inertia of the moving parts (<250 mg) was used. The indentation experiments were performed under closed-loop displacement-control mode. The load function can be divided into three test segments: loading to the target maximum depth (5 s), holding at the maximum depth (2 s), and unloading until the tip is completely removed (5 s). The zero-depth position was determined by lifting the tip by 10 nm after the surface was found and re-approach at an adjacent point with an offset of 2 μm from the initial point (tip approach speed = 0.1 μm/s; preload = 100 nN). During the tip lift-off and re-approach, almost no adhesion force was detected. The drift rate at the initial load of 0.5 μN is less than 0.05 nm/s.
To calculate the theoretical E R values and to correlate them with the values measured by nanoindentation, it is essential to know the Cu grain orientations. The grain orientations can be represented by the (hkl)<uvw> indexes. (hkl) refers to the plane perpendicular to the vector of the indentation direction, while <uvw> refers to the crystal direction aligned with the reference direction of the sample. In this study, the grain orientations were determined by EBSD measurements using the Carl Zeiss Supra 40VP scanning electron microscope (SEM; Carl Zeiss, Oberkochen, Germany) in combination with the TSL EDAX system (TSL OIM Data Collection 5 software; EDAX, Mahwah, NJ). The following parameters were used for the EBSD measurements: acceleration voltage 20 kV, aperture 60 μm, working distance 10 mm, and scan step size 50 nm. The received EBSD scans were further analyzed using the TSL OIM Analysis 5 software. The (hkl)<uvw> average indexes were estimated only within the grains that were used in nanoindentation experiments. Subsequently, the misorientation angles from the (hkl) planes to the {001}, {101}, and {111} directions were calculated by arc cosine of “dot” product of two vectors. The smallest angle was chosen as the nearest misorientation angle. This misorientation angle represents the smallest angle which the lattice should be rotated to be parallel to the nearest plane of {001}, {101}, or {111}.
IV. INDENTATION ANALYSIS
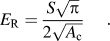
While the indentation tests are performed, load and penetration depth are recorded continuously. The load–penetration (P–h) curves can be analyzed to determine the reduced modulus, E R, i.e., the combined elastic properties of the tip and the sample, using the Oliver and Pharr (O&P) analysisReference Oliver and Pharr14 or the Hertzian analysis.Reference Timoshenko and Goodier15 In the O&P analysis, the unloading curve is fitted with a power law equation, and the contact stiffness, S, is given by the initial slope of the unloading curve at maximum load. Using Sneddon’s contact mechanics model,Reference Sneddon20E R can be determined by
The contact area, A c, is given by the indenter area function, which contains the geometrical information on how the cross-sectional tip area evolves with the penetration depth. The indenter area function of a Berkovich tip can be determined using a fused quartz standard sample. However, the very end of a Berkovich tip geometry does not follow the ideal Berkovich shape, it is rather similar to a section of a sphere. The radius of the sphere section can be calibrated using the Hertzian model and a standard sample, e.g., quartz.
The O&P analysis can be used in both circumstances where the material behavior is fully elastic or elastic–plastic. On the other hand, the Hertzian analysis [Eq. (2)] applies only to the fully elastic P–h curves. With a predetermined tip radius, R, the E R value can be measured by fitting the following equation,
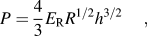
to the fully elastic P–h curve. With R >> h for small indentations, an important criterion of the Hertzian analysis is fulfilled.Reference Timoshenko and Goodier15 Another criterion for the Hertzian analysis is the fully elastic P–h curve. The unloading curve is usually found to be elastic,Reference Sneddon20 except for some rare materials that show reverse plasticityReference Cross, Schirmeisen, Grutter and Durig21 or phase transformationsReference Domnich, Gogotsi and Dub22 during unloading. Therefore, it can be assumed that full elasticity has been achieved at the absence of a hysteresis between the loading and the unloading curve.Reference Chudoba, Griepentrog, Duck, Schneider and Richter23 In Sections V.A and V.B, the Hertzian analysis [Eq. (2)] is used to determine E R for indentations with fully elastic P–h curves, while O&P analysis is used for the indentations with elastic–plastic P–h curves. To improve the accuracy of the Hertzian fitting to a P–h curve, the zero-force depth value of the P–h curve is allowed to vary freely (a zero-force contact parameter, h 0 can be introduced by replacing h with h–h 0).
The Sneddon’s model for elastically isotropic materials was modified by Vlassak and Nix to determine the weighted average E R value of the elastically anisotropic materials.Reference Vlassak and Nix13 The values of E R predicted by Vlassak and Nix were shown to fit well to the experimental results for large indentations of several-100 nm penetration depth. However, when elastically anisotropic materials are deformed by sub-10 nm indentations, the E R values are much closer to the unidirectional values. Hence, the Sneddon’s model for isotropic materials is used here to estimate the unidirectional E R for anisotropic materials [Eq. (3)].
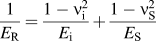
where E i and ν i are elastic modulus and Poisson’s ratio of the diamond indenter tip.
V. RESULTS AND DISCUSSIONS
It is a common understanding that the indentation tests on elastically anisotropic materials provide an average value of the elastic modulus. In this section, the elastic anisotropy of Cu is determined based on single-crystal samples and polycrystalline TSV samples. Furthermore, the implications of elastic anisotropy on the prediction of the stress field in the environment of a TSV and the influence on carrier mobility variation are demonstrated.
A. Elastic anisotropy of Cu single crystals
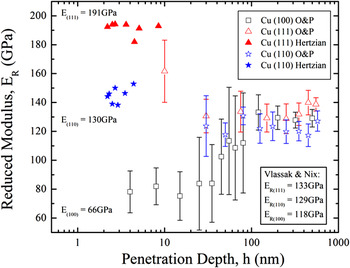
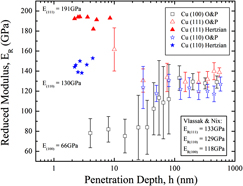
This section demonstrates that the deformations induced by sub-10 nm indentations on Cu crystals have a strong crystal-orientation dependence, while the deformations induced by several-10 nm indentations have an averaging effect as observed for polycrystalline materials.Reference Yeap, Hangen, Raabe and Zschech24Figure 1 shows the E R values for Cu(111), Cu(110), and Cu(100), measured at sub-10 nm and several-10 nm indentations. As can be seen at h > 50 nm, E R coincide for all the crystal orientations at an average value comparable to Hill’s mean reduced modulus value (E mean = 121 GPa),Reference Hill10 and Vlassak and Nix’s indentation modulus value (M (111) = 140 GPa, M (110) = 136 GPa, M (100) = 123 GPa).Reference Vlassak and Nix13
Reduced moduli, E R, values measured at sub-10 nm, several-10 nm, and several-100 nm depth ranges for Cu single crystals with surface planar orientation at (100), (110), and (111).

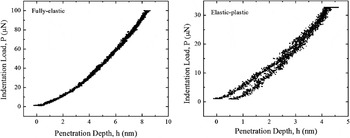
In contrast to the common expectation, the deformations at sub-10 nm for Cu(111) and Cu(110) could be either fully elastic or elastic–plastic (Fig. 2). As shown in Fig. 1, a higher E R value (195 GPa) is recorded for Cu(111) if the P–h curves are fully elastic (closed triangles), while smaller E R values (120–160 GPa) are observed for Cu(111) if the P–h curves show elastic–plastic behavior (opened triangles). Furthermore, E R values for Cu(110) are similar for indentations at sub-10 nm (145 GPa, closed stars) and at several-10 nm (110–140 GPa, opened stars) penetrations. The evolution of E R from the average values to the unidirectional values as the indentation depth reduces from several-10 nm to sub-10 nm requires deeper investigations. However, a simple calculation, based on the indenter geometry and neglecting any sink-in or pile-up, shows that the contact radii, a c, of the sub-10 nm indentations with the Berkovich tips used in this study are 0.41*R and 0.28*R, respectively, when h = 10 nm. The indentations can still be fully elastic, and P is still proportional to h 3/2. But, the contact condition is far different from those in Vlassak and Nix modelReference Vlassak and Nix11 or the typical Hertzian contact,Reference Timoshenko and Goodier15 where R is many times larger than a c. Hence, the contact pressure distributions for the sub-10 nm indentations in this study are different from those in Vlassak and Nix model.Reference Vlassak and Nix11 These differences could be the reason for the unidirectional values of E R.
The typical fully elastic and elastic–plastic P–h curves obtained from Cu(111).

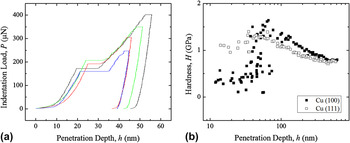
On the other hand, it is surprising that the indentation response observed on Cu(100) is distinctly different from those observed on Cu(111) and on Cu(110). The fully elastic loading could not be achieved on Cu(100). While the indentations on Cu(111) show a drop in E R instantaneously with the onset of plasticity, the indentations on Cu(100) show a rise in E R when the penetration depth of the indenter increases from 20 to 80 nm (opened square) (Fig. 1). The increase of the E R value for Cu(100) is observed in parallel with the occurrence of pop-in events and might be related to the collective movements of dislocations, instead of the on-set of plasticity [Fig. 3(a)]. Before the pop-in event, E R and hardness values measured for Cu(100) are significantly smaller than those measured after the pop-in event [Fig. 3(b)].
(a) The pop-in events on the P–h curves for Cu(100). (b) Hardness values measured at several-10 nm and several-100 nm depth ranges for Cu single crystals with surface planar orientation at (100) and (111).

The elastic–plastic behavior for Cu crystals depends significantly on dislocation density in the material beneath the indentation and on dislocation sources at atomic terraces on the sample surface. Hence, there is a large variation in the indentation responses (fully elastic or elastic–plastic) for different indent locations. One third of the indents performed on Cu (111) and (110) are fully elastic, while the rest shows the hysteresis as a characteristic for the onset of plasticity. For Cu(100), all the P–h curves are elastic–plastic. As illustrated in Fig. 3, the hardness value is much smaller for Cu(100) as compared to Cu(111), i.e., yield stress value is smaller. Generally, the mixture of fully elastic and elastic–plastic responses indicates that the sources of dislocations in the Cu samples are easy to be found, either at the surface or in the volume beneath the indenter. Even for very small penetration depths (1–2 nm) plastic responses can occur.
Based on the indentation results presented here, it seems that as soon as multiple slip systems are activated, the E R values of Cu crystals evolve from unidirectional values to average values. For Cu(111) and Cu(110) crystals, the initiation of plastic deformations in a volume beneath the indentation would require multiple slip systems. Since this volume is constrained by the surrounding crystals, a pure elastic loading might be observed until the resolved shear stress is high enough to activate multiple slip systems. As shown by Zaafarani et al.,Reference Zaafarani, Raabe, Singh, Roters and Zaefferer25 the resulting plastic deformation field in the Cu single crystal beneath the indenter is at least three times larger than the indentation impression and can cause a local lattice rotation with a magnitude up to 25°. Therefore, the averaging effect on E R values is observed almost instantaneously at the on-set of lattice rotation. For Cu(100) crystal, the early plastic deformation within the constraints of the surrounding matrix may be initiated by activating a single slip system {110}<111> or slip systems that do not interfere with each others. Therefore, the hardness value determined for the Cu(100) crystal is much lower than that of the Cu(111) crystal for h < 50 nm (Fig. 3). Plastic deformation could be initiated much easier in Cu(100), and it is practically not possible to prevent plastic deformation. Due to the single slip system, lattice rotation might not occur, and low E R values are observed up to indentation depths of 50 nm. Dislocations can be moved to a long distance, which does not necessarily result in lattice rotation. At deeper penetration depths (h > 50 nm), lattice rotation might happened in Cu(100) by activating additional slip systems, and as a result, average E R values are measured. The molecular dynamic simulations of small indentations by Ziegenhain et al. also showed the similar vanishing orientation-dependent properties upon the onset of plasticity or the pop-in event.Reference Ziegenhain, Urbassek and Hartmaier26
B. Elastic anisotropy of Cu grains in TSV
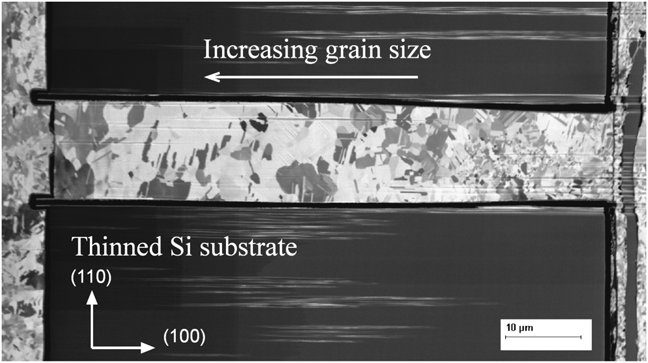
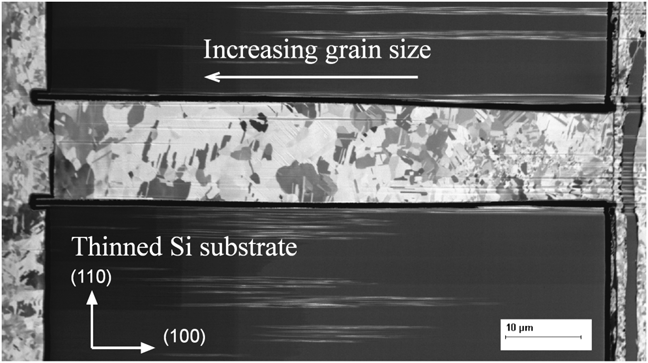
A typical TSV is consisted of a polycrystalline metallic material, which has usually hundreds of individual grains. Figure 4 shows a FIB image of the cross section of a copper TSV, where individual grains with different crystal orientation are indicated by different gray contrast originated from the ion-channeling effect. Due to the different grain orientation, the elastic modulus of each individual grain is different in the direction perpendicular to the cross-section surface. This elastic anisotropy among different grains can be measured by nanoindentation, since the size of the Cu grains are at least one order of magnitude larger than the indenter tip radius. There is also evidence from the image that the grain size increases from the bottom of the TSV to the top (Fig. 4).
Focused ion beam (FIB) cross-section image of a Cu-filled through-silicon via (TSV).
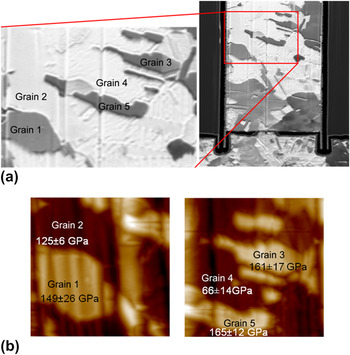
To ensure that the indentation tests on the Cu grains will yield the unidirectional E R of each grain, the FIB image of the Cu TSV [Fig. 5(a)] is correlated to the in situ SPM topography image [Fig. 5(b)]. Using automated piezoelectric transducers, indentations are performed directly during the SPM imaging, to accurately position the indenter at the center region of each grain and to avoid the deformation mechanisms related to grain boundaries. About 10 indentations of maximum depth 3 nm were performed on each grain. Since the grain size is at least 3 μm×1 μm, spacing between each indent of about 100 nm should be sufficient to ensure no interaction between the indents. The E R values of five Cu grains as shown in Fig. 5 are (149 ± 26) GPa, (125 ± 6) GPa, (161 ± 17) GPa, (66 ± 14) GPa, and (165 ± 12) GPa, for grains 1–5, respectively. While the E R clearly indicates a strong elastic anisotropy among these grains, the possible effects of Cu oxide and Ga+ ion implantation on the results have to be considered as well. It is therefore essential to know the grain orientation, so that the theoretical unidirectional E R values can be estimated and compared to the measured E R values.
The experimental procedures used for in situ identification of different Cu grains during the indentation tests: (a) FIB cross-section image with gray contrast originated from the ion-channeling contrast, (b) in situ scanning-probe microscopy topography image (scan size: 5 μm × 5 μm).

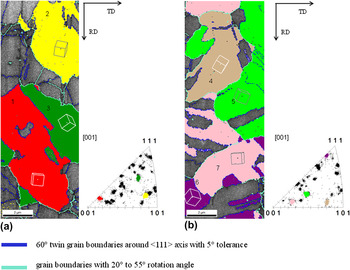
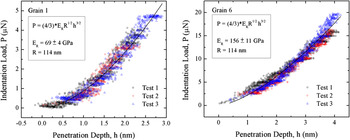
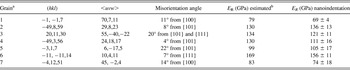
Figure 6 presents the Orientation Imaging Microscopy (OIM) results from two separate regions in a Cu-TSV. For the complete overview of the microstructure, image quality (IQ) maps are used. Grains 1–7 that will be used for further nanoindentation experiments are highlighted with different colors on the IQ maps and the corresponding [001] inverse pole figures. Most of the grain boundaries are either twin boundaries 60° around <111> axis or boundaries with rotation angle between 20° and 55°. The average (hkl)<uvw> integer indexes are estimated for grains 1–7 (Table I). As can be seen, the grain orientation map is highly random, and the plane parallel to the TSV cross section can be either near {001}, {101}, or {111}. In Fig. 6, the grains oriented nearest to {001} and {111} are grains 1 and 6, respectively. Figure 7 shows the fully elastic indentation P–h curves obtained from these Cu grains 1 and 6. About 30% of the sub-10 nm indentations on the Cu grains have a fully elastic response, and therefore, the experimental data can be fitted with the Hertzian model with good consistence to determine E R. Table I shows the E R values as results from the sub-10 nm indentations with fully elastic response on the grains highlighted in Fig. 6. It can be seen that the E R values obtained from the sub-10 nm indentations are close to the unidirectional values estimated using Cu material stiffness matrix (C 11=169 GPa, C 12=122 GPa, C 44=75 GPa) and the methodology as described in Hopcroft et al.Reference Hopcroft, Nix and Kenny27 The estimated E R values for different grains have errors of about 10% due to the small uncertainty on the OIM results. The agreement between the estimated and the measured values of E R suggests that the averaging effect from lattice rotations due to plastic deformation has not occurred during the fully elastic indentation. The results also indicate that Ga+ ion implantation and surface native oxide are minor effects, i.e., they are not as strongly affecting the E R values as the elastic anisotropy of Cu grains. Obviously, this is due to the FIB milling with a very small ion dose and due to the fact that the indentation tests were performed immediately after transfer of the sample from SEM vacuum chamber.
Image quality maps of two regions on a Cu–TSV and the corresponding [001] inverse pole figures obtained by OIM.

Fully elastic P–h curves obtained from the indentations on Cu grains 1 and 6 of Fig.6. Hertzian fittings to the P–h curves are showing good consistence.

EBSD results and nanoindentation results from the Cu grains highlighted in Fig. 6.

a Refer to Fig. 5 for the OIM results.
b Theoretical E R values estimated based on Cu stiffness matrix (C 11 = 169 GPa, C 12 = 122 GPa, C 44 = 75 GPa) and Sneddon’s model [Eq. (3)].Reference Hopcroft, Nix and Kenny27
C. Effects on TSV-induced stress and carrier mobility
Nanoindentation with a small deformation zone is very useful in the 3D IC design, particularly to account for the elastic anisotropy of the TSV filled with Cu using different processes. This section presents the TCAD simulation results, which clearly show that the thermomechanical stress in the TSV surrounding could vary due to the Cu grain orientation, especially when the TSV top end consists of a few grains. Due to the stress field modulation by Cu grain orientation and elastic anisotropy, the charge-carrier mobility in the active region of a transistor will be severely modified. As indicated by Fig. 4, there could be only one grain across TSV top diameter for very small vias. In such extreme cases, crystal anisotropy has to be taken into consideration for accurate stress analysis. This section will illustrate the methodology to evaluate the TSV-induced stress and the carrier mobility variation using experimentally determined anisotropic material properties for the extreme case of a single copper grain at the top of the TSV.
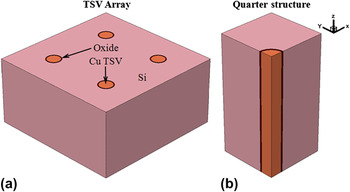
To examine the impact of anisotropic material properties of copper, 3D TSV structures are generated in a silicon substrate with [001] and [110] orientation. Figure 8(a) shows a schematic view of the 3D TSV array structure with 25 μm TSV pitch. The TSV structure consists of a copper TSV with 2.5 μm radius, 0.05 μm TaN barrier layer, and 0.3 μm oxide insulator in a 25 μm thick silicon substrate. The boundary conditions are set to restrict displacements at the minima of x, y, and z axes and the maxima of x and y axes, while allowing the displacement at the maxima of the z-axis. These boundary conditions represent a periodic TSV array structure in the xy plane. This symmetry condition allows the simulation of only one quarter of the TSV structure shown in Fig. 8(b). A thermal ramp down from the copper stress-free temperature of 250 °C to room temperature of 25 °C is simulated to assess the TSV-induced stress and its impact on charge-carrier mobility in active silicon regions.
Schematic diagrams of (a) a TSV arrays and (b) the quarter structure that is used in the TCAD simulation.

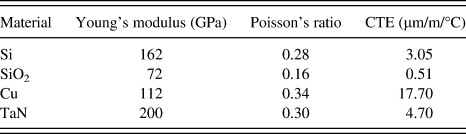
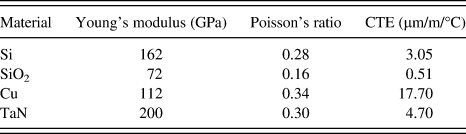
The TSV-induced stress and mobility change of charge carriers after a thermal ramp down from 250 to 25 °C is examined for isotropic and anisotropic Cu properties. Table II shows the isotropic material properties used in this study.6, Reference Shen28 In the case of anisotropic Cu, the Young’s modulus values along the first, second, and third planes of symmetry are 156, 69, and 69 GPa, respectively. These values correspond to the E R values determined using the nanoindentation technique (Table I). The shear modulus, Poisson’s ratio, and CTE for anisotropic Cu are 60.94 GPa, 0.28, and 17.7 × 10⁻⁶/K, respectively.6 Here, only a single grain of Cu is assumed to cover the entire top of the TSV in the case of the anisotropic Cu. The formation of a single anisotropic Cu grain at the top of the TSV is an extreme case depending on TSV geometry and process parameters. It is a target that the Cu material retains its isotropic polycrystalline structure throughout the TSV.Reference Karmarkar, Xu, Ramaswami, Dukovic, Sapre, Bhatnagar, Bartha, Borst, DeNardis, Rao, Kim, Naeemi, Nelson, Ro and Toma4
Isotropy materials parameters used in the thermomechanical stress and charge-carrier mobility simulations.
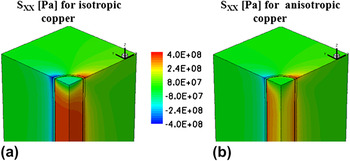
Figures 9(a) and 9(b) show the x-component of the normal stress (Sxx) after a thermal ramp down from 250 to 25 °C in 3D TSV structures with isotropic Cu and anisotropic Cu, respectively. The stress results show that the thermomechanical stresses induced by the TSV are strongly dependent on the Cu anisotropy. Due to the corresponding modulus reduction, Sxx for the anisotropic Cu is significantly smaller than that for the isotropic Cu.
The normal stress in x-direction as predicted from the simulations after a thermal ramp down from 250 to 25 °C for (a) isotropy Cu and (b) anisotropy Cu.

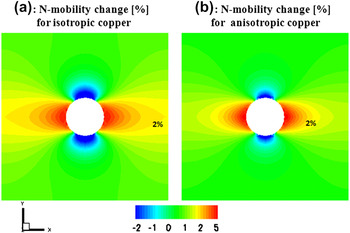
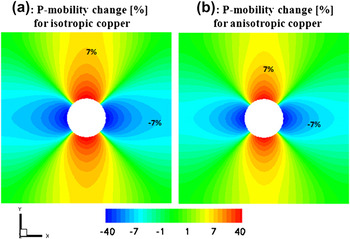
The charge-carrier mobility change in silicon due to the thermomechanical stresses is also examined for isotropic and anisotropic Cu properties. Figures 10(a) and 10(b) show the n-mobility change in silicon after a thermal ramp down from 250 to 25 °C for the isotropic Cu TSV and the anisotropic Cu TSV, respectively. Similarly, Figs. 11(a) and 11(b) show the p-mobility change in silicon after a thermal ramp down from 250 to 25 °C for isotropic Cu TSV and anisotropic Cu TSV, respectively. These results clearly indicate that Cu anisotropy has a significant impact on the charge-carrier mobility in active silicon.
The variation of charge-carrier mobility in n-channel after a thermal ramp down from 250 to 25 °C for (a) isotropic Cu and (b) anisotropic Cu.

The variation of charge-carrier mobility in p-channel after a thermal ramp down from 250 to 25 °C for (a) isotropic Cu and (b) anisotropic Cu.

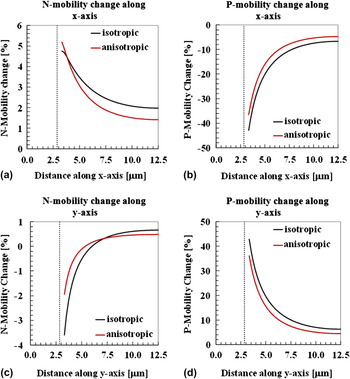
The charge-carrier mobility is further assessed by examining their mobility change parallel to the coordinate axes. Figure 12(a) shows the change in n-mobility, and Fig. 12(b) shows the change in p-mobility along a cutline parallel to the x-axis. The cutline parallel to the x-axis is situated 2 nm below the top silicon surface and 10 nm away from the xz plane. Similarly, Fig. 12(c) shows the change in n-mobility, and Fig. 12(d) shows the change in p-mobility along a cutline parallel to the y-axis. The cutline parallel to the y-axis is situated 2 nm below the top silicon surface and 10 nm away from the yz plane. It is clearly seen that n- and p-mobility variations along x-axis are larger in magnitude for isotropic copper than that for anisotropic Cu. These results show that Cu anisotropy significantly alters the charge-carrier mobility variation along the coordinate axes.
The variation of charge-carrier mobility along x-axis and y-axis for n-channel and p-channel after a thermal ramp down from 250 to 25 °C. Red lines represent the anisotropic Cu, and black lines represent the isotropic Cu.

The numerical simulation results clearly demonstrate the impact of Cu anisotropy on mechanical stress and charge-carrier mobility in the active region of a transistor next to the TSV with one Cu grain at the via top. Hence, experimental determination of the materials elastic anisotropic properties, e.g., nanoindentation and EBSD, is essential while evaluating the performance of the 3D stacked ICs, particularly for extreme cases with very small via diameters.
VI. CONCLUSION
As a conclusion, from the indentation tests at sub-10 nm depths, the fully elastic deformations of Cu single crystals and grains are strongly anisotropic. The E R values determined by fitting the Hertzian model to the fully elastic curves are close to the unidirectional values. On the other hand, the indentations at several-100 nm depths have led to a strong averaging effect. The E R values determined at several-100 nm depths are close to the Hill’s mean values. While the averaging effect is mainly due to the complex elastic field around the indentation, the onset of the averaging effect could be due to the lattice rotation beneath the indented volume, and it might be correlated to the activation of multiple slip systems. Further experimental study on other single crystals and molecular dynamic simulation of indentation at sub-10 nm are necessary to explain why the sub-10 nm indentations can yield unidirectional E R. The strong elastic anisotropy of Cu that was observed at small deformation has important implications on the thermomechanical stress of a TSV surrounding, particularly for those with very small via diameter. Simulations of a thermal ramp down from the Cu stress-free temperature (250 °C) to room temperature (25 °C) demonstrated significant differences of the TSV-induced thermomechanical stress for the extreme case with one copper grain at the via top and for isotropic polycrystalline copper TSVs. The impact of copper anisotropy induced stress modulation on the charge-carrier mobility in active silicon is demonstrated using measured Cu properties. This study has extended the experimental determination of elastic anisotropy to the sub-10 nm deformations and contributed to the understanding of the effects of elastic anisotropy on the 3D stacked ICs with Cu TSVs.
ACKNOWLEDGMENTS
The authors would like to thank Heidi Bögershausen from Max Planck Institute for Iron Research, Düsseldorf, Germany, and Yvonne Ritz, Fraunhofer Institute for Non-destructive Testing, Dresden, Germany, for sample preparation.