Introduction
The tremendous progress in computational approaches within materials science has led to the potential for accelerating material discovery for a wide range of applications, including in energyReference Jain, Shin and Persson1 and biological sciences.Reference Cole and Hine2 High-throughput computational studies have aided in materials discovery in thermoelectrics,Reference Zhang, Song, Madsen, Fischer, Zhang, Shi and Iversen3 electrocatalysis,Reference Greeley, Jaramillo, Bonde, Chorkendorff and Nørskov4 hydrogen storage,Reference Wolverton, Siegel, Akbarzadeh and Ozoliņš5 topological insulators,Reference Yang, Setyawan, Wang, Nardelli and Curtarolo6 magnetic materials,Reference Drebov, Martinez-Limia, Kunz, Gola, Shigematsu, Eckl, Gumbsch and Elsässer7 and solar materials.Reference Castelli, Olsen, Datta, Landis, Dahl, Thygesen and Jacobsen8 While computational techniques such as density functional theory (DFT) simulationsReference Hohenberg and Kohn9–Reference Lejaeghere, Van Speybroeck, Van Oost and Cottenier13 have shown tremendous success in rapidly eliminating bad material candidates and guiding design choice,Reference Curtarolo, Hart, Nardelli, Mingo, Sanvito and Levy14,Reference Holdren15 a set of promising candidates often emerges that is indistinguishable without additional resources, including experimental testing and validation.
In parallel, an emerging frontier is the development of uncertainty quantification and propagation that has the potential to dramatically reduce the number of false positive candidates and can accelerate material discovery by reducing the number of candidates tested. This introduces an additional dimension to the predictions from computational methods by associating a quantitative metric for the robustness of every prediction or qualitatively, such as the likelihood of success of the candidate. Uncertainty quantification and propagation can serve to break the commonly held notion that “computational results are believed by no one, except the person who generated them.” Uncertainty quantification coupled with high fidelity simulations will play a major role in enhancing trust in computationally aided material discovery by more rapidly and robustly eliminating candidates that have a low potential for success.
In this article, we demonstrate a systematic approach for uncertainty quantification and propagation utilizing DFT calculations through two case studies. The first case study is an example from electrocatalysis, where the goal was to more robustly identify candidate materials that can be more active and selective for oxygen reduction reaction. The second case study is an example from Li-ion batteries, where the goal was to identify a novel cathode material based on Ni-Mn-Co (NMC) oxides. In both cases, we find that uncertainty quantification allows the identification of regimes where predictions are highly certain within the employed level of computational complexity, in addition to enabling more efficient materials discovery searches, enhanced interpretability of results, and an efficient narrowing down of candidate materials.
Uncertainty quantification in DFT
DFT has been widely successful in describing material properties through mapping of a complicated interacting system of electrons into a set of noninteracting electrons. In carrying out this mapping, an additional quantity arises that must include effects from spin, the Pauli exclusion principle, and the difference between the kinetic energy of the noninteracting system and that of the real system. This term, known as the exchange-correlation functional, is effectively a measure of how the motion of one electron is affected by others. The accuracy of the calculations, however, depends strongly upon this exchange-correlation functional. Many approximations have been made, and the most widely used class of exchange-correlation functionals falls under the generalized gradient approximation (GGA). While higher-order methods exist, GGA-based functionals strike a favorable tradeoff between computational time and accuracy. Numerous possible GGA-level functionals, in theory, all possess similar accuracy for a given problem. A common criticism of GGA-level DFT calculations is related to the robustness of the predictions for a single choice of exchange-correlation functional. Although one could carry out the same calculations with several different GGA-level functionals to ensure robustness of the predictions, this greatly increases computational time and becomes unrealistic for any practical materials screening.
One approach to mitigate this has emerged with the creation of functionals that possess built-in error estimation capabilities. The basic idea involves generating an ensemble of semiempirical functionals that are fit to known experimental data. The ensemble of functionals is generated through perturbation of the coefficients of the exchange-correlation functional, which lead to an equally good fit and thus allow a way to test the sensitivity with respect to the fit model.Reference Frederiksen, Jacobsen, Brown and Sethna16–Reference Petzold, Bligaard and Jacobsen18 This core idea has been used in a host of error estimation functionals that take into account van der Waals correctionsReference Wellendorff, Lundgaard, Møgelhøj, Petzold, Landis, Nørskov, Bligaard and Jacobsen19 and other higher order methods, such as meta-GGA approximations.Reference Wellendorff, Lundgaard, Jacobsen and Bligaard20 Although a rigorous statistical bias and ability of error estimations to recreate errors of prediction outside the training data needs to be established,Reference Pernot21 recent generations of these functionals have attempted to improve this with system-focused reparametrization,Reference Proppe, Husch, Simm and Reiher22 machine learning,Reference Aldegunde, Kermode and Zabaras23 and the creation of more specialized functionals.Reference Simm and Reiher24
In this article, we focus on the Bayesian error estimation function with van der Waals (BEEF-vdW) corrections implementation, which is trained at the GGA level and gives a subspace that encompasses many other GGA-level functionals.Reference Wellendorff, Lundgaard, Møgelhøj, Petzold, Landis, Nørskov, Bligaard and Jacobsen19 The error estimates from the BEEF-vdW ensemble bounds the values obtained from many other GGA-level functionals’ prediction of bulk mechanical propertiesReference Ahmad and Viswanathan25 and magnetic state energy differences.Reference Houchins and Viswanathan26 The ensemble of energies has been used to quickly sample the functional space to demonstrate functional-dependent scaling relations between the prediction of related reaction enthalpies and thereby demonstrate correlated errors in DFT.Reference Christensen, Hansen, Dickens, Nørskov and Vegge27 This same technique was also used to determine error correction schemes related to hydrocarbon reactions.Reference Christensen, Hansen and Vegge28 The error bars generated by the ensembles have been used to create referencing schemes for calculating formation energies through the minimization of the predicted error.Reference Christensen, Hummelshøj, Hansen and Vegge29 This has opened up numerous opportunities to improve predictions for electrochemical functional materials and has begun to see initial adoption, such as for ammonia synthesis,Reference Medford, Wellendorff, Vojvodic, Studt, Abild-Pedersen, Jacobsen, Bligaard and Nørskov30 electrocatalysis,Reference Deshpande, Kitchin and Viswanathan31 chlorine evolution,Reference Sumaria, Krishnamurthy and Viswanathan32 and oxygen evolution.Reference Krishnamurthy, Sumaria and Viswanathan33 We discuss the application of uncertainty quantification and propagation using the error estimation capability enabled by Bayesian error estimation functionals through two case studies.
Case study I: Computational screening of electrocatalytic materials for the oxygen reduction reaction
Electrocatalyic processes are crucial and form the basis for many potential schemes that aim to store renewable energy in the form of chemical bonds using fuel cells and electrolyzers. Most notably among these, oxygen and hydrogen electrochemistry are important in enabling fuel cells and electrolyzers. High-throughput screening of electrocatalytic materials has seen remarkable success for hydrogen evolutionReference Greeley, Jaramillo, Bonde, Chorkendorff and Nørskov4,Reference Greeley, Nørskov, Kibler, El-Aziz and Kolb34,Reference Nørskov, Bligaard, Logadottir, Kitchin, Chen, Pandelov and Stimming35 and oxygen reduction reaction.Reference Nørskov, Bligaard, Rossmeisl and Christensen36–Reference Viswanathan, Hansen, Rossmeisl and Nørskov38 The screening studies typically identify one (or a few) energetic parameter(s), known as a descriptor, which, to a first approximation, describes the electrocatalytic activity.Reference Rankin and Greeley39–Reference Halck, Petrykin, Krtil and Rossmeisl43
The hydrogen evolution reaction (HER) is a two-electron electrochemical reaction where protons and electrons combine to form hydrogen. The activity of an electrocatalyst is determined by the hydrogen adsorption free energy, and within a thermodynamic formulation, the optimal catalyst is one that has a hydrogen adsorption free energy of zero, as originally shown by Parsons.Reference Parsons44 DFT calculations allow the ability to quantitatively delineate electrocatalyst materials based on their hydrogen adsorption free energy. The hydrogen adsorption free energy as the descriptor has been used to screen a large number of catalyst structures, and several computationally guided success stories have emerged, most notably, the discovery of bimetallic BiPt as an excellent catalyst for hydrogen evolution.Reference Greeley, Jaramillo, Bonde, Chorkendorff, Nørskov and Dusastre45 However, it has been difficult to replicate similar success in more complicated multi-electron electrochemical reactions.
The oxygen reduction reaction is a four-electron electrochemical reaction where oxygen, protons, and electrons are reduced to water. The activity of an electrocatalyst for four-electron oxygen reduction is dependent on the adsorption free energies of three oxygen intermediates (OOH*, OH*, and O*), where * represents an adsorbed species. However, the adsorption free energies of these oxygen intermediates are linearly related with a positive slope, referred to as scaling relations.Reference Abild-Pedersen, Greeley, Studt, Rossmeisl, Munter, Moses, Skulason, Bligaard and Nørskov46 Thus, to a first approximation, the electrocatalytic activity for oxygen reduction is determined by the adsorption free energy of one oxygen intermediate. The free energies of the adsorption of O* and OH* have both been used as the single descriptor in large-scale screening studies. A question then arises: among the three possible descriptors, O*, OH*, and OOH*, which of these leads to the highest likelihood of positive candidate materials in a screening process? The following discussion shows how uncertainty quantification and propagation can be used to systematically answer this question and provide a rational basis for the selection of the optimal descriptor to improve the prediction of catalyst activity.
The BEEF-vdW implementation allows a sampling of the adsorption free energy with respect to different GGA-level functionals, as discussed previously.Reference Wellendorff, Lundgaard, Møgelhøj, Petzold, Landis, Nørskov, Bligaard and Jacobsen19 As a result, all adsorption free energies become probabilistic variables, and thus, within this framework, the associated electrocatalytic activity also becomes a probabilistic quantity.Reference Deshpande, Kitchin and Viswanathan31,Reference Krishnamurthy, Sumaria and Viswanathan33 The adsorption free energies generated from the BEEF-vdW exchange-correlation functional is typically Gaussian. Figure 1 shows the probability density function (PDF) of the adsorption free energy of OH* and an ensemble of scaling relations between two key oxygen reduction intermediates, OH* and OOH*.Reference Krishnamurthy, Sumaria and Viswanathan33 In this probabilistic formulation, the descriptor PDF is denoted as  ${p_X}(x)$. The descriptor–activity relationship is denoted by
 $A = f(X)$, where the activity metric is typically the limiting potential (
 ${U_{\rm{L}}}$), which is the thermodynamic activity or the highest potential at which the reaction is downhill in free energy, and
 $X$ is the descriptor value.
(a) Ensemble of scaling relations (light yellow dots) between the OOH* and OH* intermediates on metal surfaces. The red dots correspond to the adsorption free energies of explored metal surfaces from the optimal BEEF-vdW functional. (b) The ensemble of adsorption energies of the OH* intermediate computed using the error-estimation framework within the Bayesian error estimation function with van der Waals exchange-correlation functional.Reference Krishnamurthy, Sumaria and Viswanathan33 The spreads in the scaling relations (a) and the adsorption energy (b) quantify the degree of uncertainty that is propagated to while making activity predictions.  ${\rm{\Delta }}{E_{{\rm{O}}{{\rm{H}}^{\rm{*}}}}}$ and
 ${\rm{\Delta }}{E_{{\rm{OO}}{{\rm{H}}^{\rm{*}}}}}$ denote the adsorption energies of the intermediates OH* and OOH*, respectively. The shaded regions around the best-fit scaling relationship in (a) represent the 1-standard deviation (σOOH-OH) and 2-standard deviation (2σOOH-OH) lines. In (b), σOH denotes the standard deviation of the adsorption energy of the OH* intermediate, and
 ${\rm{\Delta }}{E_{{\rm{O}}{{\rm{H}}^{\rm{*}}},{\rm{Pt}}(111)}}$ denotes the OH* adsorption energy on Pt(111). Note: RMSE, root mean square error with respect to the best-fit scaling relation.

The associated probability density (unnormalized) for the activity at a given value of activity  $a$ is denoted by
 ${\hat{p}_A}(a)$ and can be expressed as:
 $${\hat{p}_A}\left( a \right) = \mathop \smallint \limits_{ - \infty }^\infty {p_X}\left( x \right){\rm{\delta }}\left( {f\left( x \right) - a} \right)dx,$$
where  $\delta$ denotes the Kronecker delta function. With the normalized PDF,
 ${p_A}(a)$, the expectation value of the activity can be obtained as the weighted average over the activity range denoted by the limits
 ${a_{{\rm{min}}}}$ and
 ${a_{{\rm{max}}}}$, and is given by
 $< A > = \mathop \smallint \limits_{{a_{{\rm{min}}}}}^{{a_{{\rm{max}}}}} a{p_A}(a)da$.
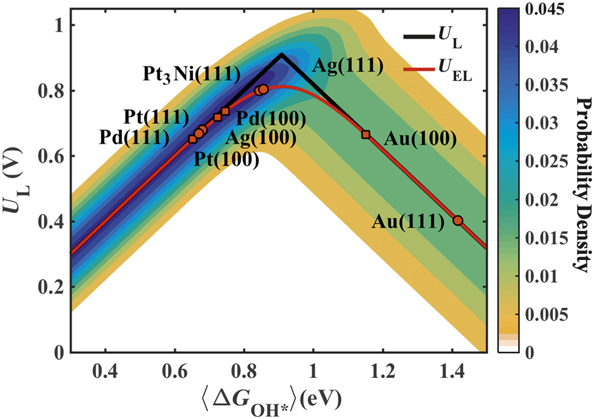
The PDF of the predicted activity is shown using the color map in Figure 2, and the red curve represents the expected activity.Reference Deshpande, Kitchin and Viswanathan31,Reference Krishnamurthy, Sumaria and Viswanathan33
Probabilistic activity volcano using  ${\rm{\Delta }}G_{{\rm{O}}{{\rm{H}}^{\rm{*}}}}^{}$ as the descriptor, which we identify as the descriptor that maximizes the prediction efficiency.Reference Krishnamurthy, Sumaria and Viswanathan33 The black line represents the activity volcano relationship (U L) corresponding to the best-fit scaling relation; the red curve represents the expected activity (U EL) as a function of the expectation value of the descriptor, denoted as
 ${\rm{\Delta G}}_{{\rm{O}}{{\rm{H}}^{\rm{*}}}}^{}$. The color map shows the probability density function of the predicted activity, which indicates the degree of uncertainty in activity predictions. It can be seen that the uncertainty in activity for the weak-binding (right) leg of the descriptor–activity relationship is larger owing to the additional uncertainty arising from scaling relations.
Consider the oxygen reduction reaction.Reference Abild-Pedersen, Greeley, Studt, Rossmeisl, Munter, Moses, Skulason, Bligaard and Nørskov46 For materials that strongly bind oxygen, the activity is determined by the reduction of OH* to H2O. For materials that weakly bind oxygen, the activity is determined by the activation of O2 as OOH*. Invoking scaling relationsReference Calle-Vallejo and Koper47 allows the activity PDFs to be described as a function of adsorption free energy PDFs of OH*, OOH*, or O*.Reference Wellendorff, Lundgaard, Møgelhøj, Petzold, Landis, Nørskov, Bligaard and Jacobsen19,Reference Abild-Pedersen, Greeley, Studt, Rossmeisl, Munter, Moses, Skulason, Bligaard and Nørskov46,Reference Nørskov, Rossmeisl, Logadottir, Lindqvist, Kitchin, Bligaard and Jonsson48 An interesting question emerges, as to which of these descriptors yields higher fidelity predictions.
Prediction efficiency to determine optimal descriptor for activity
Within this probabilistic formalism, the activity PDF of a particular catalyst material determined by different descriptors will be different. The chosen descriptor should be such that it has the ability to delineate between the electrocatalytic activity of materials (i.e., predict whether a material is better than another). We proposed a quantity, termed as prediction efficiency, which provides a rational basis to select the optimal descriptor. The prediction efficiency is defined based on the ratio of the reduced distinguishability, with finite uncertainty to the distinguishability with perfect computation.Reference Krishnamurthy, Sumaria and Viswanathan33
Simply put, the prediction efficiency calculates the likelihood that a material can be identified to have an activity above a threshold activity, given finite model and calculation uncertainty. The prediction efficiency values corresponding to the three potential descriptors, which are the adsorption free energies of the oxygen intermediates, denoted as  ${\rm{\Delta }}{G_{{\rm{O}}{{\rm{H}}^{\rm{*}}}}},{\rm{\Delta }}{G_{{{\rm{O}}^{\rm{*}}}}}$, and
 ${\rm{\Delta }}{G_{{\rm{OO}}{{\rm{H}}^{\rm{*}}}}}$, are shown in Figure 3.Reference Krishnamurthy, Sumaria and Viswanathan33 The prediction efficiency drops as the threshold limiting potential increases, suggesting that it becomes more difficult to distinguish between materials near the top of the activity volcano.
Prediction efficiency comparison for the free energies of the three oxygen intermediates as a function of the activity interval of interest  $(U_{L,\max } - U_{\rm{T}} $).Reference Krishnamurthy, Sumaria and Viswanathan33
 ${\rm{\Delta }}{{\rm{G}}_{{\rm{O}}{{\rm{H}}^{\rm{*}}}}}$ emerges as the descriptor that maximizes predictability for 4e– oxygen reduction reaction. Note: ηpred, prediction efficiency;
 ${\rm{\Delta }}G_{{\rm{OO}}{{\rm{H}}^{\rm{*}}}}^{}$, adsorption free energy of the OOH* intermediate;
 ${\rm{\Delta }}{G_{{{\rm{O}}^{\rm{*}}}}}$, adsorption free energy of the O* intermediate;
 ${\rm{\Delta }}{G_{{\rm{O}}{{\rm{H}}^{\rm{*}}}}}$, adsorption free energy of the OH* intermediate; U L,max, highest theoretical limiting potential; U T, threshold limiting potential above which material candidates are promising.
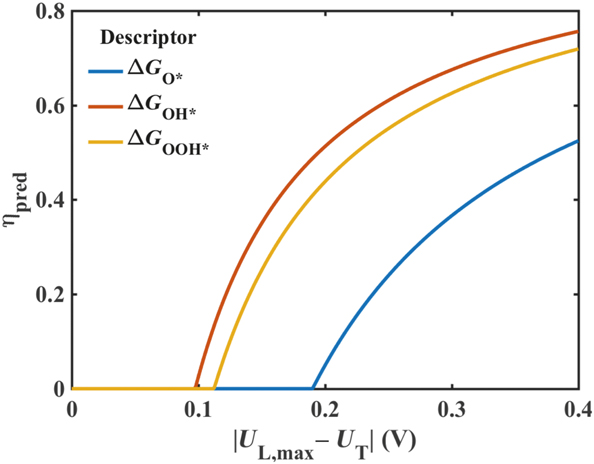
The predictability of activity for the three descriptors can be compared based on the prediction efficiency, and the trend that emerges is  ${{\rm{\eta }}_{{\rm{pred}}}}\left( {{\rm{O}}{{\rm{H}}^{\rm{*}}}} \right) > {{\rm{\eta }}_{{\rm{pred}}}}\left( {{\rm{OO}}{{\rm{H}}^{\rm{*}}}} \right) > {{\rm{\eta }}_{{\rm{pred}}}}\left( {{{\rm{O}}^{\rm{*}}}} \right),$ indicating that
 $\Delta {G_{{\rm{O}}{{\rm{H}}^{\rm{*}}}}}$ is the descriptor for highest predictability. This trend can be rationalized on the basis that the use of
 $\Delta {G_{{{\rm{O}}^{\rm{*}}}}}$ as the descriptor requires two scaling relations, whereas both descriptors
 $\Delta {G_{{\rm{O}}{{\rm{H}}^{\rm{*}}}}}$ and
 $\Delta {G_{{\rm{OO}}{{\rm{H}}^{\rm{*}}}}}$ require only one, and based on the fact that the descriptor uncertainty over the considered material class is lower for
 $\Delta {G_{{\rm{O}}{{\rm{H}}^{\rm{*}}}}}$ relative to
 $\Delta {G_{{\rm{OO}}{{\rm{H}}^{\rm{*}}}}}$. Scaling relations contribute additional uncertainty, which leads to poor predictability of activity with O* as a descriptor.
From this analysis, it is extremely unlikely to identify candidates that could lead to better activity than state-of-the-art Pt using O* as a descriptor.Reference Rossmeisl, Nørskov, Taylor, Janik and Neurock49,Reference Greeley, Stephens, Bondarenko, Johansson, Hansen, Jaramillo, Rossmeisl, Chorkendorff and Nørskov50 On the basis of this study, we found that the choice of the descriptor strongly influences the extent of uncertainty especially near the top of the activity volcano. This is typically where high-throughput screening studies focus their efforts. Thus, the use of prediction efficiency to select the optimal descriptor before commencing any screening study becomes even more pronounced.
Classification efficiency to identify optimal descriptor(s) for selectivity
A competing process to the four-electron oxygen reduction to water is the two-electron reduction to hydrogen peroxide. In a fuel cell, while hydrogen peroxide is a detrimental product, a direct electrochemical synthetic route could be of high value and could compete with the anthraquinone process, the current industrial production route based on oxygen reduction with anthraquinone as the byproduct.Reference Goor, Glenneberg and Jacobi51 Thus, an important challenge is to build selective electrocatalysts that can lead to one desired product, either four-electron reduction or two-electron reduction. Given the probabilistic formalism described previously, a question emerges regarding the optimal descriptor that can maximize the ability to determine product selectivity. Determining product selectivity is a classification problem in contrast to the earlier prediction problem.
We have defined a quantity termed as classification efficiency, which provides a measure of the ability to classify the reaction product using computation with finite uncertainty.Reference Krishnamurthy, Sumaria and Viswanathan52 Based on classification efficiency, we can robustly determine optimal descriptor(s) by maximizing the classification efficiency over a material range of interest. For classification problems, an important intermediate quantity, known as the confidence value (c-value),Reference Houchins and Viswanathan26,Reference Sumaria, Krishnamurthy and Viswanathan32 is extremely useful. In this context, the confidence value ( ${c_{{\rm{sel}} = i}}\left( {{G_{\rm{d}}}} \right),$ where G d denotes the descriptor value) quantifies the degree of confidence in the prediction that the material is selective toward a certain outcome represented by
 $i$ (e.g., a reaction product), defined as the fraction of the ensemble of functionals that predicts a certain outcome.
The confidence value is listed as:
 $${c_{{\rm{sel}} = i}}\left( {{G_{\rm{d}}}} \right) = {1 \over {{N_{{\rm{ens}}}}}}\mathop \sum \limits_{n = 1}^{{N_{{\rm{ens}}}}} {\rm{\delta }}(p_{{\rm{sel}}}^n\left( {{G_{\rm{d}}}} \right) - i),$$
in which  ${\rm{\delta }}\left( x \right)$ represents the Kronecker delta function, n denotes the n th functional, and N ens equals the total number of functionals in the ensemble.
 ${p_{{\rm{sel}}}}({G_{\rm{d}}})$ maps any given material (descriptor value) to the corresponding prediction of active reaction pathway(s) from the set of possible selectivity outcomes denoted by {0, 1, 2, . . . , i, . . . , n}, where
 $i$ denotes the i th pathway or a simultaneous occurrence of more than one pathway. i = 0 indicates no active reaction pathway, and
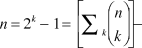 $$n = 2^k - 1 = [\mathop \sum \limits_k \left( {\matrix{ n \cr k \cr } } \right)] - $$1, where
 $k$ is the number of distinct pathways possible and
 $\left( {\matrix{ n \cr k \cr } } \right)$ represents the binomial coefficient;
 $k$ equals 2 for the case of oxygen reduction on metal surfaces. For both oxygen reduction and oxygen evolution, predominantly the 4e– and 2e– pathways occur, leading to n = 3 for these reactions, with i = 3 denoting an equal limiting potential for both pathways. A c-value of 1 denotes perfect agreement among the GGA-level functionals regarding the outcome, and a c-value less than 1 indicates a disagreement at the GGA-level on the predicted outcome.Reference Krishnamurthy, Sumaria and Viswanathan52
In ranking descriptor choices for a given classification problem (e.g., pathway selectivity) based on the degree of agreement in predictions between functionals, classification efficiency is used. This is defined as a ratio in which the numerator quantifies the degree of agreement between functionals for the most likely outcome (e.g., for a reaction pathway).Reference Krishnamurthy, Sumaria and Viswanathan52 The denominator corresponds to the case of predictions associated with zero uncertainty. Zero uncertainty implies that the confidence value (e.g., for  ${c_{{\rm{sel}} = i}}\left( {{G_{\rm{d}}}} \right)$) corresponds to 1 for any one outcome (corresponding to
 $i$) of the classification problem, indicating complete agreement between the functionals. The classification efficiency can be viewed as the area under the curve corresponding to the maximum c-value curve, with finite uncertainty relative to that associated with zero prediction uncertainty.Reference Krishnamurthy, Sumaria and Viswanathan52
Based on classification efficiency, descriptors can be ranked in order of their ability to classify the reaction product. For the oxygen reduction reaction,  ${\rm{\eta }}_{{\rm{cls}}}^{{\rm{sel}}}\left( {{\rm{OO}}{{\rm{H}}^{\rm{*}}}} \right) > {\rm{\eta }}_{{\rm{cls}}}^{{\rm{sel}}}\left( {{\rm{O}}{{\rm{H}}^{\rm{*}}}} \right) > {\rm{\eta }}_{{\rm{cls}}}^{{\rm{sel}}}\left( {{{\rm{O}}^{\rm{*}}}} \right)$, indicating that the most appropriate descriptor for maximizing prediction robustness of pathway selectivity is
 ${\rm{\Delta }}{G_{{\rm{OO}}{{\rm{H}}^{\rm{*}}}}}$ (Table I), where
 ${\rm{\eta }}_{{\rm{cls}}}^{{\rm{sel}}}\left( {{G_{\rm{d}}}} \right)$ denotes the classification efficiency corresponding to pathway selectivity for a given descriptor,
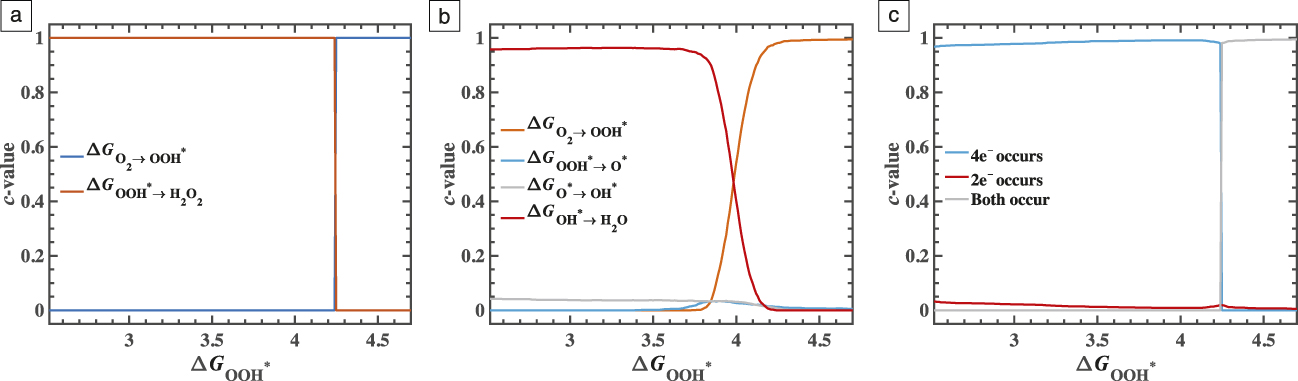
 ${G_{\rm{d}}}$. Therefore, with this descriptor choice, we predict with a high degree of agreement between functionals, as shown in Figure 4c,Reference Krishnamurthy, Sumaria and Viswanathan52 that the 4e– reduction is thermodynamically favorable in the range 2.5 ⪅
 ${\rm{\Delta }}{G_{{\rm{OO}}{{\rm{H}}^{\rm{*}}}}}$ ⪅ 4.25 eV, and both (2e– and 4e–) pathways are equally thermodynamically favorable in the range
 ${\rm{\Delta }}{G_{{\rm{OO}}{{\rm{H}}^{\rm{*}}}}}$ ⪆ 4.25. Similarly,
 ${\rm{\Delta }}{G_{{\rm{OO}}{{\rm{H}}^{\rm{*}}}}}$ (Table I) is the optimal descriptor for robustly predicting the potential determining steps for oxygen reduction to H2O and H2O2, since it maximizes classification efficiency values,
 ${\rm{\eta }}_{{\rm{cls}}}^{4{{\rm{e}}^ - }}$ and
 ${\rm{\eta }}_{{\rm{cls}}}^{2{{\rm{e}}^ - }}$, associated with predictions of potential determining steps for the corresponding identified pathway(s).Reference Krishnamurthy, Sumaria and Viswanathan52
Classification efficiency metrics for the prediction of pathway selectivity and potential limiting steps for the oxygen reduction reaction on metal surfaces. The descriptor  ${\rm{\Delta }}{G_{{\rm{OO}}{{\rm{H}}^{\rm{*}}}}}$ leads to the highest classification efficiency for predicting both pathway selectivity and the associated limiting step(s).
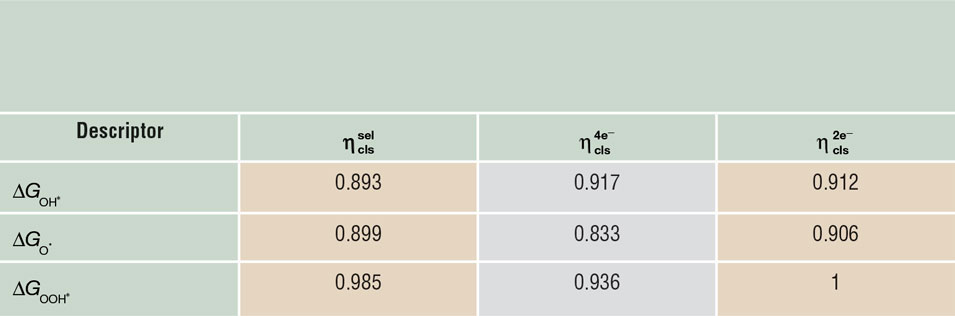
Note:  ${\rm{\eta }}_{{\rm{cls}}}^{{\rm{sel}}}$, classification efficiency corresponding to pathway selectivity;
 ${\rm{\eta }}_{{\rm{cls}}}^{2{{\rm{e}}^ - }}$, classification efficiency associated with identifying the limiting step for 2e– reduction to H2O2;
 ${\rm{\eta }}_{{\rm{cls}}}^{4{{\rm{e}}^ - }}$, classification efficiency associated with identifying the limiting step for 4e– reduction to H2O.
(a, b) Quantifying the confidence in predictions of the limiting step for the identified pathway as a function of the descriptor  ${\rm{\Delta }}{{\rm{G}}_{{\rm{OO}}{{\rm{H}}^{\rm{*}}}}}$, which is identified to be the optimal descriptor for both classification problems. (c) Quantifying the robustness of selectivity between the four-electron oxygen reduction to H2O and the two-electron oxygen reduction to H2O2. Regions with high c-value indicate high robustness associated with predictions of the corresponding limiting step for (a) 2e– reduction to H2O2, and (b) 4e– reduction to H2O. (c) Similarly, the c-value quantifies the robustness of predictions of pathway selectivity between 2e– and 4e– reduction. The analysis shows regions where predictions are associated with high density functional theory uncertainty and require higher fidelity computation.Reference Olivetti, Ceder, Gaustad and Fu54 Note: c-value, confidence value associated with the corresponding classification problem (pathway selectivity or identifying the limiting step for a given pathway);
 ${\rm{\Delta }}{G_{{{\rm{O}}_2} \to {\rm{OO}}{{\rm{H}}^{\rm{*}}}}}$, limiting potential determined by the free-energy change associated with activation of oxygen as OOH*;
 ${\rm{\Delta }}{G_{{\rm{OO}}{{\rm{H}}^{\rm{*}}} \to {{\rm{H}}_2}{{\rm{O}}_2}}}$, limiting potential determined by the free-energy change associated with desorption of OOH* as H2O2;
 ${\rm{\Delta }}{G_{{\rm{OO}}{{\rm{H}}^{\rm{*}}}}}$, adsorption free energy of the OOH* intermediate;
 ${\rm{\Delta }}{G_{{\rm{OO}}{{\rm{H}}^{\rm{*}}} \to {{\rm{O}}^*}}}$, limiting potential determined by the free-energy change associated with reduction of OOH* to O*;
 ${\rm{\Delta }}{G_{{{\rm{O}}^{\rm{*}}} \to {\rm{O}}{{\rm{H}}^*}}}$, limiting potential determined by the free-energy change associated with reduction of O* to OH*;
 ${\rm{\Delta }}{G_{{\rm{O}}{{\rm{H}}^{\rm{*}}} \to {{\rm{H}}_2}{\rm{O}}}}$, limiting potential determined by the free-energy change associated with desorption of OH* as H2O.
The classification efficiency metrics,  ${\rm{\eta }}_{{\rm{cls}}}^{{\rm{sel}}}$,
 ${\rm{\eta }}_{{\rm{cls}}}^{4{{\rm{e}}^ - }},$ and
 ${\rm{\eta }}_{{\rm{cls}}}^{2{{\rm{e}}^ - }}$ for a given descriptor are computed over a continuous descriptor range that encompasses the 1-standard-deviation (1σ) limits of descriptor distributions of all considered metal surfaces. The highest predictability associated with
 ${\rm{\Delta }}{G_{{\rm{OO}}{{\rm{H}}^{\rm{*}}}}}$ can be rationalized on the basis of the fact that OOH* is the only intermediate in the reduction pathway to hydrogen peroxide, and the associated activity for this pathway can be computed without invoking scaling relations that have larger uncertainty. In the descriptor range, where the 4e– reduction is predicted with high confidence, we predict that the OH* desorption step determines the potential with c-value
 $\approx$0.96 in the regime
 ${\rm{\Delta }}{G_{{\rm{OO}}{{\rm{H}}^{\rm{*}}}}}$ ⪅ 3.8 eV, beyond which we predict a smooth transition in the agreement between exchange-correlation functionals to the OOH* adsorption step determining the potential, as shown in Figure 4b.Reference Krishnamurthy, Sumaria and Viswanathan52 This trend is consistent with prior work,Reference Abild-Pedersen, Greeley, Studt, Rossmeisl, Munter, Moses, Skulason, Bligaard and Nørskov46–Reference Nørskov, Rossmeisl, Logadottir, Lindqvist, Kitchin, Bligaard and Jonsson48,Reference Stephens, Bondarenko, Grønbjerg, Rossmeisl and Chorkendorff53 since the OH* desorption step is the limiting step for strong binding materials, and the OOH* desorption step is the limiting step for weak binding materials. In the descriptor range, where both pathways are predicted to be equally favorable, we predict, with high c-values (
 $\approx$1), that the OOH* adsorption step is the potential determining step for both the 4e– and 2e– pathways, as seen in Figure 4c. It is worth highlighting that the descriptor that maximizes prediction efficiency for activity is different from the descriptor that maximizes classification efficiency.
This approach will be extremely important for multi-electron electrochemical reactions, such as CO2 and N2 reduction, where numerous reaction products and pathways are possible.
Case study II: Computational phase search from Li-ion battery cathodes
For the second case study, we turn to the field of energy storage. Li-ion batteries are ubiquitous and in particular enable the rapid electrification of the transportation industry. A major challenge for further adoption of electric vehicles centers on cost. Specifically, cobalt, which is used in Li-ion batteries, has been identified as a possible geopolitical concernReference Olivetti, Ceder, Gaustad and Fu54 and has increased fourfold in cost during the last two years. The history of the use of cobalt dates back to the first rechargeable Li-ion intercalation compound, LiCoO2, discovered by Goodenough and co-workers.Reference Mizushima, Jones, Wiseman and Goodenough55 This material, with its layered structure and good electronic conductivity, has some operational faults because of capacity fade and poor a thermal stability over a large number of cycles. To mitigate this, the substitution of other elements for some of the Co atoms led to substantial improvements.Reference Ohzuku and Makimura56–Reference Kim, Shin, Shin and Sun61 It was even computationally predictedReference Aydinol, Kohan, Ceder, Cho and Joannopoulos62 and later experimentally confirmedReference Ceder, Chiang, Sadoway, Aydinol, Jang and Huang63 that the addition of Al could increase the voltage of LiCoO2 as a battery cathode and provide more energy for less weight and cost. Additionally, a large library of elements with promise exists for the improvement of layered transition-metal cathodes.Reference Onnerud, Onnerud, Novikov, Shi, Chamberlain, Koizumi and Nagai64
Using DFT, high-throughput computational phase searches to identify novel cathode compositions have recently been successful in down-selecting candidate materials in cases of large design spaces.Reference Curtarolo, Hart, Nardelli, Mingo, Sanvito and Levy14,Reference Holdren15 In particular, cluster expansion—a power series expansion of energy in terms of effective interactions of increasing length scales—has been used to understand the ordering of alloyed cathode materials within spinel metal oxides;Reference Arroyo y de Dompablo and Morales65–Reference Braithwaite, Catlow, Harding and Gale67 layered metal oxides, specifically Li-Ni-Mn-O2,Reference Hinuma, Meng, Kang and Ceder68,Reference Van der Ven and Ceder69 Li-Ni-Co-O2,Reference Lee, Iddir and Benedek70 and Li-Ni-Mn-Co-O2;Reference Houchins and Viswanathan71 and olivine metal phosphates.Reference Julien, Mauger, Zaghib and Groult72–Reference Osorio-Guillen, Holm, Ahuja and Johansson75 In the context of compositional phase searches, the addition of uncertain quantification can better elucidate the believability of the predictions, given the errors of DFT and of the cluster expansion model fit.
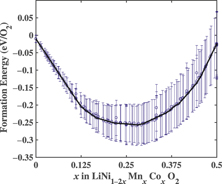
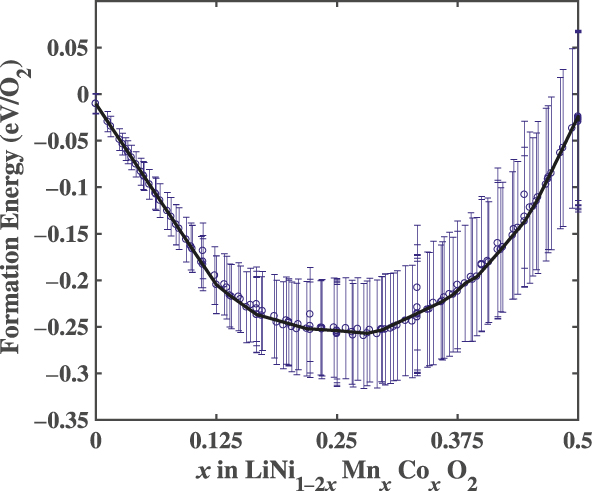
We computationally searched the entire LiMO2 (M = Ni, Mn, Co) (NMC) phase diagram as a preliminary step toward exploring the possibility of low-Co cathode materials with comparable or improved performance with respect to the current state of the art.Reference Houchins and Viswanathan71 Given the complexity of the ternary phase space, the addition of uncertainty quantification aided in the interpretability and prediction of the work. A set of DFT calculations was used to predict the energy of various cathode compositions. The energy of the mixed NMC phase, with respect to the homogenous LiMO2 layered metal oxide end members, establishes the formation energy of the NMC phase. A comparison of formation energy of varying compositions can then establish the set of all thermodynamically stable compositional phases of NMC by minimizing the Gibbs free energy as a function of composition through a convex hull analysis.Reference Hildebrandt and Glasser76 A sample two-dimensional convex hull can be seen in Figure 5.
A 2D slice of the full convex hull. Here, each density functional theory predicted energy at every composition can be seen, as well as the error bars for each calculation. The black line creates the line of minimum Gibbs energy at every composition and is referred to as the convex hull.Reference Tang and Holzwarth73
Because of the computational cost of using DFT to find the energy for each of the thousands of compositions needed to properly sample the phase space, a reduced order cluster expansion model given by:
 $${\rm{E}} = \mathop \sum \limits_{{\rm{ix}}} {{\bf{J}}_{\bf{x}}}{{\bf{\sigma }}_{{\bf{ix}}}} + \mathop \sum \limits_{ < ix,jy > } {{\bf{J}}_{{\bf{xy}}}}{{\bf{\sigma }}_{{\bf{ix}}}}{{\bf{\sigma }}_{{\bf{jy}}}} + \mathop \sum \limits_{ < ix,jy > } {{\bf{K}}_{{\bf{xy}}}}{{\bf{S}}_{{\bf{ix}}}}{{\bf{S}}_{{\bf{jy}}}}$$
was utilized. Here, the  ${{\bf{\sigma }}_{{\bf{ix}}}}$ terms represent the occupation of a particular transition metal in a lattice site, and Jx terms represent the effective energetic interactions of a given cluster;
 ${{\bf{\sigma }}_{{\bf{jx}}}}$ is the occupation of site j by a given species x (0 if species x is there or 1 if species x is not there); Jxy is the energetic value of the two body interaction of a species x with species y. A Heisenberg-like spin model was used to include the magnetic properties of the transition metal atoms, where Sjx is the spin direction of a species x at site i (1 or –1 if species x is at site i or 0 if species x is not at site i at all). The variables i, j are summed over all lattice sites, and x, y are summed over all species present in the lattice. Kxy represent the strength and type of magnetic ordering. A negative value represents favorability for a spin aligned (ferromagnetic) state, while a positive sign represents favorability for a spin anti-aligned (antiferromagnetic) state. The number of clusters used in this model is determined by a cross validation (CV) score given by
 $C{V^2} = \mathop \sum \nolimits {\left( {{E_{{\rm{DFT}}}} - {E_{{\rm{model}}}}} \right)^2}$. Here,
 ${E_{{\rm{DFT}}}}$ and
 ${E_{{\rm{model}}}}$ are the energetic predictions for a material given by DFT and the cluster expansion model, respectively. The combination of clusters that minimizes this score for a set of test DFT data then determines the final clusters used in the model.
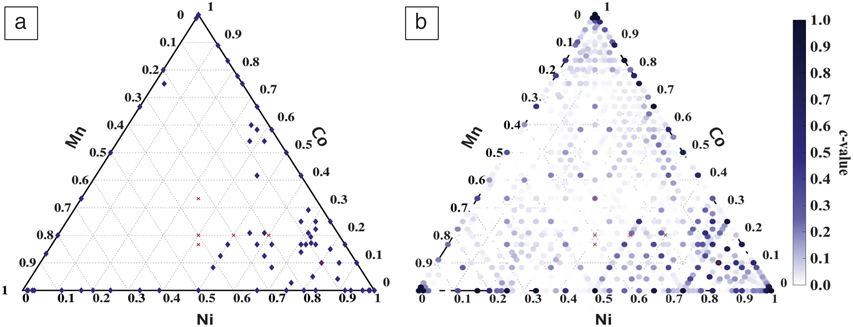
Once the model is fit, it is then solved for various compositions using Metropolis Monte Carlo simulationsReference Metropolis, Rosenbluth, Rosenbluth, Teller and Teller77 to stochastically solve for the change in enthalpy and to compute the configurational entropy to find the final change in Gibbs free energy. Once the change in Gibbs energy is found for all compositions to be sampled, a convex hull analysis of the phase space is performed to identify the set of thermodynamically stable compositions. The final phase diagram produced, as seen in Figure 6a, yields an exhaustive prediction of the possible transition-metal compositions that would produce energetically stable cation ordering.Reference Metropolis, Rosenbluth, Rosenbluth, Teller and Teller77 Any composition that does not appear as a point on the final phase diagram is predicted to be more stable as a mixture of neighboring compositions. In practice, a cathode at this composition could be made by annealing the material to a high enough temperature such that an entropically driven disordered arrangement of transition metals is present. This arrangement, however, would not be stable over long cycling of the cathode and would therefore provide poor cycle life.
The ternary phase diagram of the Li-Ni-Mn-Co-O2 system (a) from a single self-consistent density functional theory calculation and (b) with the incorporation of uncertainty quantification. Each blue marker represents a computationally predicted phase, with the darker markers signifying a prediction with a higher c-value for the diagram with uncertainty quantification.Reference Tang and Holzwarth73 On each, the red markers represent experimental phases from Reference 74.

A unique aspect of this phase search work enabled through the BEEF-vdW implementation is the incorporation of uncertainty estimation. The sensitivity of the convex hull with respect to error can be understood through Figure 5. When the error bar of an energy prediction dips below the convex hull in a case where the predicted energy is above the convex hull, the correctness of the hull comes into question. This is because a different energy prediction (another DFT functional could give a different prediction for the energy at the same composition) that is within the error of DFT but now below the hull would change the shape of the hull. Given the energetic sensitivity of a convex hull analysis, proper understanding of the uncertainty within DFT and how it propagates to the final prediction is necessary for computational work with true predictability. Using the BEEF-vdW,Reference Wellendorff, Lundgaard, Møgelhøj, Petzold, Landis, Nørskov, Bligaard and Jacobsen19 an ensemble of energies was generated as DFT training data for the NMC cluster expansion, each solved with Monte Carlo simulations, and for each, a final convex hull was generated. The number of times a specific composition appears on the final hull is counted, and the normalized count is then quoted as a confidence value (c-value), similar to that described previously.Reference Houchins and Viswanathan26
With this c-value, we can rank the likelihood, according to our model, that a given phase will be stable if made experimentally. Given the number of newly predicted phases from this work, this lowers the likelihood of a false positive and therefore narrows the phase space further. The identification of a stable phase at a given composition is a classification problem. The incorporation of uncertainty ensures that possible candidate materials are not missed because of errors in the DFT training data, and many more candidates are identified, as seen in Figure 6b.
As mentioned previously, convex hull analysis is highly sensitive to the absolute error of each energetic prediction. If the energy of a phase, which in reality should be on the convex hull, was overestimated within the known accuracy of DFT but slightly more overestimated than neighboring compositions, it would not appear on the convex hull unless this DFT uncertainty was included. Within this work discussed previously, LiNi0.33Mn0.33Co0.33O2, commonly referred to as NMC 111, was not predicted by the single functional hull despite being one of the most predominately used phases.Reference Houchins and Viswanathan71 With the incorporation of uncertainty, however, the phase re-emerged with a c-value of 0.21. The c-value for NMC 111 can be used as a benchmark for the numerical value that the c-value must have for a phase to plausibly exist. In other words, any phase with a c-value higher than 0.2 is worth further investigation, while anything lower should only be tested further with the assumption of high risk for a false positive.
With our analysis, we can also make an informed prediction about the exact composition of some of the currently used cathode materials. For example, NMC 532 with the experimentally proposed composition of LiNi0.5Mn0.3Co0.2O2 was predicted with a c-value of 0.058, while the closely neighboring phase LiNi0.5Mn0.292Co0.208O2 with the exact Ni-Mn-Co proportions of 12:7:5 was predicted with a c-value of 0.37. Similarly, NMC 622 (LiNi0.6Mn0.2Co0.2O2) did not appear on any of the convex hulls and, therefore, presents with a c-value of 0, while LiNi0.584Mn0.208Co0.208O2 was predicted with a c-value of 0.25.Reference Houchins and Viswanathan71 This type of insight into the exact composition and cation ordering that is present in experimentally used cathode materials can only be achieved with models that give a prediction confidence derived from uncertainty quantification. This level of insight, however, is necessary for reliable and accurate future modeling of these materials, their properties, and their performance.
Summary
Computational materials discovery based on DFT calculations has been in a golden age over the last two decades, leading to numerous novel candidate materials with improved functionality. However, as the number of screening criteria increases, we are approaching practical limits because of the finite uncertainty associated with the DFT predictions. Uncertainty quantification and propagation will need to become an integral part of future computational materials discovery studies to increase the likelihood of success. Using two examples, we have shown systematic approaches to improve the predictability by quantifying the confidence of the DFT predictions. Given the ease of integration in numerous materials science applications not only in the work discussed here, but also in many other cases,Reference Christensen, Hansen and Vegge28–Reference Medford, Wellendorff, Vojvodic, Studt, Abild-Pedersen, Jacobsen, Bligaard and Nørskov30 we believe uncertainty quantification and propagation should be performed for all future computational material discovery studies. Future directions should involve propagating uncertainty through full reaction network models, phase diagram models, such as those used in the Calculation of Phase Diagram method, and in multiphysics models, such as phase-field modeling that uses DFT data for input parameters.
Acknowledgments
G.H, D.K., and V.V. gratefully acknowledge funding support from the National Science Foundation under awards CBET-1604898 and CBET-1554273 and from the Scott Institute for Energy Innovation at Carnegie Mellon University.

Gregory Houchins is a doctoral candidate in physics at Carnegie Mellon University (CMU). He received his bachelor’s degree in physics from James Madison University. His research focuses on computational material discovery of next-generation cathodes and uncertainty propagation for density functional theory-predicted properties. He played a key role in the setup of a new CPU/GPU cluster named Arjuna at CMU. He is a recipient of the Best Poster Award at the Pittsburgh Quantum Institute Annual Conference, PQI 2017. He is a co-principal investigator on an Extreme Science and Engineering Discovery Environment Resource Allocation Award. Houchins can be reached by email at ghouchin@andrew.cmu.edu.

Dilip Krishnamurthy is a doctoral candidate in mechanical engineering at Carnegie Mellon University (CMU). He graduated from the Indian Institute of Technology, Madras, with bachelor’s and master’s degrees in mechanical engineering. His research focuses on computational materials discovery in the areas of electrocatalysis for energy-storage and conversion devices, and next-generation battery chemistries, such as lithium-oxygen batteries. He is a recipient of the Kokes Award from the North American Catalysis Society, the Bradford and Diane Smith Fellowship, Bushnell Fellowship in Engineering, and the Sundback Graduate Fellowship at CMU. Krishnamurthy can be reached by email at dkrishn1@andrew.cmu.edu.

Venkat Viswanathan is an assistant professor of mechanical engineering at Carnegie Mellon University (CMU). He received his PhD degree from Stanford University in 2013, and spent a year as a postdoctoral researcher at the Massachusetts Institute of Technology. At CMU, he leads an interdisciplinary group working on technologies that can accelerate the transition to sustainable energy. He is a recipient of numerous awards, including an Alfred P. Sloan Fellowship, National Science Foundation CAREER Award and the Office of Naval Research Young Investigator Program Award. Viswanathan can be reached by email at venkvis@cmu.edu.