Introduction
Glacier surface topography is fundamental to almost all investigations of glaciers, in particular the measurement of glacier change. Traditional aerial photogrammetry has provided this essential information for many decades, giving a typical elevation accuracy of around 0.5 m for 1:10 000 vertical images (Blachut and Müller, 1966), but field preparation and analysis are time-consuming. Recent digital photogrammetric methods and global positioning system (GPS) navigation have automated the analysis of images somewhat. However, photographs of the glacier surface must contain some degree of contrast in order to correlate image pairs. Photogrammetric surveys tend therefore to be restricted to late summer, when snow cover is at a minimum. Also, contrast may be poor in accumulation areas, and surveys can be severely affected by summer snowfalls, so maps may contain large areas where no reliable elevations could be obtained. Surveys are also very sensitive to the weather since all reference points needed for aerotriangulation must be visible. For large ice caps there may be no visible reference points in images, increasing-errors further. Derived products such as digital elevation models (DEMs), slopes and estimates of volume change are thus often of poor quality.
Other methods exist for measuring elevations along profiles, although a considerable number of profiles may be needed to obtain sufficient coverage for calculation of volume change, for example. In particular, kinematic GPS surveys provide very accurate (typically ± 10 cm) elevations (see, e.g., Jacobsen and Theakstone, 1997). Garvin and Williams (1993) describe airborne (non-scanning) laser altimetry, a remote-sensing method of obtaining glacier surface elevation along profiles. The equipment consists of a laser ranger mounted in an aircraft with kinematic GPS navigation, and was used to measure ice surface profiles in Iceland and Greenland. Echelmeyer and others (1996) describe volume-change measurements in Alaska made using a similar portable system. However, repeat measurements along identical ground tracks are not possible with a non-scanning system, due to errors of typically 50 m or so in aircraft navigation.
Scanning enables repeat surveys to be made for measurement of ice thickness change, since overlapping coverage can be guaranteed provided swath width is at least 100 m or so. Krabill and others (1995a) describe a scanning laser altimeter system developed by NASA. A nutating mirror produces an elliptical spiral of data points at 800 Hz within a swath of 200 m width typically. Aircraft position and attitude are measured using GPS and inertial navigation system (INS), respectively, and accuracies of 10–20 cm were obtained over Greenland when data were included from rigorous calibration before, during and after each flight. Results from extensive measurements in Greenland are described by Krabill and others (1995b) and Thomas and others (1995).
Here we describe a new prototype airborne scanning system and results from Hardangerjökulen in Norway, and assess the potential of laser altimetry for mapping glacier surface elevation. The equipment is similar to that described by Krabill and others (1995a), but is designed for fast and reliable production of DEMs, with ease of use and serial production in mind.
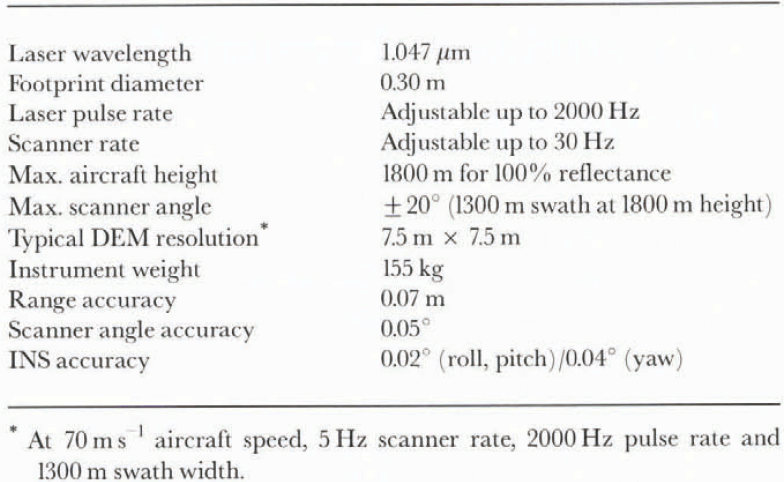
ALTM laser scanner specifications and accuracy (Fotonor AS, 1996; personal communication from J. Lindenberger, 1996)

Equipment
The prototype system has been developed jointly by Optech in Canada and TopScan in Germany and is known as ALTM (airborne laser terrain mapping system).The equipment mounts directly into standard Leica, Zeiss and Wild aerial camera frames. It consists of a laser ranger, a scanning mirror to direct the transmitted and reflected beam, a GPS and INS platform for aircraft position and orientation, a computer for data processing and a tape drive for data storage. Unlike the NASA system, the ALTM laser beam is swept perpendicular to the ground track, producing a more even distribution of data points. In addition, no ground control or calibration is necessary apart from a 10 min automatic calibration prior to take-off. Equipment specifications are given in Table 1, together with accuracies which have been determined by extensive testing. A new version of the ALTM with reduced weight (72 kg) and twice the maximum laser range is currently under development. The accuracy of surface elevations is affected principally by uncertainties in laser range (7 cm) and GPS position (about 10 cm vertically). Errors in scanner and INS angles will also affect elevation accuracy, although this is not serious for relatively flat glacier surfaces. An error of 0.05° in scanner angle, for example, corresponds to a 1.6 m error in horizontal position at 1800 m range, and thus 0–16 cm error in elevation for a 10% surface slope. The expected overall accuracy in derived elevation is therefore on the order of 15 cm. Calculated elevations are in WGS84 coordinates, such that local geoid height is required to transform to orthometric elevations. Some overlap of parallel swaths is recommended in order to ensure complete coverage and as a check on data quality, so a spacing between flight tracks of 1 km is advisable over snow-covered glacier surfaces.
Measurements on Hardangerjökulen
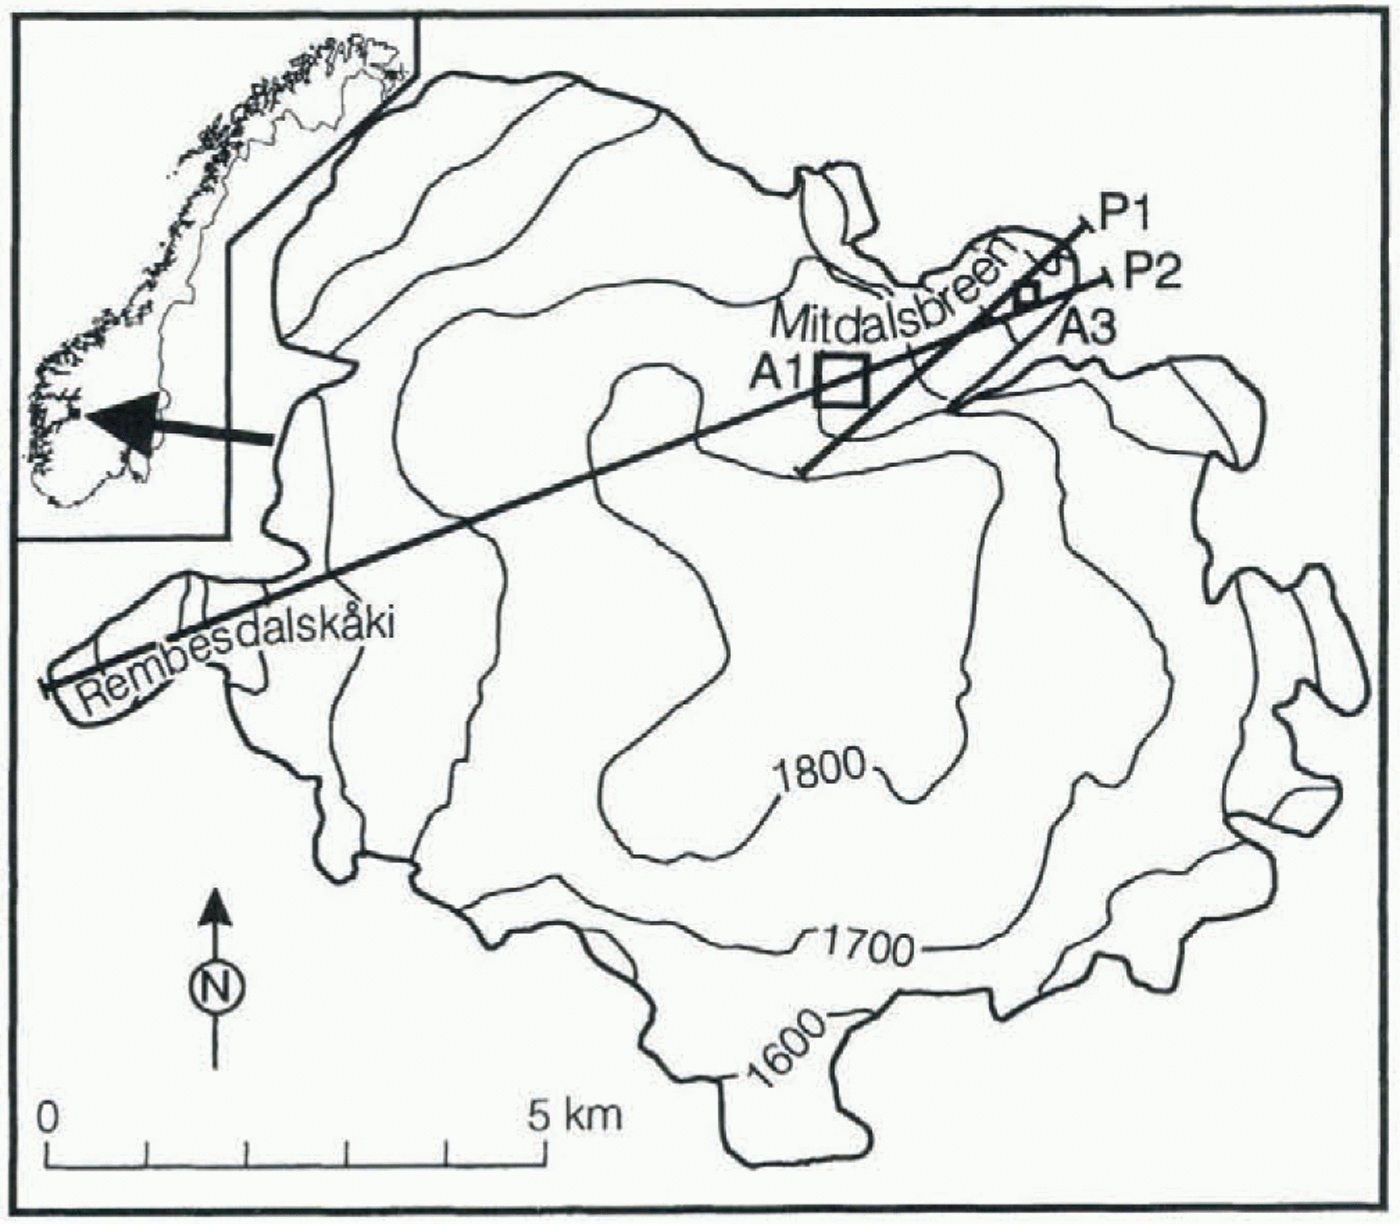
The ALTM was installed in a Piper Navajo aircraft belonging to a Norwegian photogrammetry company, Fotonor AS, on 19 October 1995, and tested over a wide variety of ground and vegetation types from 19 to 21 October. A laser pulse rate of 2000 Hz, scanner rate of 7 Hz, scanner angle of 20” and aircraft speed of 70 m s−1 were used in all measurements. On 21 October two profiles, P1 and P2, were flown over Hardangerjökulen in Norway (Fig. 1), corresponding to a height above the glacier surface of 600–1300 m and a
Altimeter flight tracks P1 (2400 m a.s.l.) and P2 (2600 m a.s.l.) on Hardangerjökulen in Norway, and areas A1 (500 m × 500 m) and A3 (200 m × 200 m) used in analysis of the data. Area A2 (200 m × 200 m) is centred within A1. Elevation contours are in m a.s.l. Swath width varies from about 500 m at 1800 m a.s.l. to about 900 m at 1300 m a.s.l.
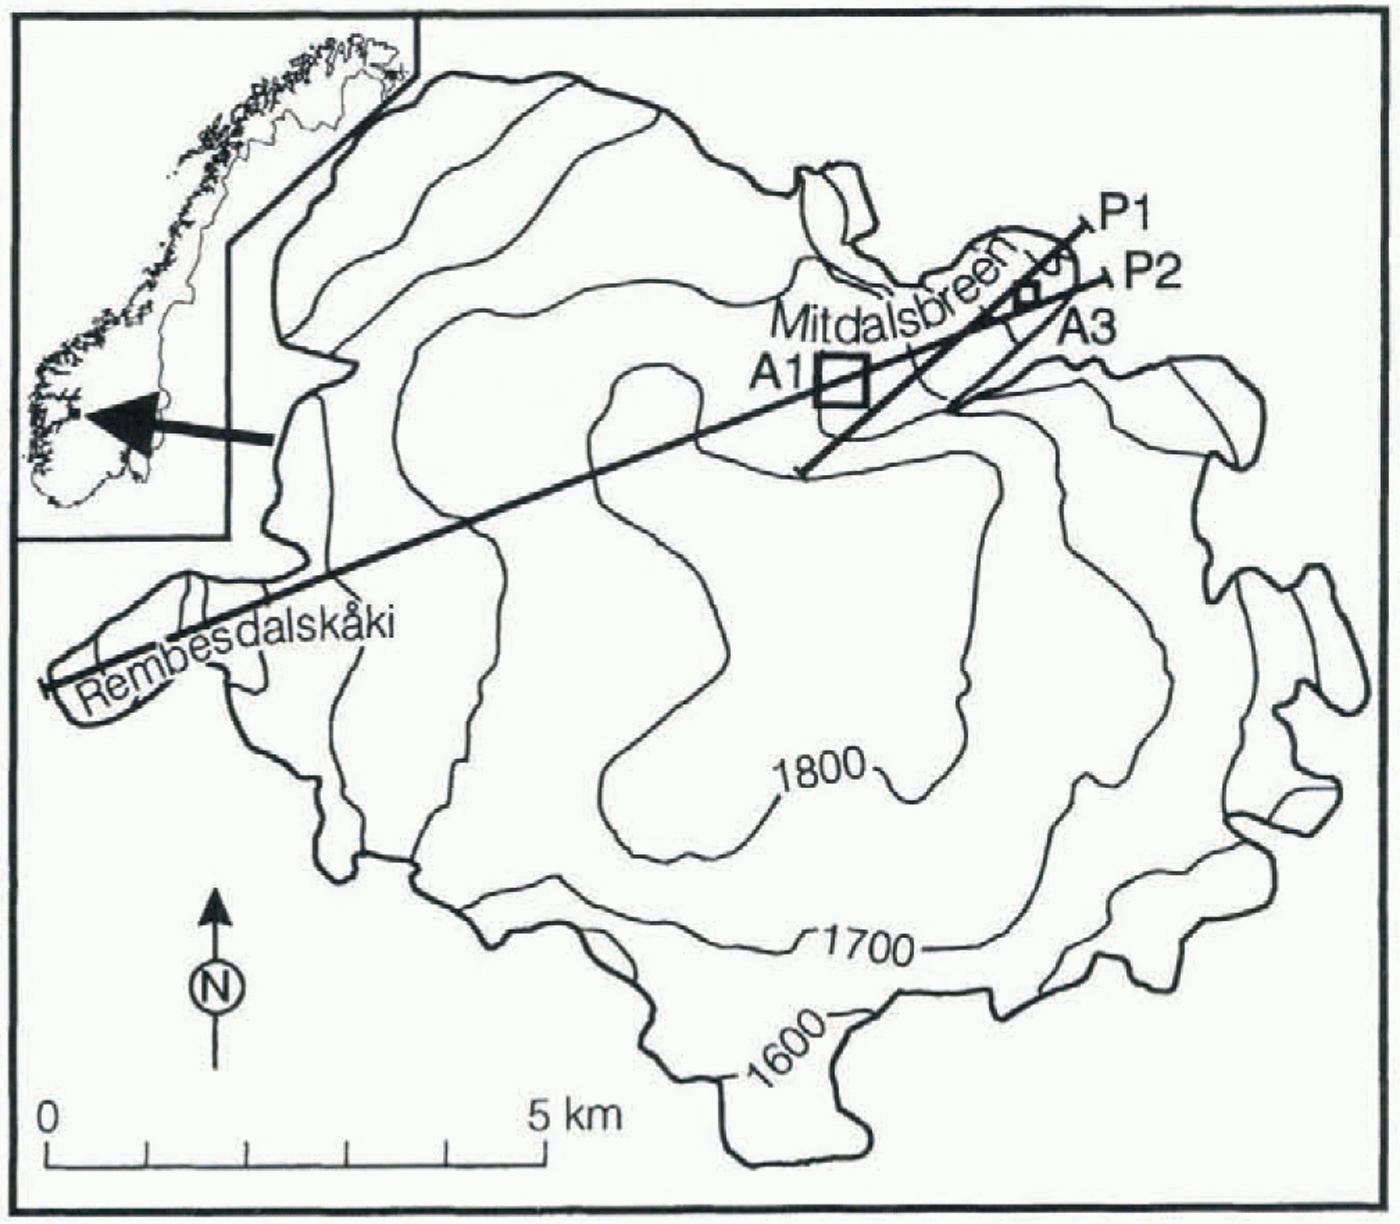
swath width of 450–950 m. The two profiles were flown within a period of 15 min. Reference GPS receivers were placed at Finse, 4 km north of the Midtdalsbreen outlet glacier, and at Jostedal, 120 km further northwest. No reference data were acquired at Finse during the P1 profile, however, due to technical problems with the receiver. Geoid height is +46 m a.e. (above WGS84 ellipsoid) at Hardangerjökulen. Elevations have not been transformed to m a.s.l. in the analysis below.
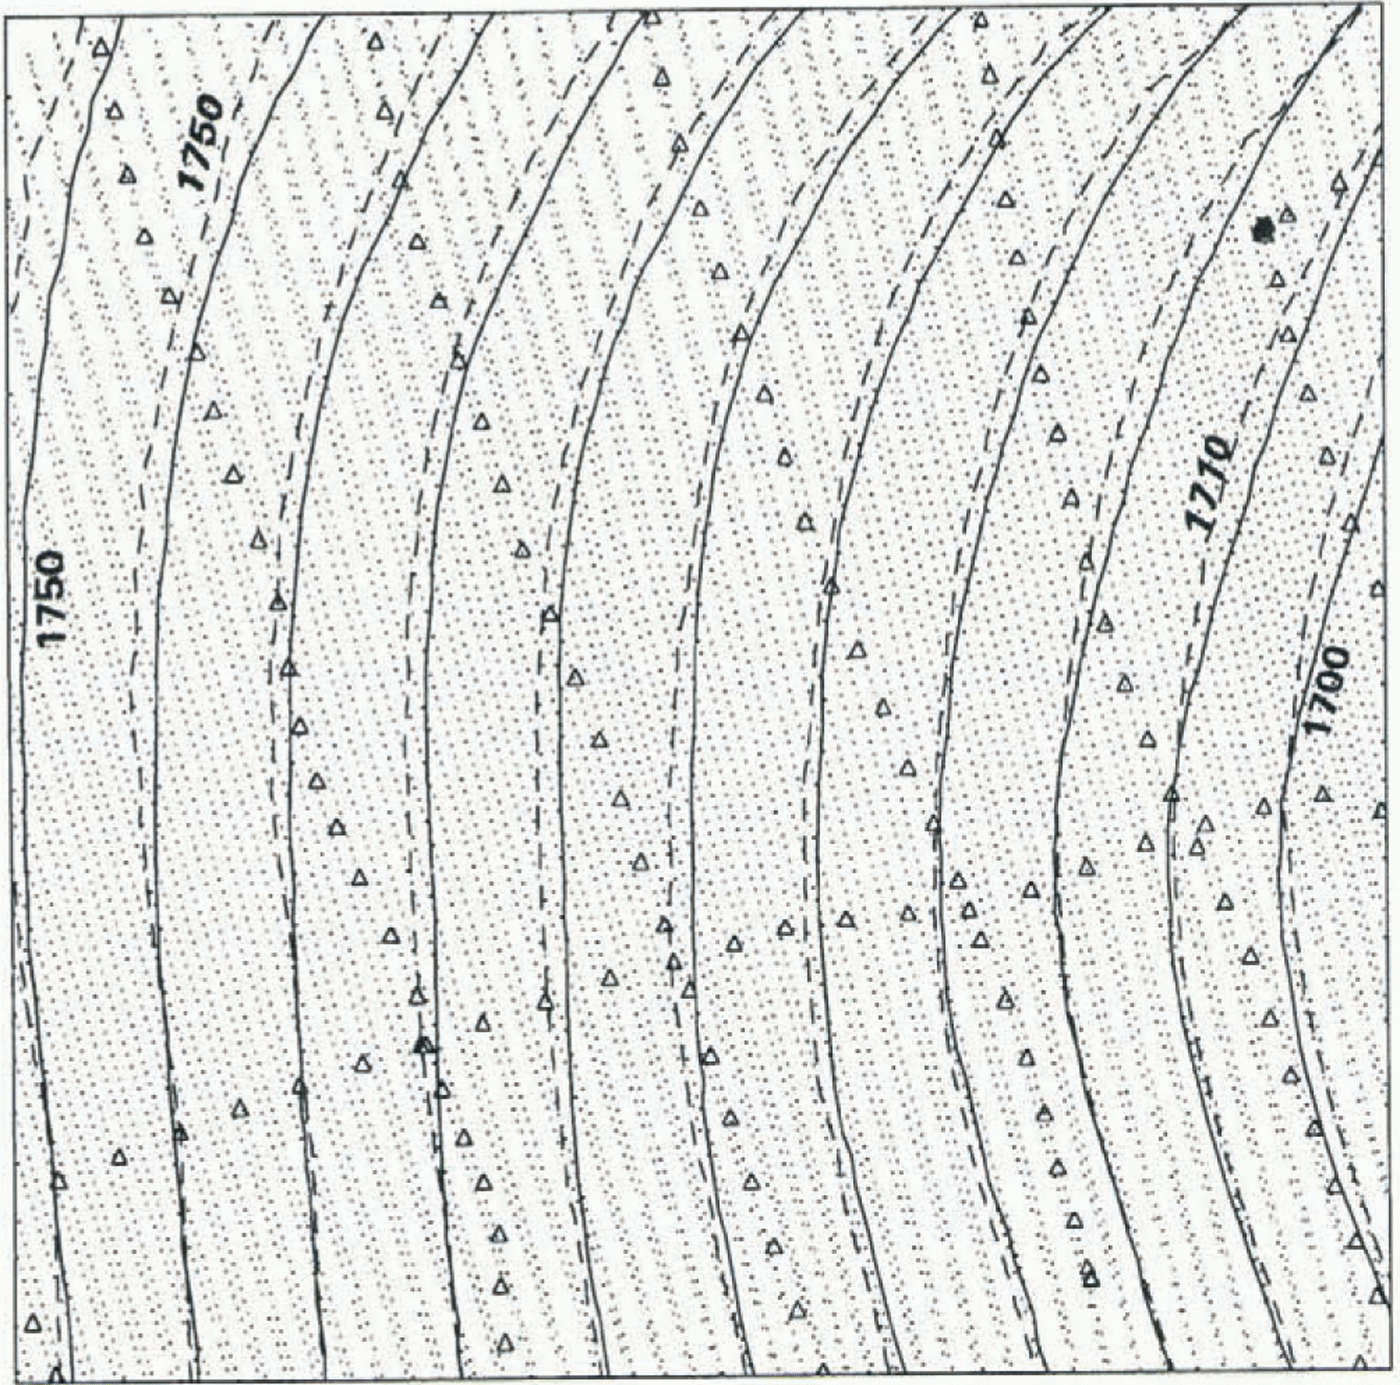
ALTM elevations (dots) and derived elevation contours (solid lines) within a 500 m × 500 m area A1, together with ground-based GPS elevations (triangles) and derived elevation contours (dashed lines). North is upwards. Contour interval is 5 m, with elevations in m a.e. (above WGS84 ellipsoid).
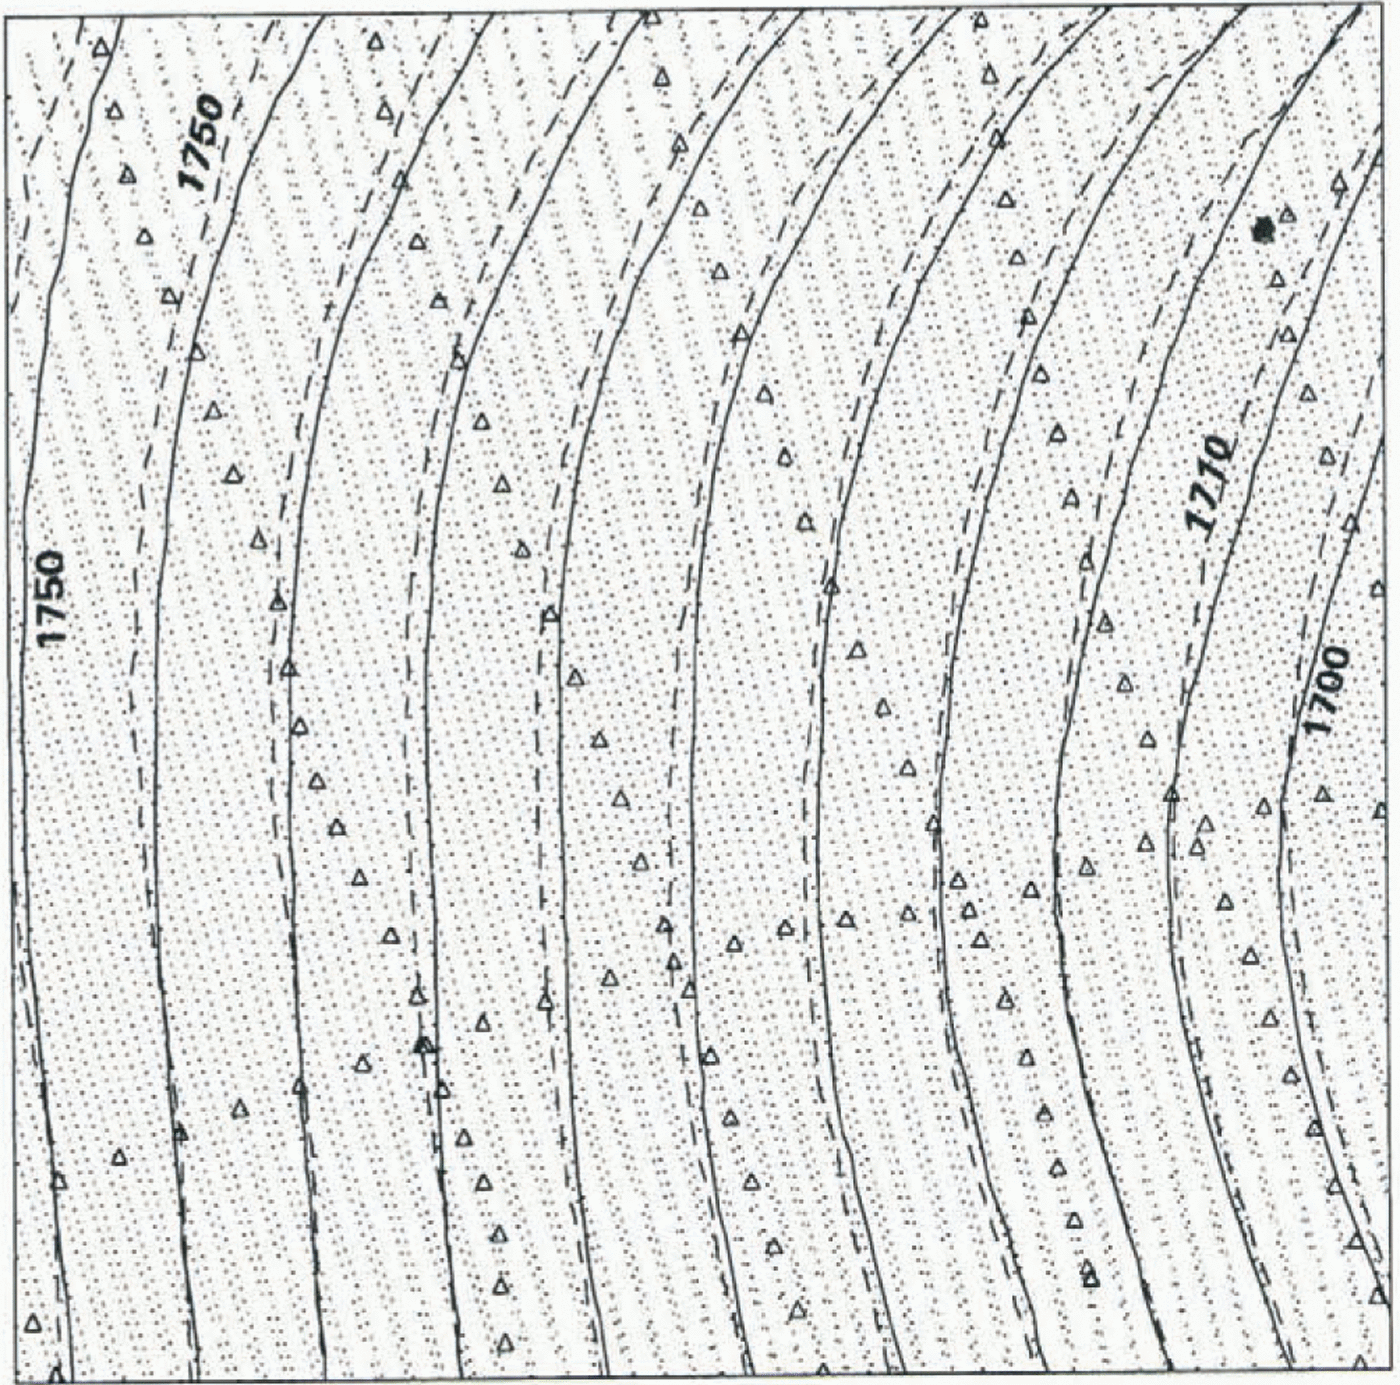
A total of almost 148 000 elevations along the P2 profile was derived from the 3 min of ALT M acquisition using Finse reference GPS data. Generally almost 100% of the laser pulses have resulted in an elevation over smooth snow-covered surfaces, but coverage is much reduced over two small crevassed areas on the lower part of Midtdalsbreen, presumably due to a combination of rougher (ice) surfaces with a lower reflectance, and large (1100 m) laser range. Low, dense cloud on the western side of the ice cap caused erroneous elevations from cloud tops, but these are easy to identify in the elevation data. Figure 2 shows the distribution of 9945 laser elevations and derived ice-surface elevation contours (solid lines) within an example 500 m × 500 m area A1 (Fig. 1) close to the equilibrium line (about 1700 m a.s.l.). Contours have been generated directly from a krig-interpolated 10 m × 10 m grid using a search radius of only 10 m, yet they are very smooth, indicating a lack of noise in the data. This is the case over the whole of the glacier covered by the swath apart from the two crevassed areas.
Data Quality
No independent data on glacier surface elevation exist for Midtdalsbreen for October 1995. However, almost 60 km of kinematic GPS ground profiles were acquired on the glacier from 4 to 8 April 1995 in connection with ice radar measurements. These are of good quality, with an estimated absolute error in elevation of 10 cm. Figure 2 shows the distribution of 127 ground-profile elevations within A1, together with derived elevation contours (dashed lines). Contours have been generated from a triangular irregular network (TIN), which is better suited to interpolation of data distributed along lines than kriging. There is good agreement between the patterns of contours, with a fairly systematic difference in elevation of 3.5–6 m due to meltingof snow between April and October. The ALTM-derived contours indicate a smooth glacier surface within A1, such that the separation between GPS ground profiles (typically 100 m) is sufficiently small to model the surface accurately. However, it is apparent from the two distributions of data in Figure 2 that ALTM data would be better able to model roughness on length scales of less than 100 m.
The average elevation difference within A1 between the data sets (ALTM less ground-based GPS) is -4.43 in. For comparison, snow depths (to the 1994 summer surface) of 5.2 and 1.0 m are estimated at 1700 m a.s.l. on Rembesdalskaaki (Fig. 1) on 23 May and 9 October 1995, respectively, using mass-balance sounding and stake profiles there. Based on these data, the change in snow depth within At between 6 April and 21 October 1995 is estimated to be -4.2 ± 1 m (personal communication from H. Elvehøy, 1996). We expect little vertical motion of the summer surface here since it is close to the ELA, so the estimated change in surface elevation is the same. The elevation change derived from ALTM and GPS ground-profile data is therefore consistent with this estimate from mass-balance measurements. The absolute accuracy of the ALTM data cannot be confirmed to better than 1 m by comparison with ground-elevation and mass-balance data. However, ALTM and ground measurements elsewhere by Fotonor AS in June 1996 give an absolute error of 10 cm in the ALTM data (personal communication from I. Høydal, 1996).
Random error (or noise), i.e. the relative error in individual laser elevations, has been assessed using geostatistical methods on a subset of the elevation data. A 200 m × 200 m area A2, centred within A1 and covered by swath P2 only, was used. A semivariogram is obtained by calculating semivariance (Z i – Z j) 2/2 for all possible pairs of points (i, j), where Z is elevation, and plotting semivariance averaged in bins as a function of lag, i.e. horizontal separation between the points. The random error is related to the semi-variance at zero lag (see, e.g., Herzfeld and others (1993) and references therein for more information on geostatistical methods). Performing this analysis on the Finse-referenced data from A2 gives a random error of only 1.8 cm. For comparison, the Jostedal-referenced elevations within A2 imply a random component of 4.2 cm, indicating poorer results using the longer differential GPS (DGPS) baseline, although noise is still small.
The same analysis has been carried out on an area covered by the two independent laser-scanner swaths, P2 and P1. A 200 m × 200 m area A3 (Fig. 1) at 1450 m a.s.l. and close to the glacier front was chosen, giving a noise estimate of 11 cm for the Jostedal-referenced data (no Finse-referenced data from swath P1 are available). Included in this error is the difference between the two swaths, which gives us an estimate of the repeatability of measurements. We expect that errors of slightly less than 11 cm would have been obtained for an area covered by two swaths of Finse-referenced elevations, due to the shorter DGPS baseline, and conclude that the repeatability of measurements is of the order of 10 cm.
Conclusions
The surface elevation of part of Midtdalsbreen, Hardangerjökulen, has been measured by airborne scanning laser altimetry. Elevation contours are very smooth despite the high resolution of the grid from which they are generated, and there is no need for any smoothing of the grid or of contours, indicating little noise in the data. This is an important consideration in calculation of surface slope, for example. Comparison of ALTM elevations with GPS ground profiles measured approximately 6 months earlier indicates a change in surface elevation of -4.43 m, consistent with an estimate of -4.2 ± 1 m from mass-balance measurements. Almost 100% of the laser pulses have provided an elevation over smooth snow-covered surfaces at a range of up to 1300 m. Some loss of data has occurred over areas with bare ice and crevasses. However, experience from other surfaces suggests that elevations should be measurable over crevassed bare ice surfaces, provided range from the aircraft is 800 m or less.
The low noise levels in the ALTM data are confirmed by geostatistical analysis of areas covered by a single swath, giving a noise estimate of only 1.8 cm. From a similar analysis of an area covered by the two independent swaths we deduce a repeatability of around 10 cm, consistent with the 15 cm absolute error estimated from manufacturer’s measurements and an error of 10 cm measured over an ice-free area in Norway.
Scanning laser altimetry has many advantages over other methods of obtaining two-dimensional glacier surface elevation. Networks of one-dimensional profiles give excellent accuracy along profiles but often leave large areas without data. This may result in large interpolation errors if surface elevation contains significant roughness cm length scales less than the separation between profiles. Problems with photogrammetry include the poor contrast of snow-covered glacier surfaces, the necessity for cloud-free conditions over almost the entire image, the field and analysis time involved and the variable quality of derived elevations. Smooth snow-covered surfaces are, however, ideal reflectors for laser altimetry. Use of the ALTM equipment requires no field preparation or ground control apart from setting up a reference GPS receiver within 50 km or so of the area to be scanned. Altimeter data can be obtained in partial or high cloud conditions, and in lighting conditions that would not permit photogrammetry. Acquisition is rapid, with complete coverage obtained by parallel flight tracks with about 1 km sparing. A swath width over snow of over 2 km is expected with ALTM versions under development. Post-processing is unsupervised and can be performed within a few hours, and elevation accuracy is better than generally possible with photogrammetry. Scanning laser altimetry therefore has excellent potential as a remote-sensing tool for mapping of glaciers.
Acknowledgements
The authors are grateful to Fotonor AS for coordinating the field trials of the scanning laser altimeter in Norway, to G. Anker for help with initial analysis of the data, and to K. Melvold and K. Østen for providing the raw ground-based GPS data and Finse reference GPS data. We also thank the anonymous reviewers for many helpful comments.