INTRODUCTION
Phosphorus (P) is considered to be the element most commonly limiting productivity of humid tropical forests on weathered soils (Hedin Reference HEDIN2004, Reich & Oleksyn Reference REICH and OLEKSYN2004, Vitousek Reference VITOUSEK1984). Weathered soils in the tropics are known to contain relatively low levels of labile P and total P. This is due to low inputs of primary mineral P (calcium apatite P), the formation of recalcitrant organic matter as organic P and the occlusion of inorganic P by iron and aluminium oxides, rendering P largely unavailable to the organisms (Walker & Syers Reference WALKER and SYERS1976). Phosphorus availability to plants primarily depends on the pool size of a labile soil P fraction, but not of an occluded soil P fraction. Where the productivity of humid tropical forests is limited by P, the pool size of labile P is generally small in the topsoil (Crews et al. Reference CREWS, KITAYAMA, FOWNES, RILEY, HERBERT, MUELLER-DOMBOIS and VITOUSEK1995, Kitayama & Aiba Reference KITAYAMA and AIBA2002, Paoli & Curran Reference PAOLI and CURRAN2007). Labile P pools may also exist in subsoil horizons because portions of labile P are supplied through weathering of bedrock. The concentration and pool size of P fractions in tropical soils have been well documented in reference to the effects of soil age (Crews et al. Reference CREWS, KITAYAMA, FOWNES, RILEY, HERBERT, MUELLER-DOMBOIS and VITOUSEK1995, Kitayama et al. Reference KITAYAMA, AIBA, TAKYU, MAJALAP and WAGAI2004), substrate (Cross & Schlesinger Reference CROSS and SCHLESINGER1995, Kitayama et al. Reference KITAYAMA, MAJALAP-LEE and AIBA2000), topography (Chacón et al. Reference CHACÓN, DEZZEO, MUÑOZ and RODRÍGUEZ2005, Tiessen et al. Reference TIESSEN, CHACON and CUEVAS1994), and human disturbance (Frizano et al. Reference FRIZANO, VANN, JOHNSON, JOHNSON, VIEIRA and ZARIN2003, Garcia-Montiel et al. Reference GARCIA-MONTIEL, NEILL, MELILLO, THOMAS, STEUDLER and CERRI2000, Lawrence & Schlesinger Reference LAWRENCE and SCHLESINGER2001, Lawrence et al. Reference LAWRENCE, D'ODORICO, DIEKMANN, DELONGE, DAS and EATON2007). By contrast, patterns of soil P fractions have been seldom investigated across soil horizons including deep soils (but see Frizano et al. Reference FRIZANO, JOHNSON, VANN and SCATENA2002).
The Walker and Syers model of soil P fractions during pedogenesis (Walker & Syers Reference WALKER and SYERS1976) predicted that the organically bound soil P increases with soil weathering. The primary mineral-P (e.g. calcium apatite) present at the onset of soil formation slowly dissolves with time, and is either taken up by organisms and then enters the organic phosphorus (Po) pool, or is sorbed onto secondary mineral surfaces and eventually occluded by Fe and A1 oxides. Heavily weathered tropical soils are therefore dominated by Po fractions and occluded P fractions (Cross & Schlesinger Reference CROSS and SCHLESINGER1995). Phosphorus taken up by organisms (Po) may become incorporated into chemically recalcitrant decomposition products (stable Po), or may be cycled back to the inorganic soil pool (which is the labile Po). Labile Po fraction is mineralized by the phosphatase secreted from plant roots and microbes, and then the released Pi is either absorbed by plant fine roots or is immobilized (Stewart & Tiessen Reference STEWART and TIESSEN1987, Vincent et al. Reference VINCENT, TURNER and TANNER2010). Understanding the relationships between the amount of labile P (both Pi and Po), phosphatase activity and fine-root biomass is crucial for a comprehensive understanding of P availability to plants.
Above-ground vegetation is another important reservoir of Po within a forest, as well as soils. The concentration of P in trees can vary among organs. Leaf P in terms of the concentrations, fractions and biomass have been well studied (Hidaka & Kitayama Reference HIDAKA and KITAYAMA2009, Hughes et al. Reference HUGHES, KAUFFMAN and JARAMILLO1999, Turnbull et al. Reference TURNBULL, WARREN and ADAMS2007, Villar et al. Reference VILLAR, ROBLETO, DE JONG and POORTER2006, Wright et al. Reference WRIGHT, REICH, WESTOBY, ACKERLY, BARUCH, BONGERS, CAVENDER-BARES, CHAPIN, CORNELLSSEN, DIEMER, FLEXAS, GARNIER, GROOM, GULIAS, HIKOSAKA, LAMONT, LEE, LEE, LUSK, MIDGLEY, NAVAS, OLEKSYN, OSADA, POORTER, POOL, PRIOR, PYANKOV, ROUMET, THOMAS, TJOELKER, VENEKLAAS and VILLAR2004, Reference WRIGHT, REICH, CORNELISSEN, FALSTER, GARNIER, HIKOSAKA, LAMONT, LEE, OLEKSYN, OSADA, POORTER, VILLAR, WARTON and WESTOBY2005), but the P in woody organs, which may function as an important reservoir of P because of the generally greater biomass in woody organs than in leaves, has not been well quantified. Measurements of the concentration and amount of P in each of the different organs and the total amount of P in the above-ground biomass are still few in the Neotropics (Feldpausch et al. Reference FELDPAUSCH, RONDON, FERNANDES, RIHA and WANDELLI2004, Hughes et al. Reference HUGHES, KAUFFMAN and JARAMILLO1999, Johnson et al. Reference JOHNSON, VIEIRA, ZARIN, FRIZANO and JOHNSON2001, Kauffman et al. Reference KAUFFMAN, CUMMINGS, WARD and BABBITT1995) and are unknown in South-East Asian tropical forests. This contrasts with the other elements affecting the global climate such as carbon (C) and nitrogen (N) in which these pools in vegetation have been measured elsewhere across the tropics (Rodin & Bazilevich Reference RODIN and BAZILEVICH1967).
Bornean tropical rain forests on soils derived from sedimentary rocks are known to be controlled by P (Hidaka & Kitayama Reference HIDAKA and KITAYAMA2009). These soils consist mainly of stable Po and refractory occluded Pi (Cross & Schlesinger Reference CROSS and SCHLESINGER1995, Kitayama et al. Reference KITAYAMA, MAJALAP-LEE and AIBA2000). We hypothesize that the bulk of labile P is bound in the vegetation in such a Bornean forest and only a small fraction will occur in the soils. We further hypothesize that most soil-labile P will occur in the topsoil, and the distribution of fine roots corresponds to the distribution of the labile P fraction in soils.
METHODS
Study site
This study was carried out in Deramakot Forest Reserve, a 55 083-ha forest, located in Sabah, Malaysian Borneo (5°22′N, 117°25′E). The climate is maritime equatorial. The mean monthly temperature is 27 °C with little seasonal variation. The annual precipitation is c. 3500 mm, with no pronounced dry season (Kleine & Heuveldop Reference KLEINE and HEUVELDOP1993). The region is characterized by Tertiary sedimentary rocks. Soils are mainly Acrisols that are generally poor in nutrients, well drained, and easily eroded. The altitude is between 130 and 300 m asl. The vegetation is a mixed dipterocarp lowland tropical rain forest.
Biomass estimation
In the pristine forest, a 2-ha permanent plot (100 × 200 m), consisting of 10 × 10-m subplots, was established using a surveying compass. Most of the plot was on the flat ridge and gentle slope, and it included three steep valleys. The elevational difference between the highest and lowest points in the plot was 45.8 m. We computed slope inclination of a subplot by approximating the ground surface to a plane, applying the least squares regression to three-dimensional coordinates of the four corners (Itoh et al. Reference ITOH, YAMAKURA, OHKUBO, KANZAKI, PALMIOTTO, LAFRANKIE, ASHTON and LEE2003, Yamakura et al. Reference YAMAKURA, KANZAKI, ITOH, OHKUBO, OGINO, CHAI, LEE and ASHTON1995). We then classified subplots as flat ridge (2.1°–10°), and gentle (10°–30°) and steep slope (30°–43.7°). The number of subplots in flat ridge, and gentle and steep slope was 27, 123 and 50, respectively.
All trees ≥10 cm diameter at breast height (dbh) within the plot were measured in September 2006. We established 100 5 × 5-m plots within a 2-ha plot (designed alternately with and without a 5 × 5-m plot), and measured the small trees of 5–10 cm dbh growing within the 5 × 5-m plots. Buttressed trees were measured at well above (c. 50 cm) the protrusions. Voucher specimens were collected from trees that could not be identified in situ.
The heights of trees were measured in a 0.2-ha plot (40 × 50 m) in the gentle slope using a digital hypsometer (Vertex III, Haglöf, Sweden). The relationship between dbh (D) and tree height (H) was regressed by a hyperbolic allometric equation (Ogawa Reference OGAWA and Kira1969):

where A and H* are regression constants. Above-ground biomass (AGB) was estimated from an empirical allometric relationship reported for a tropical lowland dipterocarp forest in East Kalimantan, Indonesia (Yamakura et al. Reference YAMAKURA, HAGIHARA, SUKARDJO and OGAWA1986):

and

where Ws, Wb and Wl are the dry mass of the trunk stem, branches and leaves of a tree, respectively. AGB is the sum of Ws, Wb and Wl. In the calculation of Ws in Eq. 2, estimated H from Eq. 1 was used instead of H.
Coarse-root biomass (Wr) was estimated from an allometric relationship reported for a tropical lowland dipterocarp forest in Peninsula Malaysia (Niiyama et al. Reference NIIYAMA, KAJIMOTO, MATSUURA, YAMASHITA, MATSUO, YASHIRO, RIPIN, KASSIM and NOOR2010):

Sampling of vegetation components
To estimate the amounts of C, N and P in above-ground vegetation, we collected the samples of sun-leaves, bark, and wood from canopy dominant species. Seven canopy dominant species, defined as species with ≥3% in relative basal area (RBA), were collected: six Shorea species of Dipterocarpaceae (Shorea atrinervosa Symington, S. exelliptica Meijer, S. foxworthyi Symington, S. macroptera Dyer, S. multiflora (Burck) Symington, S. parvifolia Dyer) and one Anacardiaceae species (Gluta wallichii (Hook. f.) Ding Hou). The sum of RBA of these seven species attained 33.5%. Three trees were sampled from each of the seven species. Sun-leaves were collected from the crown tops using a catapult. From the same individual trees, bark and wood samples were extracted using a chisel and an increment borer at 1 m height above the ground. Wood cores were sampled from the outermost section within 3 cm from the bark. We collected at least three fully expanded mature leaves, and at least two samples of bark and wood per individual tree, and combined samples by individual tree. In the laboratory, leaves were wiped, and all samples were oven-dried at 70 °C for 3 d and finely ground.
The concentrations of elements, especially N and P, in wood stems usually decrease from an outer sapwood area to the centre across a stem section, due to the reduced vitality and membrane deterioration of the parenchyma cells in the heartwood (Hietz et al. Reference HIETZ, DUNISCH and WANEK2010, Hillinger et al. Reference HILLINGER, HÖLL and ZIEGLER1996, Höll & Lipp Reference HÖLL and LIPP1987, Piispanen & Saranpää Reference PIISPANEN and SARANPÄÄ2002). Therefore, the relative proportions of the two wood compartments (i.e. sapwood and heartwood) and the difference of N and P concentrations between the two wood compartments need to be measured for an accurate determination of wood N and P pools (Augusto & Bert Reference AUGUSTO and BERT2005). However, the relative proportions of the two wood compartments are too difficult to determine for all sample trees. In this study, we extracted 3-cm-long wood core samples which mainly consisted of sapwood with a small amount of heartwood. This may cause an overestimation of wood N and P pools. Therefore, the estimated wood N and P pools indicate the potential maximum values of our study site.
Coarse woody debris
We estimated the mass of coarse woody debris (CWD) in and outside the 2-ha plot using five 20 × 100-m transects. The diameter and length of all CWD ≥ 15 cm diameter fallen on the forest floor were measured in each transect. Standing dead trees ≥15 cm dbh were also measured for the dbh and height. We classified all CWD according to its decomposition state into five classes (Harmon et al. Reference HARMON, WHIGHAM and SEXTON1995). The classes 1–5 from freshest to most rotten were defined according to the following criteria. Class 1 material was a newly fallen solid wood with some leaves and/or fine twigs still attached. Material in class 2 was still solid and had intact bark but no fine twigs or leaves. Class 3 material resembled class 2 except that the bark for this class was rotten or sloughing. Class 4 material is somewhat rotten and could be broken when kicked. Class 5 material was rotten and friable and it could be broken apart with bare hands.
Decayed wood samples were extracted using a power drill from the randomly selected CWD pieces. We collected four wood samples per decay class, but only one sample could be sampled from class-1 materials which rarely occurred. For the pieces of class-5 debris that were too friable to sample with the power drill, we instead inserted a 5-cm-long core sampler (diameter 37 mm) to a known depth and removed all material that filled the core sampler. The extracted samples (n = 17) were oven dried at 70 °C and wood density was calculated as oven dry mass divided by fresh volume. The mass of CWD (Mg ha−1) for classes 1–5 was calculated from the CWD volume (m3 ha−1) of each class and the respective density for the material class.
Soil sampling
We excavated three soil pits down to 1 m deep under closed canopy at each of the three topographic positions (nine soil pits in total) within the plot. Soil samples were collected from two O horizons (O1 and O2 horizon) and four mineral-soil horizons (A, AB, B1 and Bt horizons) in October 2007. The O1 horizon represents Oi horizon comprising freshly fallen litter (twigs <2 cm girth, leaf and other fractions ≥ approximately 1 cm2), and the O2 horizon represents Oe and Oa horizons comprising more fragmented fractions with an accumulation of fine roots. The O horizons were sampled at three random points around each pit using a circular frame (23 cm diameter). At the same sampling point below the O horizons, A horizon (0–5 cm deep) was collected vertically with a 5-cm-long core sampler (diameter 37 mm). For each of O1, O2 and A horizons, three samples per pit were combined to one composite sample (i.e. 3 composites × 3 topographic positions = 9 composites in total for each horizon). The other three horizons below 5 cm (AB, B1 and Bt horizons) were collected horizontally from the wall of the soil pit using the same core sampler. For each of AB, B1 and Bt horizons, one sample was collected per pit. Soils from three pits per horizon were combined to one composite sample per topographic position (i.e. 1 composite × 3 topographic positions = 3 composites in total for each horizon). The boundaries of A–AB, AB–B1 and B1–Bt horizon were 5, 16.4 ± 5.5 and 41.1 ± 6.5 cm deep, respectively (n = 9).
Samples of O horizons were sorted into living roots, twigs and leaves. The other mineral soil horizons were sorted into living roots and soil. All living roots <2 mm diameter were manually collected, and gently rinsed with deionized water. Roots with dark-coloured tissues and rotten bark were considered dead and were discarded. All composite soils were immediately stored in a refrigerator at 4 °C until analysis. Twig and leaf litter, and fine roots were oven-dried at 70 °C for 3 d, weighed, and finely ground. Our estimation of the amounts of C, N and P in the ecosystem does not include medium woody debris (≥2 cm girth and <15 cm diameter), trees <5 cm dbh, herbs and lianas, which would be a relatively small fraction in the entire ecosystem.
Chemical analysis
Soil pH was determined in a 1:2 fresh soil to deionized water. Inorganic and organic phosphorus (Pi and Po) were sequentially extracted following the method of Tiessen & Moir (Reference TIESSEN, MOIR and Carter1993) with 0.5 M NaHCO3 (adjusted to pH 8.5 with NaOH), 0.1 M NaOH and 1.0 M HCl. About 1.0 g of fresh soils were weighed into a 50-ml polypropylene centrifuge tube for the extraction. We omitted the step using anion-exchange resin to extract the most labile Pi, and started from the bicarbonate (NaHCO3) stage; we assumed that resin Pi is fully a subset of bicarbonate Pi. Bicarbonate-extractable P encompasses both inorganic (CO3-Pi) and organic (CO3-Po) fractions, and is considered as the most labile fraction of P in this study. Hydroxide-extractable P is assumed to represent the iron and aluminium surface-bound inorganic P (OH-Pi) and the partially stabilized organic P in soil organic matter (OH-Po). It is considered less readily available for organisms, but non-occluded. The 1.0 M HCl-extractable P is assumed to be inorganic P bound with calcium in primary minerals such as apatite (Ca-Pi). Extracts of bicarbonate and hydroxide solutions contained both Pi and Po. Pi was determined after precipitating organic matter by acidifying subsample solutions to pH 1.5 with 0.9 M H2SO4. The concentration of Pi was determined colorimetrically on a spectrophotometer at 712 nm by the molybdate-ascorbic acid procedure of Murphy & Riley (Reference MURPHY and RILEY1962). Total P was determined by inductively coupled plasma emission spectrometry (ICPS-7510, Shimadzu, Kyoto). The concentration of Po was determined as the total P minus Pi. Residual P, considered as highly recalcitrant occluded Pi, was calculated as the difference between acid-digestible total P and the sum of all extraction steps in the above.
These chemically defined fractions may not necessarily reflect the in situ bioavailability of soil P, because the concentrations of CO3-extractable and NaOH-extractable P in alkaline solutions can be elevated in mildly acidic extracting solutions which are close to the actual soil pH (Johnson et al. Reference JOHNSON, FRIZANO and VANN2003). Moreover, a fraction of CO3-Po, which we define as labile P, cannot be hydrolyzed by phosphatase enzymes (Turner et al. Reference TURNER, CADE-MENUN and WESTERMANN2003). However, we here assume that bicarbonate-extractable P (and resin Pi) is the most labile fraction, because those P fractions are actually a surrogate of soil P availability in the studies of Crews et al. (Reference CREWS, KITAYAMA, FOWNES, RILEY, HERBERT, MUELLER-DOMBOIS and VITOUSEK1995) and Kitayama & Aiba (Reference KITAYAMA and AIBA2002) who have dealt with acidic soils such as ours.
We determined the concentrations of the total C, N and P in the powdered samples of vegetation (sun-leaves, bark and wood of canopy dominants) and below-ground components (leaf and twig litter, fine roots and soil). The C, N and P concentrations of twig litter were used as the substitute for the values of CWD. The C, N and P concentrations of wood were used as the substitute for the values of coarse roots. Soil subsamples were oven-dried at 105 °C for more than 48 h to determine gravimetric water content. The concentrations of total organic C and total N in samples were determined by the dry combustion method with an N-C analyser (JM1000CN, J-Science Lab, Kyoto). To measure the concentrations of the total P, subsamples of 0.2 g were weighed and digested on a block digester with concentrated H2SO4 and H2O2. Digestion was repeated until the solution became clear. Digests were filtered through Whatman 2 V filter paper and made up to 50 ml with deionized water. The concentration of P in the digests was determined on an inductively coupled plasma emission spectrometry. The amounts of C, N and P in each component on an area basis were calculated by multiplying the mass of each component by its corresponding weight-basis concentration. The amounts of C, N and P, fine-root biomass and standing litter mass in O and A horizons in the entire 2-ha plot were estimated with the mean mass of these components weighted by the total area of subplots for each topographic position.
To estimate Po mineralization in soils, acid phosphatase activity was determined by the p-nitrophenyl phosphate method (Tabatabai & Bremner Reference TABATABAI and BREMNER1969). About 5.0 g of fresh soils were added to 50 ml 50 mM acetate buffer solution (pH 5.0), and briefly shaken by hand. We added 0.5 ml of the mixture to a 1.5-ml Eppendorf tube that contained 0.5 ml of 50 mM pNP-substrate solution or acetate buffer (sample control). Tubes were incubated at 25 °C for 2 h, centrifuged, and then 0.5 ml of the supernatant in each tube was transferred to a bottle containing 0.1 ml of 1.0 M NaOH to terminate the reaction and cause colour change. The solution was brought to a volume of 5 ml using deionized water, and the pNP released was determined spectrophotometrically by measuring the absorbance of the solution at 410 nm.
Statistical analysis
Comparison of mean (± SD) values of the soil properties (bulk density, fine-root density, pH, acid phosphatase activity, concentrations of P fractions and total C, N and P) among horizons was tested by analysis of variance. ANOVA was also used to compare the concentrations of total C, N and P among vegetation components (leaves, bark, wood and fine root). When the ANOVA P value was <0.05, the Tukey–Kramer post hoc test was performed to determine which pairs of means differ significantly.
RESULTS
Biomass
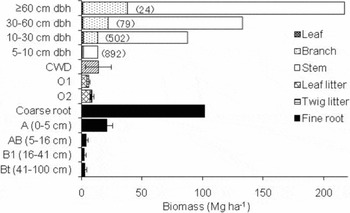
Estimated AGB attained 453 Mg ha−1, with 83% of AGB being accounted for by stem, 16% by branch, and only 1.2% by leaf mass (Figure 1). A small number of canopy trees accounted for a large proportion of AGB; for example, trees ≥60 cm dbh accounted for only 1.6% of the total number of trees (24 trees ha−1), but for 48% of AGB. Fine-root biomass attained 32 Mg ha−1, and 67% of fine-root biomass concentrated in the topsoil (O and A horizons). Estimated coarse-root biomass was about three times larger than fine-root biomass (102 Mg ha−1). CWD mass attained 14 Mg ha−1, and standing litter in O horizons was 15 Mg ha−1 with a relatively large amount of leafy fractions. Accordingly, total biomass (the sum of above- and below-ground biomass, CWD and standing litter) attained 615 Mg ha−1, with 74% of total biomass being accounted for by above-ground vegetation.
Above- and below-ground biomass by component in a tropical rain forest of Deramakot, Sabah, Malaysia. Parentheses indicate tree density (indiv. ha−1) in each dbh class. Error bars indicate SD. CWD, coarse woody debris.

Concentrations and pools of C, N and P
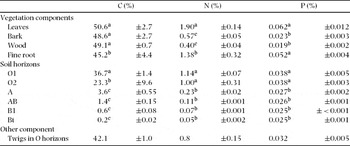
Mean concentration of C in vegetation components (leaves, bark, wood and fine root) varied within a narrow range from 45.2% to 50.6% (Table 1). C concentration was relatively higher in above-ground components (leaves, bark and wood) than in fine roots. In contrast, N and P concentrations were higher in leaves, while intermediate in fine roots, and lower in bark and wood; N concentration ranged from 0.40% to 1.90% and P concentration ranged from 0.019% to 0.062%. Foliar N/P ratio was 31.5 ± 4.4 (n = 7).
Mean (± SD) concentrations of carbon (C), nitrogen (N) and phosphorus (P) of the above-ground vegetation and soils by component in a tropical rain forest of Deramakot, Sabah, Malaysia. Vegetation components and soil horizons sharing the same letters did not differ significantly at P < 0.05.

The C, N and P concentrations in the soil decreased from surface to deep horizon, but the magnitude of decline differed between elements. Soil organic C concentration drastically decreased with depth ranging from 36.7% in O1 to 0.2% in Bt horizons. Soil total N concentration gently decreased with depth (range 1.14% to 0.05%). Soil total P concentration was higher in O horizons (0.038%) than in the mineral soils (A to Bt horizons), but total P concentration in mineral soils was nearly constant regardless of horizon (0.025–0.027%).
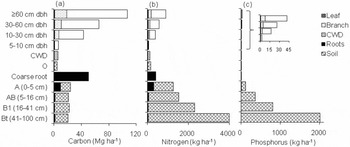
The amount of soil organic C was similar among horizons, but that of total N and P were greater in a deeper horizon (Figure 2). For example, C, N and P pools in the deepest Bt horizon accounted for 22%, 43% and 61% of total pool in soils (except for CWD and coarse roots), respectively. Above-ground P was 89 kg ha−1, with 81% being accounted for by stem, 15% by branch, and 3.8% by leaf mass. Approximately a half of above-ground P (47.7%) was accounted for by trees ≥60 cm dbh. The C, N and P pools in the entire ecosystem (the sum of above- and below-ground system) were 370, 12 and 3.4 Mg ha−1, respectively. Most of C was stored in above-ground vegetation, but that of P was stored in soils, while N showed an intermediate pattern (Figure 2). The C, N and P pools in the above-ground vegetation accounted for 60%, 16% and 2.6% of the total ecosystem pool, respectively.
The amounts of carbon (a), nitrogen (b) and phosphorus (c) of the above-ground vegetation and soils by component in a tropical rain forest of Deramakot, Sabah, Malaysia. CWD, coarse woody debris.

Phosphorus fractionation
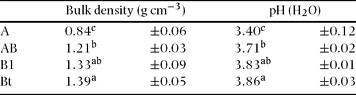
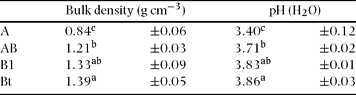
The mineral soils were highly acidic, and soil pH increased with depth (Table 2). Independent of horizon, mean concentration of total phosphorus (T-P) varied within a narrow range of 245–268 μg g−1 (Table 3). These T-P values were closer to the values in some Bornean lowland tropical soils (Burghouts et al. Reference BURGHOUTS, VAN STRAALEN and BRUIJNZEEL1998, Kitayama et al. Reference KITAYAMA, MAJALAP-LEE and AIBA2000, Paoli & Curran Reference PAOLI and CURRAN2007). Most phosphorus was found in the occluded fraction (78–91% of T-P), presumably due to the effects of soil weathering. The proportion of organic P in T-P was 11% (range 7–19%). Only 4% (range 2.8–5.5%) of T-P was found in the most labile bicarbonate fraction, with 71% (range 62–78%) of that being accounted for by organic fraction. Soil Po fractions slightly decreased (Table 3), while organic C and total N dramatically decreased with depth (Table 1), leading to the larger C and N to Po ratios in the surface horizons (A and AB horizons). Labile P was 136 kg ha−1 in soils down to 1 m deep (5.6 kg P ha−1 in the O horizons mostly as organic P and 130 kg P ha−1 in the mineral-soil horizons), being comparable with the amount of live biomass P (125 kg P ha−1 in vegetation and roots).
Mean (± SD) of bulk density and pH (H2O) in a tropical rain forest of Deramakot, Sabah, Malaysia. Soil horizons sharing the same letters did not differ significantly at P < 0.05.
Mean (± SD) concentrations (μgg−1) of soil phosphorus (P) fractions, and ratios of organic carbon to organic P (C/Po) and total nitrogen to organic P (N/Po) by horizon in a tropical rain forest of Deramakot, Sabah, Malaysia. Soil horizons sharing the same letters did not differ significantly at P < 0.05. Bicarbonate-extractable organic and inorganic P, CO3-Po and CO3-Pi; hydroxide-extractable organic and inorganic P, OH-Po and OH-Pi; 1.0 M HCl extractable P, Ca-Pi; residual P, Occl-Pi; total P, T-P.

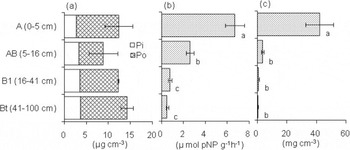
Although the content of labile Po did not decrease with depth, both the activity of acid phosphatase and the density of fine roots were greatest in A horizon, and decreased with depth (Figure 3). Therefore, the activity of acid phosphatase and its substrate (i.e. labile Po) did not match in distribution.
Concentrations (μg cm−3) of soil labile P (bicarbonate-extractable organic and inorganic P (Po and Pi)) (a), acid phosphatase activity (b) and fine-root density (< 2 mm in diameter) (c) by horizon in a tropical rain forest of Deramakot, Sabah, Malaysia. Error bars indicate SD. Soil horizons sharing the same letters did not differ significantly at P < 0.05.

DISCUSSION
Our results clearly suggest that the primary productivity of this forest depends on the acquisition of P from the labile Po fraction in the topsoil because of the extremely high phosphatase activity and the concentration of fine roots in the topsoil. A greater amount of labile Pi and Po fractions exists in the subsoil (summed over AB though Bt horizons). However, there are only a few fine roots in the subsoil, indicating the limited availability of these P fractions by trees in the subsoil. Trees invest N to acquire P by secreting phosphatase enzymes that consist of proteins rather than investing C to extending roots to scavenge Pi in the subsoil. Tropical rain forests on infertile, deep weathered soils are well known to depend on the nutrient recycling in topsoil for their mineral nutrients (Stark & Jordan Reference STARK and JORDAN1978). Such a nutrient acquisition system may occur also in our forest. We suggest that this acquisition system in our study site reflects a high N/P ratio of ecosystem components (i.e. leaves, soil organic matter) but not the absolute shortage of P per se in the subsoil. Foliar N/P ratio in our forest was 31.5 ± 4.4, and this value was closer to the upper limit in forests worldwide (McGroddy et al. Reference McGRODDY, DAUFRESNE and HEDIN2004). A high foliar N/P ratio represents the efficient use of P (relative to N) by trees, mostly due to the low availability of P in soils (Hidaka & Kitayama Reference HIDAKA and KITAYAMA2009, McGroddy et al. Reference McGRODDY, DAUFRESNE and HEDIN2004). Plants invest ample N when P is short if foliar (and soil organic matter) N/P ratios are high (Houlton et al. Reference HOULTON, WANG, VITOUSEK and FIELD2008, Olander & Vitousek Reference OLANDER and VITOUSEK2000, Treseder & Vitousek Reference TRESEDER and VITOUSEK2001). Extending fine roots through subsoil is a costly process in terms of C. Plants need to continuously exploit unoccupied soils and to turn over fine roots because P is quickly depleted in the rhizosphere (the immediate vicinity of roots) and the diffusion of P is extremely slow in soils.
In the topsoil, there may be a consistent, greater supply of labile Po through litterfall and root litter, compared with that in the subsoil where labile P may be very slowly supplied through weathering of bedrock and the scarcity of deep roots. Trees, therefore, rely on such an input of Po and can reduce the turnover of fine roots, while costing N. Despite the greater supply of labile Po in the topsoil, the concentration of labile Po in the topsoil was similar with that in the subsoil. This implies that the input of labile Po to the topsoil is balanced by the equivalent, rapid absorption of labile Pi by the root mats of plants or the immobilization in the topsoil following the rapid mineralization of labile Po, resulting in the low concentration of labile Po in the topsoil. The lack of tapping P from deeper soil horizons may lead to an open cycle of P leading to the loss of P to streams. However, P has an extraordinarily high affinity with clays, and iron/aluminium oxides or can be immobilized by microbes and a conservative P cycling may be realized (Olander & Vitousek Reference OLANDER and VITOUSEK2004).
Overall, only 2.6% of the total ecosystem P was stored in the above-ground vegetation, while most (96.1%) P was in soils predominantly as occluded P. Concentrations of soil total P and occluded P were nearly constant irrespective of soil horizon (Table 3). Such a homogeneous distribution of total P in mineral soils (0.025–0.027%), as well as a rather lower total P concentration in wood component (0.019%) which occupies the most above-ground biomass, resulted in the disproportionately large amount of the soil P pool relative to the biomass P pool. The amount of biomass P (assuming as labile Po) was comparable with that of soil labile P as inorganic and organic fractions combined (125 and 136 kg ha−1 of labile P in biomass and soils, respectively), indicating that vegetation is another important reservoir of labile P. Leaves showed a higher concentration of total P than that in woody organs, but accounted for only 1.2 % of AGB. Instead, a disproportionately small number of large canopy trees retained a half of biomass P. Such localized labile P may be susceptible to human disturbances, such as selective logging, because the selective logging usually aims at harvesting large tree stems, exports approximately a half of felled volume (Bertault & Sist Reference BERTAULT and SIST1997), and thus takes a large amount of organic P away from the ecosystem. Such a P export and the concomitant skidding damage on the topsoil may decrease the labile-P inputs via litterfall, damage the effective P acquisition system in the topsoil (Olander et al. Reference OLANDER, BUSTAMANTE, ASNER, TELLES, PRADO and CAMARGO2005), and eventually limit ecosystem functions (Nussbaum et al. Reference NUSSBAUM, ANDERSON and SPENCER1995). Lawrence et al. (Reference LAWRENCE, D'ODORICO, DIEKMANN, DELONGE, DAS and EATON2007) indicated the likelihood that the reduction in soil P availability by continued harvesting would feed back to further limiting biomass recovery and might induce a shift to sparser vegetation.
Our results indicate the vulnerability of labile P pools to logging, and thus caution against excessive logging because of a possibility of inducing P-limitation in the following regrowth period. Unfortunately, Bornean lowland tropical forests, which are mostly located on the weathered soils, have been experiencing rapid forest degradation (Laurance Reference LAURANCE2007) mostly due to unregulated selective logging. Minimizing the disturbance to topsoil in order to maintain the P acquisition system and to reduce P export are therefore another principal requirement for achieving sustainable forest management.
ACKNOWLEDGEMENTS
This work was supported by the Global Environment Research Fund (F-071) of the Ministry of the Environment, Japan, and in part by JSPS AA Science Platform Program. We thank Y. Nakashima for assisting the establishment of the research plot, M. Poster and D. Joel for tree species identification, R. Wagai, M. Ushio, and A. Hidaka for chemical analyses, S. Kita for helpful comments on the manuscript, R. Ajon and many other persons for assisting field survey, P. Lagan for generous support for every aspect. We acknowledge the kind assistance from Sabah Forestry Department and Forest Research Centre, Sabah.