NOMENCLATURE
- ADS–B
automatic dependent surveillance–broadcast
- AMAN
arrival manager
- ANSP
air navigation service provider
- ATD
actual time of departure
- ATM
air traffic management
- CART
classification and regression trees
- CDM
collaborative decision making
- DDR2
EUROCONTROL Demand Data Repository
- DNN
deep neural network
- ETA
estimated time of arrival
- ETMS
enhanced traffic management system
- FAA
Federal Aviation Administration
- IATA
International Air Transport Association
- ICAO
International Civil Aviation Organization
- ISG
Istanbul Sabiha Gokcen International Airport
- LTBA
Istanbul Atatürk International Airport
- MAE
mean absolute error
- MCNN
multi-cells neural network
- METAR
meteorological aerodrome report
- MOJO
model object optimised
- MSE
mean squared error
- NN
neural networks
- OOB
out-of-bag
- QRF
quantile regression forests
- RF
random forests
- RMSE
root mean squared error
- RNN
recurrent neural network
- SESAR
Single European Sky ATM Research
- STA
scheduled time of arrival
- STD
scheduled time of departure
- TMA
terminal manoeuvring area
1.0 INTRODUCTION
Over the next 20 years, a critical growth in commercial air traffic is expected globally(1,2) . Novel concepts of operations are being implemented in the context of Single European Sky Air Traffic Management (ATM) Research (SESAR) and NextGen to accommodate this growth. However, the capacity and the efficiency of the airspace are defined deterministically, and usually the external operational conditions that affect the actual flight profiles directly are not considered(Reference Ayhan, Costas and Samet3). Flight delays mean extra cost for the airlines because of the increase in fuel consumption, emissions and additional flight hours(Reference Kern, Medeiros and Yoneyama4) leading to passenger dissatisfaction and market loss for airlines. They also have effects on the whole network by impacting the following flights because of misconnections, reduced turnaround times and crew roster changes.
Accurate prediction of Estimated Time of Arrival (ETA) is a key component of delay management by trading accelerated fuel burn against the cost of the delay. It is also very important for Collaborative Decision Making (CDM), where costs are kept under control with improvements in four key ATM areas: safety, capacity, efficiency and environmental impact. Accurate ETA prediction makes it easier for the airlines to co-ordinate the ground operations, reducing the waste of time and energy. Air traffic flow management, airport runway and gate assignment are some of the processes that could be handled much more easily with a better ETA prediction. Accurate ETA prediction will also help to improve the performance of decision support tools used for sequence optimisation such as arrival managers (AMAN) and will provide air traffic controllers valuable situational awareness(Reference Glina, Jordan and Ishutkina5).
Traditional methods for predicting ETA usually rely on aircraft performance models and parametric or physics-based trajectory models(Reference Slattery and Zhao6–Reference Murphy, Clayton, Reisman and Wright8). First the flight trajectory is estimated, including the flight path, altitude and speed profiles, and then the time required to match the trajectory is calculated. However, these models do not take into account the external operational conditions that affect the actual flight profile directly, such as the weather conditions, airspace sector densities or airport congestion. As its name implies, machine learning can learn even very complex functions from experience and real data. Therefore, machine learning methods will consider both the performance of the aircraft and the external operational circumstances that affect the flight. Compared with traditional parametric or physics-based trajectory models, machine learning models are built with fewer or even no assumptions.
In recent years, machine learning methods have been successfully applied to aircraft ETA prediction. Kern et al. introduced a method for improving the aircraft ETA predictions using machine learning methods, considering general information about the flight, weather and air traffic data. The main goal was to improve ETA predictions generated by the Federal Aviation Administration's (FAA) Enhanced Traffic Management System (ETMS), which depends on aircraft performance models and parametric kinematics-based trajectories(Reference Kern, Medeiros and Yoneyama4). The random forests (RF) method(Reference Breiman9) was used to train the model which improved the ETA prediction provided by the ETMS, with a 42.7% Mean Absolute Error (MAE) reduction. Takacs proposed a six-stage model using successive ridge regressions and gradient boosting machines in a data science competition called GE Flight Quest, where the goal was to improve the flight efficiency by improving the estimation accuracy of arrival times(Reference Takacs10). Takacs’ solution placed third in the competition. Glina et al. presented a novel approach for the estimation of landing times using a tree-based ensemble method called Quantile Regression Forests (QRF)(Reference Glina, Jordan and Ishutkina5). The approach was tested for arrivals at Dallas/Fort Worth International Airport with 5-day data, and the ETA of aircrafts closer than 20nm to the airport were predicted with a MAE less than 60s. Ayhan et al. collected a rich feature set by including the weather data along the potential flight path and obtained more accurate ETAs than those of EUROCONTROL using regression models and Recurrent Neural Network (RNN)(Reference Ayhan, Costas and Samet3). Wang et al. introduced a hybrid model for short-term trajectory prediction in Terminal Manoeuvring Area (TMA) by application of machine learning methods(Reference Wang, Liang and Delahaye11). The model included two parts: pre-processing based on clustering and prediction based on Multi-Cells Neural Network (MCNN). The trajectories were clustered into several patterns, and then the MCNN model was used to determine the ETA prediction model per cluster. Using Beijing TMA trajectory data, they demonstrated that the proposed model was very effective and robust, both in trajectory clustering and short-term four-dimensional (4D) trajectory prediction.
In this study, ETA prediction of arrivals to Istanbul Atatürk International Airport (LTBA) is proposed using deep neural networks and RF methods. The proposed approach differs from the previous work in various ways. Flights with holding patterns and deviations from the standard arrival routes are not considered as outliers. Instead of using departure–arrival airport pairs as categorical variables, total flight distances calculated from the trajectories were used to train the model, which allows the same model to be used with different arrival airports having similar runway configurations. The machine learning models were trained in less than 3min using a quad-core computer with a 2.80GHz processor and 6GB memory. The models are able to predict dynamically the ETA for any flight in less than 5s. The prediction errors were decreased 64% after departure and 84% after TMA entrance with respect to scheduled time of arrival. Finally, a web application was developed to predict the ETA of any individual flights to LTBA dynamically using the generated machine learning models.
The proposed method can be used by Air Navigation Service Providers (ANSPs) or airlines for more accurate planning and resource management, which will have a positive impact on four main performance areas of ATM. It will also increase situational awareness of air traffic controllers and help them to sequence the arrival traffic using decision support tools.
The paper is organised as follows. In Section 2, data used for training the machine learning methods are described in detail. In Section 3, RF and deep learning methods are explained. In Section 4, the experimental results of machine learning models built to predict the ETA of aircraft landing at Istanbul Ataturk Airport are provided. Finally, conclusions and future work are presented in Section 5.
2.0 DATA DESCRIPTION
The raw data used for ETA prediction consist of general information about the flight, trajectory points and airport weather reports. The raw data were obtained in different formats (e.g. Automatic Dependent Surveillance-Broadcast (ADS-B), allft+, Meteorological Aerodrome Report (METAR)) from different data sources (e.g. EUROCONTROL Demand Data Repository (DDR2), Iowa State University). Then the data were exported to a relational database which was designed to be able to query and explore the data easily. A Java web application was developed to visualise the data (trajectories, TMA entrances etc.) on the map, which provides further insight into the possible problems and issues related with the data. The features to be used in training the machine learning models were determined depending on the available data, domain knowledge and previous studies. Then, a feature engineering process is employed to remove the missing, inconsistent (e.g. flights with incomplete trajectory points) or duplicate data and to derive new features from available data using data transformations.
2.1 Dataset
The main dataset used in this study consists of arrivals to Istanbul Atatürk International Airport (IST/LTBA) from April 2018 to August 2018. The dataset contains 63,460 commercial flights (both domestic and international), 18,869,049 trajectory points and 6,236 METAR reports for LTBA. Allft+ data for the same period were also obtained from DDR2 and were used to determine the time and co-ordinates of the TMA entrance for each aircraft. Table 1 presents a list of data fields related with the general flight information, flight trajectory and weather around airport.
Data fields

Timestamp transformation

2.2 Feature engineering
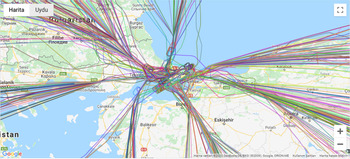
In machine learning projects, it is crucial to convert the raw data into a relational and tidy data format (e.g. a database) to be able to easily explore the relationship among data. Therefore, a relational database was designed to establish the relationship between the data obtained in different formats from different sources. Then, the data were inserted into the database from various data files. A Java web application was developed for data exploration and visualisation purposes. Figure 1 shows the trajectories of arrivals to LTBA for one of the busiest days in the selected period. After a careful data exploration process, flights with missing feature values and duplicate data were removed. Data with inconsistencies (very close TMA and runway arrival times, incomplete trajectories, etc.) were also removed. After data exploration and cleaning, we had 51,902 individual flights in the dataset.
Trajectories of arrivals to LTBA on 22 July 2018.

Timestamp data are not appropriate for training machine learning models. Therefore, the timestamp data such as scheduled and actual departure/arrival times were converted into two numerical features: ‘day of year’ and ‘minutes passed since midnight’. Table 2 presents examples of this transformation. The aircraft types were grouped into three categories corresponding to International Civil Aviation Organization (ICAO) Wake Turbulence Categories: ‘light’, ‘medium’ and ‘heavy’. More than 90% of the flights in the dataset were operated by national airlines. Therefore, airline categories were grouped into five categories: ‘Turkish Airlines’, ‘Atlas Global’, ‘Onur Air’, ‘Pegasus Airlines’ and ‘Other’.
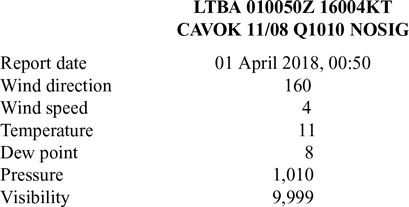
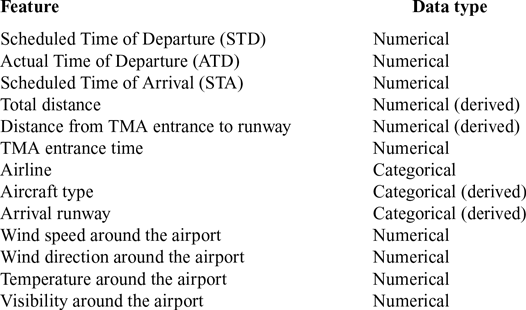
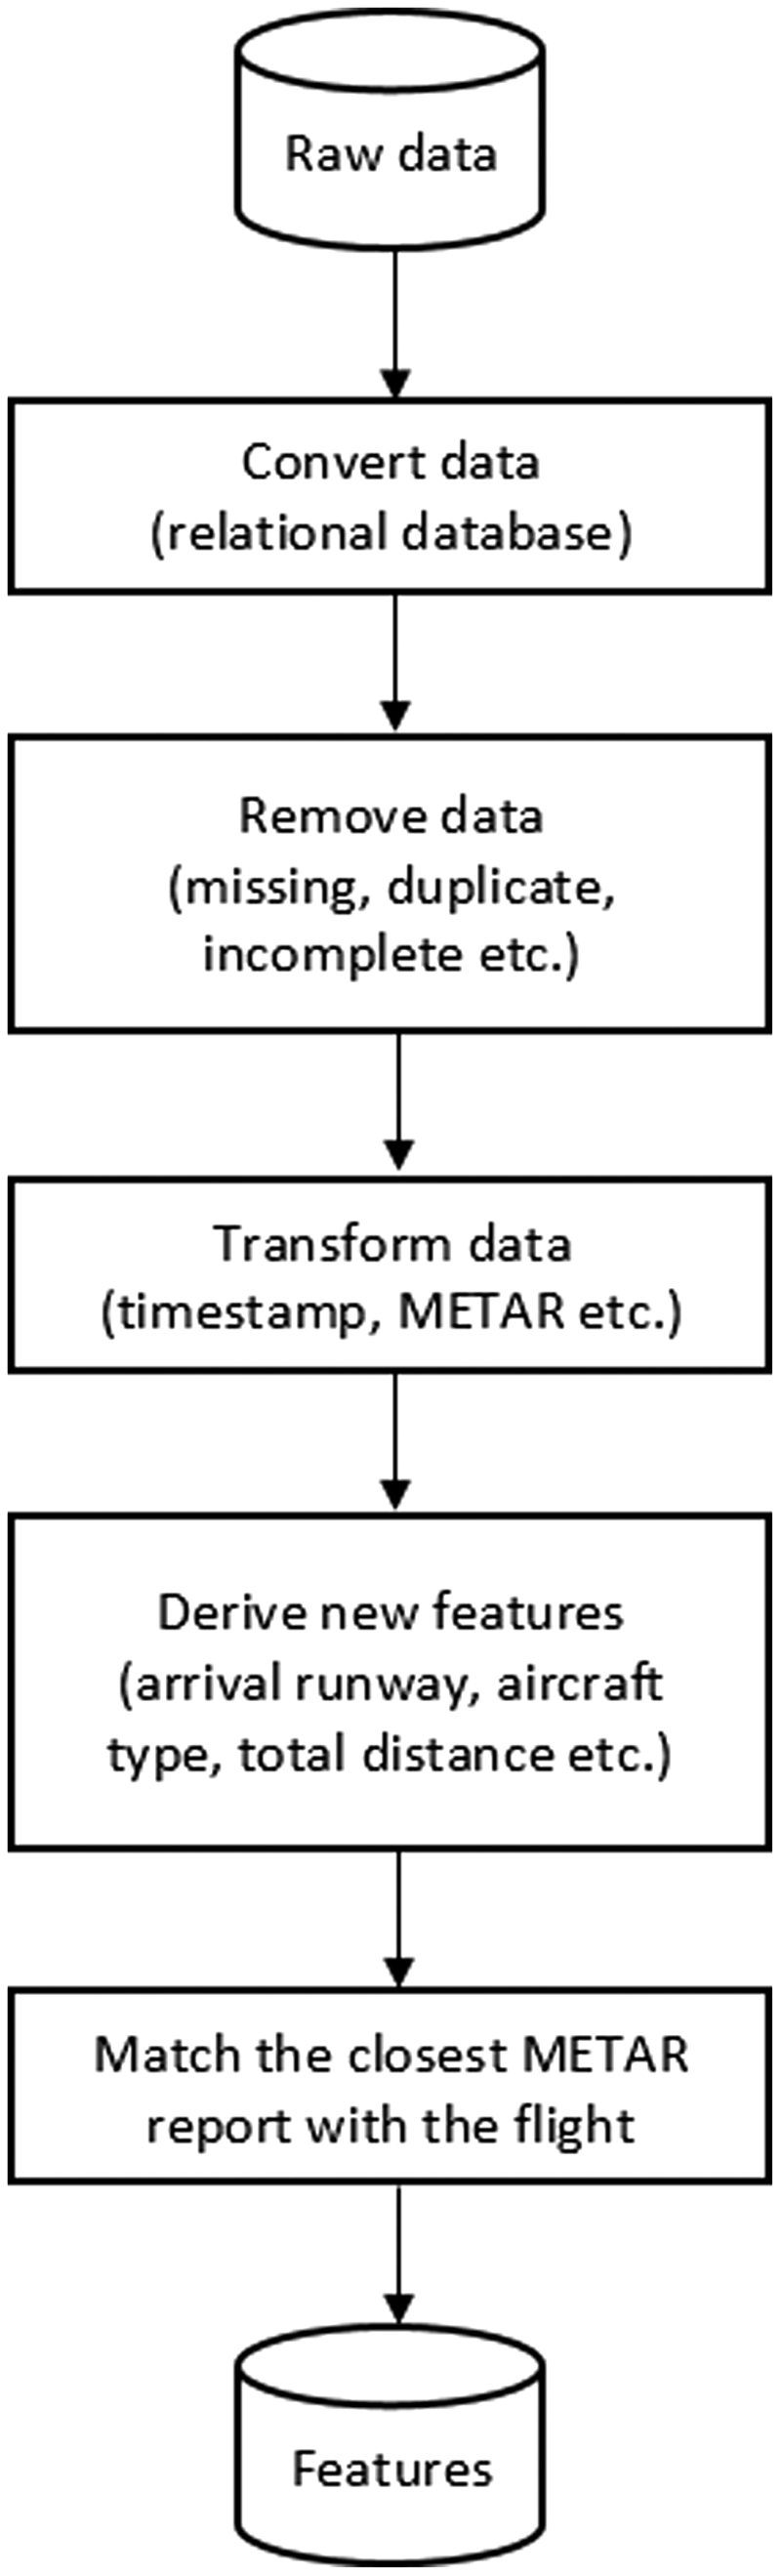
Four additional features were derived from the data: the arrival runway, aircraft type (e.g. ICAO wake turbulence category), total flight distance and the distance from TMA entrance to runway. The arrival runway was determined from the arithmetic average of the headings of final approach trajectory points. The total distance was calculated using the trajectory data. Therefore, the effect of the departure airport was not considered to be the same for all flights departing from the same airport. To calculate the distance from TMA entrance to runway, the co-ordinates of the TMA entrance were determined using allft+ data which contains the airspace entry/exit time and co-ordinates. METAR data were parsed from their original format. METARs closest to the actual arrival times of the corresponding flights were determined and matched with the flight data to reflect the actual weather conditions around the airport at the time of arrival. Table 3 presents an example of METAR conversion, and Table 4 presents the final set of features used for ETA prediction. Figure 2 shows the whole feature engineering process.
METAR conversion example

Features for ETA prediction

Feature engineering process.

3.0 METHODOLOGY
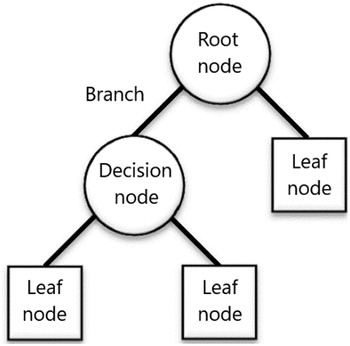
RF and deep neural networks were used for ETA prediction. RF(Reference Breiman9) is an ensemble learning method to build a forest of uncorrelated decision trees using a procedure such as Classification and Regression Trees (CART)(Reference Breiman, Friedman, Stone and Olshen12), with random split selection(Reference Dietterich13) and bagging(Reference Breiman14). A decision tree consists of many decision nodes, beginning at the root node and ending at the leaf nodes (Fig. 3). Nodes are connected to sub-nodes with branches which are the possible outcomes of the decisions given at the parent nodes(Reference Ghatak15). At each decision node  $m$, a test function
 ${f_m}\left( x \right)$ is applied to a given input, and one of the branches is taken depending on the output(Reference Alpaydin16). This process is repeated until a leaf node is hit. The value of the leaf node is the output.
Decision tree.

Each decision node uses only one of the input features ( ${x_j}$) in a univariate tree. If
 ${x_j}$ is discrete with
 $n$ possible values, then the decision node will have
 $n$ splits. The corresponding branch will be selected depending on the value of
 ${x_j}$. If
 ${x_j}$ is numeric, then
 ${f_m}\left( x \right)$ will compare
 ${x_j}$ with a threshold value
 ${w_{{m_0}}}$ and divide the input space into two regions. This is called a binary split.
 \begin{equation}{L_m} = \left\{ {x{|}{x_j} \gt {w_{{m_0}}}} \right\}\end{equation}
 \begin{equation}{R_m} = \left\{ {x{\rm{|}}{x_j} \leq {w_{{m_0}}}} \right\}\end{equation}
Many different decision trees can be constructed for a given training set. Usually, the smallest tree is tried to be found greedily by looking for the best split at each step. In a classification tree, where the output of the decision tree is one of the  $p$ classes, the goodness of a split is determined by an impurity measure. In a two-class problem where
 ${p^1} = p$ and
 ${p^2} = 1 - p$, the impurity of a split can be measured using a non-negative function
 $\phi \left( {p,1 - p} \right)$. Some examples of this function are entropy, Gini index and misclassification error, which are respectively defined as:
 \begin{equation}\phi \left( {p,1 - p} \right) = - p{\log _2}\ p - \left( {1 - p} \right){\log _2}\left( {1 - p} \right)\end{equation}
 \begin{equation}\phi \left( {p,1 - p} \right) = 2p\left( {1 - p} \right)\end{equation}
 \begin{equation}\phi \left( {p,1 - p} \right) = 1 - {\rm{max}}\left( {p,1 - p} \right)\end{equation}
In a regression tree, where the output of the decision tree is a numeric value, the goodness of a split is measured by the mean square error from the estimated value.
RF consists of many decision trees where the output of the forest is determined by majority voting or averaging in classification and regression problems, respectively (Fig. 4). RF can handle both continuous and categorical features, and they can run efficiently on large data sets with many features. Additionally, overfitting is prevented with the randomness and the use of decision trees as an ensemble. Each tree in the RF is grown using random samples of the training data. This is called bagging. The samples that are excluded in the training process are called ‘Out-Of-Bag’ (OOB) samples. They can be used to get unbiased prediction error estimates and produce feature importance estimates(Reference Kern, Medeiros and Yoneyama4). At each node, the split is selected randomly among the K best splits.
Random forests.

The characteristics of RF are as follows(Reference Breiman9):
i. RF is robust to outliers and noise.
-
ii. RF works faster than bagging or boosting.
-
iii. RF provides useful estimates of error, variable importance and correlation.
-
iv. RF is simple and comprehensible.
The term ‘deep learning’ was introduced by Dechter in 1986(Reference Dechter17). It was first mentioned in Neural Networks (NNs) by Aizenberg et al. in 2000(Reference Aizenberg, Aizenberg and Vandewalle18). Deep learning is the state-of-the art method in speech recognition, visual object recognition, object detection, etc. Deep learning models consist of multiple layers which reveal the complex relationships in large data sets and learn the representations of data using the backpropagation algorithm(Reference Lecunn, Bengio and Hinton19).
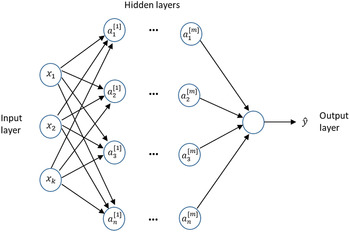
At each layer, deep learning methods transform the current representation into a more abstract representation. Very complex functions can even be learned with such transformations. Figure 5 shows the representation of a deep neural network with  $k$ input features,
 $m$ hidden layers and
 $n$ neurons (nodes) in each hidden layer. Each node in the deep neural network corresponds to a computational unit that takes the weighted sum of node inputs and passes the result to a non-linear activation function to calculate the output of that node (Fig. 6). Nodes that are not in the input or output layer are called hidden nodes. Deep neural networks (DNNs) are the neural networks with multiple hidden layers.
Neural network representation.

Structure of a single neuron.

Here,
 \begin{equation*}x = {\left[ \begin{array}{ccc}x_{{\rm 1}} & x_{{\rm 2}} & \begin{array}{cc}{\rm \dots } & x_k \end{array} \end{array}\right]}^T = \mathrm{feature\ vector},\end{equation*}
 \begin{equation*}w = {\left[ \begin{array}{ccc}w_{{\rm 1}} & w_{{\rm 2}} & \begin{array}{cc}{\rm \dots } & w_k \end{array} \end{array}\right]}^T = \mathrm{weight\ vector},\end{equation*}
 $b$ = bias vector,
 $a$ = activation function
Some of the non-linear activation functions are as follows:
 \begin{equation}{{{f}}}\!\left({{{z}}}\right) = {{\text{max}} \left({0},{{{z}}}\right)\ }{\rm \ (}{{{ReLU}}})\end{equation}
 \begin{equation}{{{f}}}\!\left( {{{z}}} \right) = \frac{{{{{{e}}}^{{{z}}}} - {{{{e}}}^{ - {{{z}}}}}}}{{{{{{e}}}^{{{z}}}} + {{{{e}}}^{ - {{{z}}}}}}}{\rm{\;}}\left( {{{tanh}}} \right)\end{equation}
 \begin{equation}{{{f}}}\!\left( {{{z}}} \right) = \frac{{1}}{{{1} + {{{{e}}}^{ - {{{z}}}}}}}{\rm{\;}}\left( {{{sigmoid}}} \right)\end{equation}
 \begin{equation}f\left( z \right) = z\;\left( {identity} \right)\end{equation}
Equations (10)–(16) define the procedure to calculate the predicted output of the deep neural network shown in Fig. 5 starting with the layer 1 through layer  $\textbf{\textit{m}}$.
 \begin{equation}{{{{z}}}^{\left[ {1} \right]}} = {{{{W}}}^{\left[ {1} \right]}}{{{x}}} + {{{{b}}}^{\left[ {1} \right]}}\end{equation}
 \begin{equation}{{{{a}}}^{\left[ {1} \right]}} = {{{f}}}\!\left( {{{{{z}}}^{\left[ {1} \right]}}} \right)\end{equation}
 \begin{equation}{{{{z}}}^{\left[ {2} \right]}} = {{{{W}}}^{\left[ {2} \right]}}{{{{a}}}^{\left[ {1} \right]}} + {{{{b}}}^{\left[ {2} \right]}}\end{equation}
 \begin{equation}{{{{a}}}^{\left[ {2} \right]}} = {{{f}}}\!\left( {{{{{z}}}^{\left[ {2} \right]}}} \right)\end{equation}
 \begin{equation}{\rm \ }z^{\left[m\right]} = W^{\left[m\right]}a^{{\rm [}m{\rm -1]}} + b^{\left[m\right]}\end{equation}
 \begin{equation}{\rm \ }a^{{\rm [}m{\rm ]}} = f\!\left(z^{{\rm [}m{\rm ]}}\right)\end{equation}
 \begin{equation}\hat{y} = f(a^{[m]})\end{equation}
Here  $\hat{y}$ is the output vector.
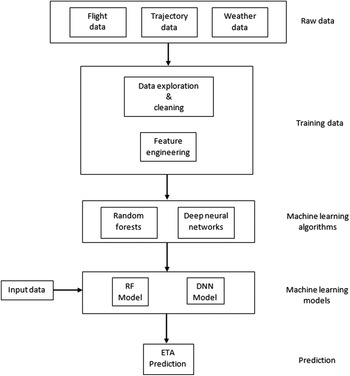
ETA prediction approach.

Simple stochastic gradient descent can be used to train multi-layer architectures. Gradients can be computed using the backpropagation algorithm. The backpropagation algorithm is actually a practical application of the chain rule for derivatives to calculate the parameters of the model ( $W,b$) that minimise the prediction error.
Figure 7 shows the steps of the proposed ETA prediction approach. Raw flight, trajectory and weather data are filtered and formatted by data exploration and cleaning, and then training data were obtained through feature engineering processes. RF and DNN algorithms were used to train and test machine learning models. ReLU activation function given in Equation (6) and identity activation function given in Equation (9) were used in the hidden and output layers of DNN, respectively. These models were then used in an application to predict the ETA using any input data.
MAE, Mean Squared Error (MSE) and Root Mean Squared Error (RMSE) metrics given in Equations (17)–(19) are used to evaluate the performance of ETA prediction models.
 \begin{equation}{\rm MAE} = \frac{{\rm 1}}{n}\sum^n_{i{\rm =1}}{\left|\widehat{y_i}{\rm -}y_i\right|}\end{equation}
 \begin{equation}{\rm MSE} = \frac{{\rm 1}}{n}\sum^n_{i{\rm =1}}{{{\rm (}{\hat{y}}_i{\rm -}y_i{\rm )}}^{{\rm 2}}}\end{equation}
 \begin{equation}{\rm RMSE} = \sqrt{\frac{{\rm 1}}{n}\sum^n_{i{\rm =1}}{{{\rm (}{\hat{y}}_i{\rm -}y_i{\rm )}}^{{\rm 2}}}}\end{equation}
where  $n = $ number of observations,
 ${\hat{y}_i} = i-{\text{th}} $ predicted value and
 ${y_i} = $ the i-th observed value of ETA.
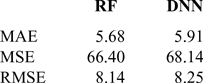
Results for ETA prediction after departure (LTBA)

Results for ETA prediction after TMA entry (LTBA)

Error histograms after departure and after TMA entrance using (A) RF and (B) DNN.

4.0 EXPERIMENTAL RESULTS AND DISCUSSION
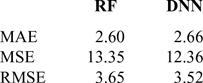
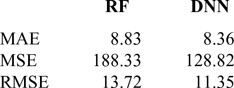
RF and deep neural networks were implemented in R programming language using h2o package, an open source, distributed and scalable machine learning platform(20). As mentioned in Section 2.2, flight information data, trajectory data and METAR data for LTBA were used for training the machine learning models. The data were randomly split into training (80%) and test data (20%). The performances of machine learning models were evaluated using various parameter values. Parameters for RF were chosen as number of split features = 6 and the number of trees = 200. Parameters for deep learning were chosen as number of epochs = 100, number of hidden layers = 2 and number of neurons per hidden layer = 40. A quad-core computer with a 2.80GHz processor and 6GB memory was used for training and running the model. Training took less than 3min. Tables 5 and 6 show the evaluation metrics for ETA prediction using RF and DNN after departure and TMA entry, respectively. ETAs after TMA entrance can be predicted with a MAE less than 3min, while ETAs after departure can be predicted with a MAE less than 6min. Machine learning models decreased the prediction errors 64% after departure and 84% after TMA entrance with respect to scheduled time of arrival. Figure 8 shows the error histograms for ETA prediction using RF and DNN. The bars entitled ‘Scheduled-Actual’ in the error histograms represent the error between the scheduled time of arrival and the actual time of arrival. The horizontal axis represents the error in minutes, while the vertical axis represents the number of flights. The bars entitled ‘Predicted-Actual’ represent the error between the time of arrival predicted by the machine learning models and the actual time of arrival. The error histograms clarify that predictions calculated by the machine learning models concentrate around a narrow vicinity of 0, where ‘0’ means an exact match with the actual time of arrival. It is much clearer in the error histograms for the predictions calculated after TMA entrance, where it can be seen that more than 90% of the errors are between −5min and 5min. On the contrary, the errors between the scheduled and actual time of arrivals spread a very wide range around zero, where the distribution of errors is right-sided, which means that late arrivals are much greater in number than early arrivals.
Machine learning models were also used to predict the ETA after departure for another airport (Istanbul Sabiha Gokcen International Airport – ISG) with similar runway configuration. Table 7 shows the evaluation metrics for ISG. Both models succeeded to predict ETAs with a MAE less than 9min for an airport which was not included in the training process at all.
Results for ETA prediction after departure (ISG)

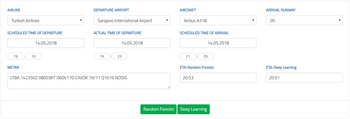
Machine learning models were obtained as ‘h2o MOJO (Model ObJect, Optimized) models’, which are intended to be easily embeddable in any Java environment. Then, the MOJOs were integrated into a Java web application developed for ETA prediction. Both models are able to predict the ETA in less than 5s. Figure 9 shows a screenshot of the ETA prediction for a sample flight where the actual time of arrival for is 20:55 UTC and scheduled time of arrival is 21:05 UTC. Thus, ETAs for any flights can be predicted dynamically by providing the required feature values.
ETA prediction on the application.

5.0 CONCLUSIONS
In this study, machine learning models for ETA prediction were developed using RF and DNN. Both methods succeeded to predict the ETA with a MAE less than 6min immediately after departure and less than 3min immediately after TMA entrance. The prediction errors decreased 64% after departure and 84% after TMA entrance with respect to the scheduled time of arrival. Error histograms for ETA predictions show that most of the error is concentrated around 0, which indicates an exact prediction. The machine learning models were integrated into an application that predicts the ETA, given the feature values. The prediction takes less than 5s in application. The deep neural network model is 40% faster and 90% smaller in size compared with the random forest model.
The machine learning models can be applied to airports with similar runway configurations without any further modifications because they use the flight distances rather than the arrival and departure airport pairs as categorical features. Flight distances can be calculated using a distance measure between departure and arrival airports. Therefore, having the features for a flight that landed with a runway configuration similar to the configuration of Istanbul Atatürk International Airport (such as ISG), ETA can be predicted without modifying the machine learning models.
The departure traffic, airport and airspace congestions will be integrated into the training process in a future work.
ACKNOWLEDGEMENTS
This research received no specific grant from any funding agency in public, commercial or non-profit sectors.