Introduction
What explains why some governments spend more than others? Political science, and in particular the public policy literature, has long sought to answer this question. The enquiry points to the very heart of politics, given the key role of institutions for distributive, competitive and ideological processes such as policy making, elections and rivalling ideas on the role of the state in general (cf. Zubek and Goetz Reference Zubek and Goetz2010). In short, political conflict often revolves around how much should be spent, when, and on what, to paraphrase Lasswell (Reference Lasswell1936). Accordingly, ever since Schmidt’s (Reference Schmidt1993, Reference Schmidt2000) exegesis of rivalling theories explaining public expenditure, we can distinguish between socio-economic, partisan, power resources and cultural-historical determinants, next to institutional approaches along the lines of Tsebelis’ (Reference Tsebelis2000) veto-player theory.
At the same time, and building on this last point about the role of institutions, various forms of vertical power sharing – regionalism, decentralisation, federalism, etc. – are widely believed to affect both the legitimacy and efficiency of policymaking (e.g. Brennan and Buchanan Reference Brennan and Buchanan1980; Rodden Reference Rodden, Eskeland and Litvack2006; Treisman Reference Treisman2007). Decentralisation in particular is argued to lead to lower deficits (Busch Reference Busch1995; Baskaran Reference Baskaran2012), lower public spending on education, healthcare, pensions or general welfare (Vatter and Rüefli Reference Vatter2003; Busemeyer Reference Busemeyer2008), lower unemployment (Crepaz Reference Crepaz1996), more satisfaction due to better tailored service delivery (Oates Reference Oates1972), lower inflation rates and higher economic growth (Castles Reference Castles1999; Lancaster and Hicks Reference Lancaster and Hicks2000). The most famous statement emanating from that literature is probably Brennan and Buchanan’s “Leviathan hypothesis”, according to which “[t]otal government intrusion into the economy should be smaller, ceteris paribus, the greater the extent to which taxes and expenditures are decentralized” (Reference Brennan and Buchanan1980, 216; emphasis omitted). In other words, the “size of the public sector should vary inversely with fiscal decentralization” (Ebel and Yilmaz Reference Ebel and Yilmaz2002, 16; also Rodden Reference Rodden, Eskeland and Litvack2006, 5).
However, “[s]urprisingly little thought has gone into defining and measuring decentralization and federalism in ways that facilitate empirical analysis” (Rodden Reference Rodden, Eskeland and Litvack2006, 24) of exactly that connection. Either such measures are carefully designed – or at least skilfully combined – but only selected public policies are assessed (e.g. Biela et al. Reference Biela, Hennl and Kaiser2013), or output analyses rely on a simplified understanding of vertical state structures (e.g. Schmidt Reference Schmidt1996; Lijphart Reference Lijphart2012; cf. Braun Reference Braun2000a, 2–4) and an operationalisation of fiscal indicators only (e.g. Rodden Reference Rodden2003a). Among the notable exceptions are the studies by Schneider (Reference Schneider2006) and O’Dwyer and Ziblatt (Reference Oates2006), who try to study the impact of different forms of decentralisation on social policies and the quality of government, respectively, as well as Braun (Reference Braun2000b), who compares clusters of countries distinguished by the distribution, extent and sharing of political power.Footnote 1 But even these studies may speak of political power only to then measure its presence, type and distribution using revenue, expenditure, taxes and fiscal transfer data. As we shall argue below, this neglects both institutions as well as politics in a more narrow sense (actors and processes).
Hence, following Rodden’s observation that “normative theories establishing decentralization’s promise seem to assume implicitly not only a wide range of local taxing and spending authority, but also some modicum of political federalism” (Reference Rodden, Eskeland and Litvack2006, 44; emphasis added), this study also includes legal and political indicators that more closely capture what is intended – namely, the extent to which political power is distributed vertically. We will provide a threefold conceptualisation and measurement of decentralisation and then analyse its impact on government size. More particularly, we shall distinguish between an institutional (polity), a functional (policy) and a political dimension (politics) of decentralisation and analyse whether, controlling for a number of other factors, decentralisation and its three dimensions matter for public expenditure. Taking profit of the opportunity afforded by the Swiss federation as a “laboratory” of 26 subnational political systems (Vatter Reference Vatter and Freitag2002; Braun Reference Braun2003), we are able to compare different types and degrees of intracantonal decentralisation to assess their effect on cantonal, local and total (cantonal plus local) spending over 20 years (1990–2009).
We proceed by first discussing the current state of the art in both the public policy and the territorial politics literature. The research design section presents our research design before we explain government size using our own measures of decentralisation and several controls, in the findings section. The discussion and conclusion section discusses our findings in light of the theoretical literature and concludes.
Theory and hypotheses
The extent, even if not necessarily the type, of public expenditure has traditionally been explained from either one of five perspectives: neo-institutionalism; modernisation; path dependency; power resources; and party competition (Schmidt Reference Schmidt1993, Reference Schmidt2000). As this study focusses on the effects of decentralisation, we first discuss theoretical arguments pertaining to that causal mechanism in particular. In doing so we distinguish three different types of decentralisation: functional, political and institutional in a narrow sense. We then briefly discuss rivalling explanations – parties-in-government, hard budget constraints, direct democracy and noninstitutional factors – as currently found in the literature.
The impact of decentralisation
At its most general, the impact of decentralisation (our shorthand for vertical power sharing) on government size is conceptualised as the effect of a specific set of “interpersonal, formal or informal rules and norms” (Schmidt Reference Schmidt1993, 378, Reference Schmidt2000, 28) on political action (cf. March and Olsen Reference March and Olsen1989; Hall and Taylor Reference Hall and Taylor1996; Peters Reference Peters2011). This effect is commonly hypothesised to operate through three causal mechanisms that all relate to different aspects of decentralisation: competition, local autonomy and veto-players.
First, competition among lower-level units in terms of taxation, and service provision is thought to dampen the size of the overall state, as public entities would only raise and provide the absolute minimum of both to attract wealthy residents (Tiebout Reference Tiebout1956, 418; Besley and Case Reference Besley and Case1995; Oates Reference Obinger1999, 1122; Alesina and Spolaore Reference Alesina and Spolaore2003, 137; Treisman Reference Treisman2007, 58). Such is the famous “Leviathan hypothesis” (Brennan and Buchanan Reference Brennan and Buchanan1980, 216), which rests on several assumptions, namely complete information, unhindered or at least not too costly a resident mobility, and individuals’ rational desires of neither wanting to pay for nor demand more than absolutely necessary (cf. Tiebout Reference Tiebout1956, 419).
Given that our subsequent empirical analysis uses the 26 Swiss cantons as a comparative template, confidence in the validity of these assumptions is higher than in a cross-national analysis (see also Monogan Reference Monogan2013; Wasserfallen Reference Wasserfallen2014). The average Swiss canton has 310,000 inhabitants and spans 1,600 km2 [Bundesamt für Statistik (Federal Office for Statistics) (BFS) 2015]; therefore, complete information and mobility are more likely. Also, moving in our case not only means staying in the same country, but also in the same canton, the level where several important powers are exercised (e.g. police, education, health and environment – thus there are no costs in terms of adjusting to new systems by staying within the same canton) as Switzerland is one of the most federal countries in the world (Linder Reference Linder, Zürcher and Bolliger2012; Füglister and Wasserfallen Reference Füglister and Wasserfallen2014). Finally, the existence of fiscal equivalence in terms of a convergence of decisionmakers, taxpayers and service recipients (Schaltegger and Feld Reference Schaltegger and Gorgas2003) further enhances the logic according to which “voting with the feet” (Tiebout Reference Tiebout1956) indeed leads to service provision matching tax yield.
As the Leviathan hypothesis is concerned primarily with overall government size, it only makes sense to test for the effect of this aspect of decentralisation on total public spending, which is both local and central spending combined (cf. Rodden Reference Rodden2003a, 709). Greve (Reference Greve2012, 7) equally underlines how this competitive logic of federalism would serve to “discipline governments” tout court. Hence, a first hypothesis reads as follows:
H1: The more fiscally decentralised a Swiss canton, the lower its total public expenditure.
A second argument why decentralisation would contribute to smaller governments is that much of the overall state activity is “hidden” at lower levels – that is, decided, financed and carried out by subsystem entities at their own discretion. But for decentralisation to lower “central decision costs” (Greve Reference Greve2012, 6; emphasis added), local governments must have sufficient legal autonomy to actually deliver the required public services. This is an aspect that pertains not so much to competition or political influence but rather to “self-rule” (Elazar Reference Elazar1987; Hooghe et al. Reference Hooghe, Marks and Schakel2010).
That distinction between fiscal and legal autonomy (or between policy- and polity-decentralisation, see below) is often overlooked but has been made before. Watts, for example, distinguishes between the “the scope of jurisdiction exercised by each level of government, and the degree of autonomy or freedom from control by other levels of government with which a particular government performs the tasks assigned to it” (Reference Watts2008, 65–66; original emphasis). To determine the latter, he assesses the “formal allocation by the constitution of legislative powers to each level of government” as well as “the extent to which each field of jurisdiction is exclusively assigned to one level of government, concurrent or shared” (Watts Reference Watts2008, 66). Rodden equally cautions that “it is difficult to know what to make of expenditure decentralization data without additional data on the regulatory framework for subnational finance” (Reference Rodden2004, 484), such as what type of taxes can be raised or how much local discretion there is in determining the tax base (cf. Ebel and Yilmaz Reference Ebel and Yilmaz2002, 4–5). Such rules are usually fixed in the constitution, although political practice and/or legal adjudication thereof might change over time (Gibson Reference Gibson2004, 2; Greve Reference Greve2012, 8). The testable assumption arising from this is that, given local autonomy, a central government can afford to do less since lower-level entities will both provide a safeguard for assuring a minimal service provision as well as act as the first entry points for citizen demands. We thus hypothesise that:
H2 a: The more constitutionally decentralised a Swiss canton, the lower its central expenditure.
A corollary from this is that, through increased proximity of decisionmakers to service beneficiaries, also the monitoring and sanctioning abilities of taxpayers are strengthened; thus, not only central but also local governments will spend less – and total government size decreases as in H1. However, as Rodden (Reference Rodden2003a, 701) speculates, it might well be that vested interests operate even better at the local level and/or that citizens are more demanding precisely because of better oversight abilities (cf. Oates Reference Oates1985). In both scenarios, polity-decentralisation would lead to more local spending. Hence:
H2 b: The more constitutionally decentralised a Swiss canton, the higher its local expenditure.
Third, there is the already mentioned political aspect of de- or rather noncentralisation. The argument here is that the existence of noncentral loci of decisionmaking provides for a check on policy change and, through that, functions to curb excessive expenditure (Brennan and Buchanan Reference Brennan and Buchanan1980, 26–28; Obinger Reference O’Dwyer and Ziblatt1998, 46; Good et al. Reference Good, Hurst, Willener and Sager2012, 455). As veto-players (Tsebelis Reference Tsebelis2000), local governments may block attempts by the centre to encroach upon their policy areas by centralising functions otherwise provided by them and/or through the acquisition of new powers (Schmidt Reference Schmidt1998, 223; Braun Reference Braun2000b, 50–51; Vatter and Freitag Reference Vatter2002, 59–60; Freitag and Vatter Reference Freitag and Vatter2008, 275). Schmidt (1996, 177) also provides evidence that “countermajoritarian constraints […] have stopped or reversed the trend towards big government” (cf. also Samuels and Mainwaring Reference Samuels and Mainwaring2004, 86–88). But this means that, to have an effect on policymaking, decentralisation must not only capture expenditure and revenue discretion (the policy dimension) or constitutional autonomy (the polity dimension), but also actual local political influence at higher levels (Braun Reference Braun2000b, 36) – that is, the ability to block or initiate policy change.
Most often this aspect of territorial politics is captured by the notion of “shared rule”, which measures the extent and way in which regions codetermine national decisionmaking (cf. Rodden Reference Rodden, Eskeland and Litvack2006, 38; Hooghe et al. Reference Hooghe, Marks and Schakel2010). However, we prefer the term “political decentralisation” because it better conveys both the nature of central-local relations (political) and the direction of influence (bottom-up) (cf. Riker Reference Riker1964, 10). Thus, subnational governments codetermine central decisionmaking using different channels – for example, through representatives in central political organs, such as elected senators or the appointed delegates of minister-presidents (Rodden Reference Rodden2003b, 165). Alternatively, in the absence of upper chambers, noncentral entities might also resort to bargaining directly with the federal government (Bird and Tassonyi Reference Bird and Tassonyi2003, 94), act through political parties (Riker Reference Riker1964, 137ff.) or both (Samuels and Mainwaring Reference Samuels and Mainwaring2004, 88–90). The point here is that the more powerful these territorial veto-players, the more successfully they can object to enlarging the scope of public activity. Hence, a third hypothesis reads as follows:
H3 a: The more politically decentralised a Swiss canton, the lower its total expenditure.
However, it may also happen that lower-level entities use their influence to shift public costs upwards and/or force the centre to take on new responsibilities, thus increasing the size of the central government. Rodden (Reference Rodden, Eskeland and Litvack2006, 5, 41) argues along similar lines when emphasising central-local bargaining dynamics and possible solutions to vertical coordination problems. Thus, “local governments, working on behalf of resident taxpayers, may shift the production costs of local services onto nonresidents through federally funded transfers” (Inman Reference Inman2003, 36) that increase central spending. This very much resembles the so-called “flypaper effect” (Rodden Reference Rodden, Eskeland and Litvack2006, 78; Freitag and Vatter Reference Freitag and Vatter2008, 276) but in an opposite direction – that is, bottom-up instead of top-down. Specific examples involve the Brazilian governors “forc[ing] the central government to assume their debts”, in the early 1990s (Samuels and Mainwaring Reference Samuels and Mainwaring2004, 106), or the positive effect of legislative overrepresentation on a state’s share in federal funds in Argentina and Mexico (Diaz-Cayeros Reference Diaz-Cayeros2004, 315; Gibson et al. Reference Gibson, Calvo and Falleti2004, 181).
In other words, giving noncentral politicians a direct say over central policymaking will enable them to have the most expensive policies centralised or, in more technical terms, to “externaliz[e] the costs to others, turning public revenue into a ‘common pool’ that is overfished by provincial governments” (Rodden Reference Rodden, Eskeland and Litvack2006, 6; cf. Freitag and Vatter Reference Freitag and Vatter2008). Hence, our final hypothesis on the effect of decentralisation reads as follows:
H3 b: The more politically decentralised a Swiss canton, the higher its central expenditure.
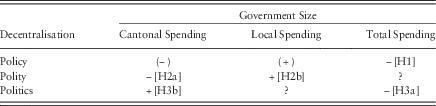
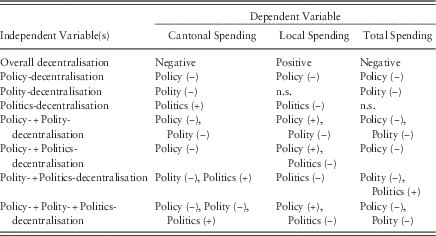
Details on how these three different dimensions of decentralisation are measured are provided in the Operationalisation section, below, and in the Appendix. Table 1 summarises our hypotheses. Note that, in principle, interactions between the three dimensions are very well imaginable too. For example, local governments might need to possess a minimum degree of constitutional self-rule for shared rule to be operating efficiently. However, the point of our three-dimensional measurement strategy is precisely to disentangle the mere availability of resources from the power to decide on their use (self-rule dimension: policy and polity) as well as from political influence at the centre (shared rule dimension: politics). But the point about possible interaction effects will be taken up in the concluding section. We next turn to rivalling explanations.
Expected impact of decentralisation on spending
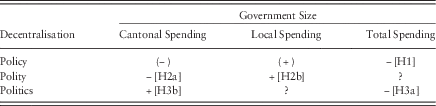
Note: “+”=positive, “−”=negative influence expected; secondary hypotheses in brackets; “?”=no relationship specified ex ante.
Rivalling explanations
There are several rivalling explanations that could explain government size better than decentralisation. The first is direct democracy: as an opportunity structure with relatively low entry costs, it offers a veto instrument of a particular kind – namely, one for societal groups sufficiently well organised to collect the required number of signatures to initiate or block policy change (Wagschal and Obinger Reference Wagschal2000, 469; see also Wagschal Reference Wagschal1997, 226). But as with political decentralisation above, opening up the space of political decisions to the nonelite (i.e. not necessarily elected politicians) and the nonpolitical (moral, economic, etc.) elite could lead in both directions – that is less or more public intervention than would otherwise be the case (Freitag et al. Reference Freitag, Vatter and Müller2003, 355; Linder Reference Linder, Zürcher and Bolliger2012, 287). It all depends on the purpose and strength of these organised interests (cf. Funk and Gathmann Reference Funk and Gathmann2011, 1258). However, because from the point of view of the people’s final decisions no strategic points are to be scored in direct-democratic votes, their vote will tend to be longer term than that of politicians who want to be reelected in a few years (cf. Eichenberger Reference Eichenberger1999). Moreover, direct democracy regularly practised makes for better informed citizens, raising the bar beyond which a majority of them are convinced that policy innovation is needed (Eichenberger Reference Eichenberger1999, 268; Feld and Kirchgässner Reference Feld and Kirchgässner2000; Kirchgässner Reference Kirchgässner2000). Finally, knowing the threat of a direct-democratic veto to exist, governments will become more cautious as regards the extent of change proposed, all the more so as the default option, the status quo, is always better known and thus inherently favoured by a generally risk-averse demos (Samuelson and Zeckhauser Reference Samuelson and Zeckhauser1988; Funk and Gathmann Reference Funk and Gathmann2013).
Another institutional variable is hard budget constraints. These refer to collectively binding rules on the extent of public expenditure growth and the associated risks of a bailout (Rodden et al. Reference Rodden2003, 4) and are thus institutions par excellence (Schmidt Reference Schmidt1993, 379). Such constraints tie further spending to a corresponding surplus in generated revenue, a favourable debt-per-gross domestic product (GDP) ratio (e.g. Maastricht’s Growth and Stability Pact), and/or satisfactory economic performance in general. Switzerland and most of its cantons have chosen yet another way to ensure balanced budgets, using an instrument called “debt break” (Schuldenbremse), whereby the government is authorised to run deficits during recessions and to run surpluses during booms. Over the whole business cycle, however, it has to ensure that the budget is balanced. Thus, starting with a given level of debt, the debt should not have increased after the completion of a full cycle (Müller Reference Müller2004, 2).
The debt break, in other words, represents a specific kind of self-imposed budget constraint (cf. Rodden et al. Reference Rodden2003, 23). The idea to apply this rule to Swiss policymaking dates back to 1919, when Canton St. Gall first introduced it into its legislation (Stalder and Röhrs Reference Stalder and Röhrs2005, 12; Kirchgässner Reference Kirchgässner2010, 8). Over the 1990s and 2000s, several other cantons followed suit (BAK Basel 2012), but variations on the theme exist in terms of both the constraints imposed and the sanctions to be applied in case of rule violation (Stalder and Röhrs Reference Stalder and Röhrs2005, 3; BAK Basel 2012, 20–28). Building on a substantive body of prior evidence relating debt breaks to lower budget deficits (Feld and Kirchgässner Reference Feld and Kirchgässner2000, Reference Feld and Kirchgässner2008; Schaltegger Reference Schaltegger2002; Krogstrup and Wälti Reference Krogstrup and Wälti2008; Chatagny Reference Chatagny2013; Lüchinger and Schaltegger Reference Lüchinger and Schaltegger2013; Yerly Reference Yerly2013; see also Burret and Feld Reference Burret and Feld2014 for an overview), we would expect that stricter debt break rules lead to lower cantonal expenditures.
Finally, we include the share of voters for cantonal government parties into our empirical analysis to account for collusion. According to Lijphart (Reference Lijphart2012), consensual decision-making procedures encourage the magnitude of state intervention as minority interests have to be considered (Vatter and Freitag Reference Vatter2002, 58; Baskaran Reference Baskaran2013). The more inclusive a policy-making process, the more distributive policies are pursued for which the cost bearers are less obvious (Braun Reference Braun2000a, 13; Schniewind et al. Reference Schniewind, Freitag and Vatter2009). Thus, increased government spending might simply be a reflection of a broad governing coalition.
Research design
The research design chosen for this study is a subnational comparison of Switzerland’s 26 regional entities, the cantons, and the relations between cantonal (central) and municipal (local) governments. This kind of analysis, advised amongst others by Lijphart (Reference Lijphart1971, 689ff.), King et al. (Reference King, Keohane and Verba1994, 219) and Snyder (Reference Snyder2001), assumes cantonal-local relations to be functionally equivalent to central-local relations. This has the advantage of strengthening some of the assumptions that have to be made (such as full information and resident mobility; see above) and holding other variables (such as the overall constitutional framework, defence spending or democratic stability) constant. Although the usefulness of this approach for fiscal matters has been proven by, amongst others, Wallis and Oates (Reference Wallis and Oates1988), Schaltegger and Feld (Reference Schaltegger and Gorgas2003) and Freitag and Vatter (Reference Freitag and Vatter2008), we discuss limitations to our research design in the concluding section. We next explain the operationalisation of our variables and then present our method.
Operationalisation
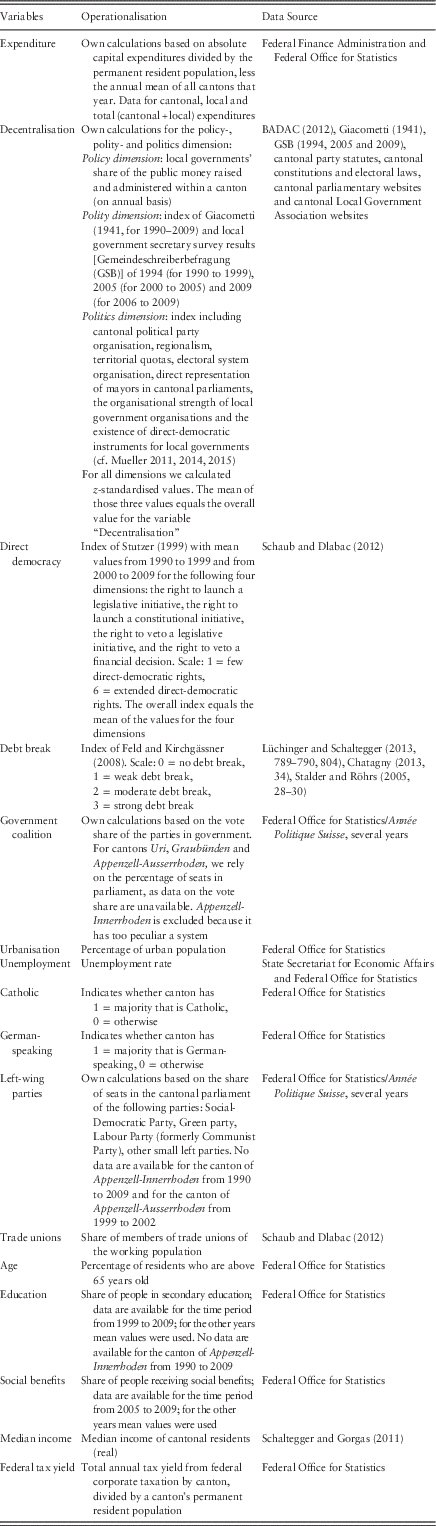
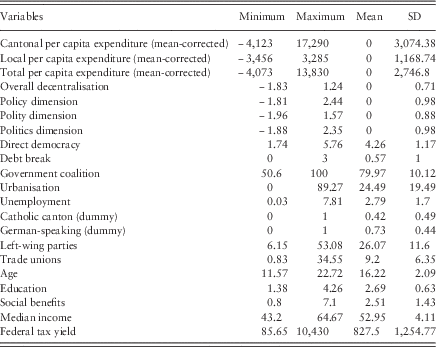
Our dependent variable is cantonal, local and total (cantonal+local) public expenditures, measured on a per capita basis to facilitate comparability. However, per capita spending has increased in all the 26 cantons between 1990 and 2009; thus, instead of estimating absolute levels of annual per capita spending for each canton we subtract the mean of all cantons’ per capita spending for each year. In other words, we estimate the deviation from the mean cantonal per capita public spending to control for time-dependent error terms (cf. Stadelmann-Steffen and Bühlmann Reference Stadelmann-Steffen and Bühlmann2008, 36–37).Footnote 2
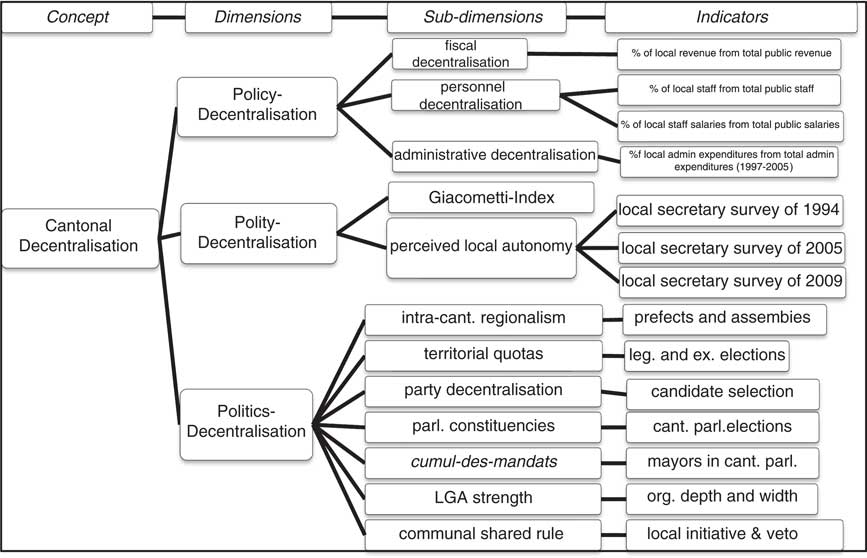
Turning to our key independent variables, policy-decentralisation is measured using fiscal, personnel and administrative decentralisation within every Swiss canton, understood in turn as the extent to which local governments raise and administer public money (cf. Fiechter Reference Fiechter2010; Rühli Reference Rühli2012). However, full centralisation in one area (e.g. tax-raising capacity) can easily be offset by decentralisation in another (e.g. personnel), which is to say that simply averaging their values would not render an accurate picture. In Goertz’s (Reference Goertz2006, 115) terms, therefore, all three components are necessary, and together they are jointly sufficient conditions for a canton to be decentralised in its policy dimension. We therefore multiply general revenue decentralisation with administrative (the share of local from total public expenditures for administration only) and personnel decentralisation (the share of local staff and local staff salaries from their respective total numbers; cf. Treisman Reference Treisman2002, 13; Chhibber and Kollman Reference Chhibber and Kollman2004, 234).Footnote 3
Polity-decentralisation is defined by the extent of freedom guaranteed by cantonal constitutions (Giacometti Reference Giacometti1941) and expert perceptions of the actual realisation thereof (Ladner et al. Reference Ladner, Steiner, Horber-Papazian, Fiechter, Jacot-Descombes and Kaiser2013). This takes into account possible discrepancies between “rules-in-form” and “rules-in-use” (Rothstein Reference Rothstein1996; cf. Rodden Reference Rodden2004, 492). In practice, we average the standardised values of the Giacometti index (cantonal constitutions are either centralised, decentralised or balanced; Giacometti Reference Giacometti1941) and the results of the local government secretary surveys [Gemeindeschreiberbefragung (GSB)] of 1994, 2005 and 2009 (cf. Ladner et al. Reference Ladner, Steiner, Horber-Papazian, Fiechter, Jacot-Descombes and Kaiser2013).Footnote 4 Averaging is possible because the two subdimensions are “substitutable” (Goertz Reference Goertz2006, 108).
Finally, politics-decentralisation captures the degree to which political decisionmaking is decentralised (i.e. local) rather than centralised (i.e. cantonal). There are seven indicators that are assessed here (cf. Mueller Reference Mueller2011, Reference Mueller2014, Reference Mueller2015):
-
1. Cantonal political party organisation measures the local influence over candidate selection for cantonal parliamentary elections, from purely local discretion to cantonal delegate assemblies without any attachment to local politics.
-
2. Regionalism assesses the degree to which regional assemblies and/or prefects exist in a canton – that is, whether there are additional noncentral loci situated between cantonal and local governments.Footnote 5
-
3. Territorial quotas take into account the fact that electoral competition for the cantonal executive and/or the legislative branch might be restricted using fixed quotas, such as those for the Bernese Jura region (guaranteed one out of five government seats).
-
4. Electoral system organisation measures the territorial congruence between local governments and the electoral districts used for cantonal parliamentary elections.
-
5. The direct representation of mayors in cantonal parliaments is assessed using the self-declarations of Members of Cantonal Parliaments.
-
6. The organisational strength of local government organisations captures the existence, cohesiveness and public presence of Local Government Associations (LGAs).
-
7. Finally, the existence of direct-democratic instruments for local governments measures the extent to which local governments qua municipalities can veto a cantonal bill and/or initiate cantonal constitutional change.
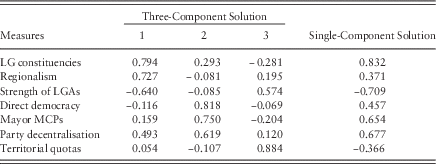
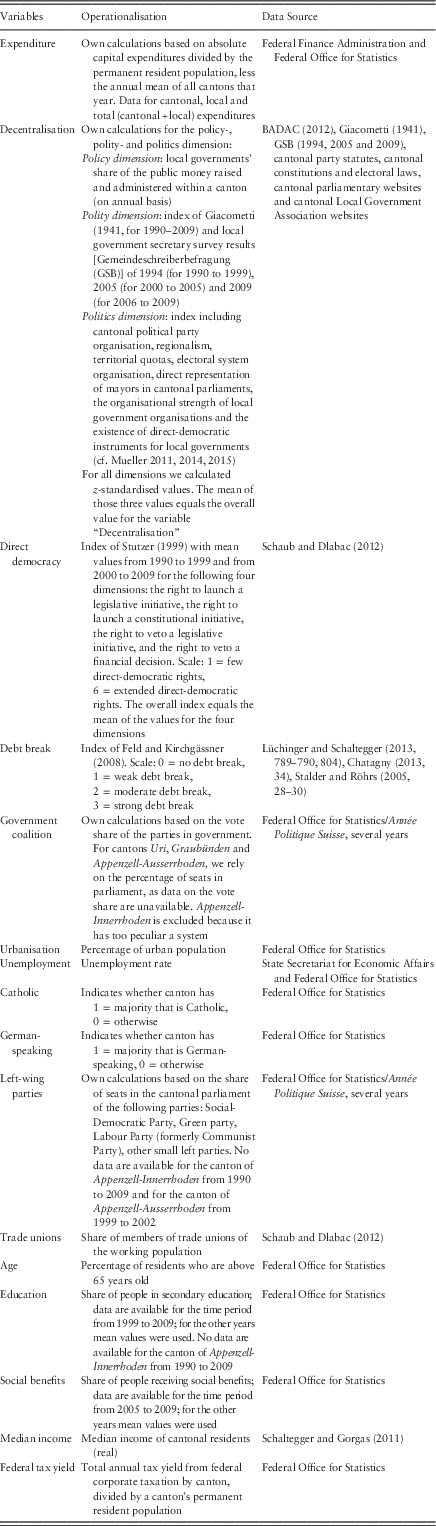
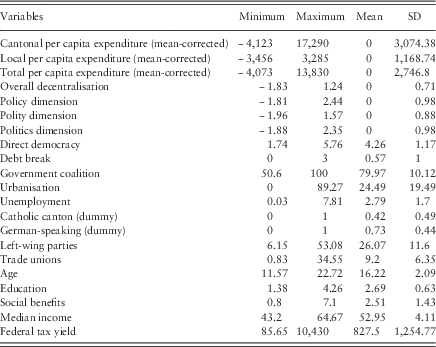
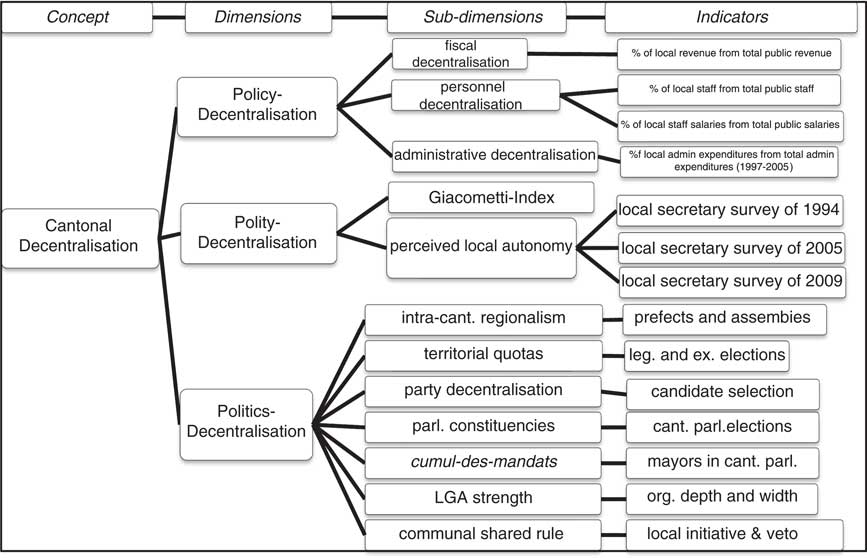
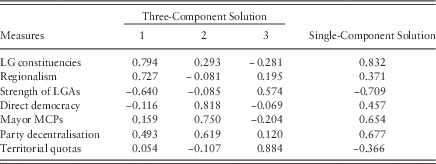
All these indicators have in common the fact that they – at least potentially – bring local interests to bear on central decisionmaking (cf. Tarrow Reference Tarrow1977; Page Reference Page1991; Rodden Reference Rodden2004; Stepan Reference Stepan2004). To arrive at a single measure of politics-decentralisation, we rely on the results of a factor analysis of these seven indicators that searches for a single factor only (see Table A.1, in the Appendix). A reliability test of policy-, polity- and politics-decentralisation thus constructed reveals a sufficiently large commonality; therefore, to arrive at a single measure of overall decentralisation, we have calculated their arithmetic mean.Footnote 6 The conceptual structure of decentralisation so defined is visualised in Figure 1, while summary statistics and an empirical distribution of the mean values across the whole period are presented in the Appendix.
Conceptual structure of cantonal decentralisation. LGA=Local Government Association
To measure direct democracy, we use Stutzer’s (Reference Stutzer1999) index as updated by Schaub and Dlabac (Reference Schaub and Dlabac2012). It is composed of the mean values of four dimensions, each coded from 1 meaning few direct-democratic rights to 6 equalling extended direct-democratic rights. For debt breaks, we rely on Feld and Kirchgässner’s (Reference Feld and Kirchgässner2008) ordinal variable on the strictness of cantonal debt breaks (0 equals no debt break, 3 indicates the strictest debt break). The strictest debt breaks tie expenditure directly to budget planning, foresee no exceptions, and provide for sanctions in case of nonobedience. For each of these elements missing, strictness is downgraded to 2 or 1, while 0 signifies the absence of a debt break altogether. For the years from 1990 to 2005, we use the coding by Lüchinger and Schaltegger (Reference Lüchinger and Schaltegger2013, 789–790, 804) and Stalder and Röhrs (Reference Stalder and Röhrs2005, 28–30), for 2006–2007 that by Chatagny (Reference Chatagny2013, 34), and for 2008–2009 we have calculated the corresponding cantonal values ourselves based on information from the Année Politique Suisse (2009). The resulting measure does not significantly correlate with any other indicator in our dataset. Finally, as an indicator of the size of the governing coalition we use the summed share of voters for parties in a cantonal government (cf. Vatter and Freitag Reference Vatter2002, 63; data source for our purposes: BFS 2015).
As further control variables we shall use various socio-demographic, economic, cultural and structural indicators. To capture modernisation and market failure (Wagner Reference Wagner1958 [1883]; Verner Reference Verner1979), we assess urbanisation and unemployment (cf. Schmidt Reference Schmidt2000, 23; Schaltegger Reference Schaltegger2001, 4; Kellermann Reference Kellermann2007, 48). To measure those aspects of political culture potentially related to more demand for state intervention (Davis and Robinson Reference Davis and Robinson1999; Schmidt Reference Schmidt2000, 30; Loughlin Reference Loughlin2001), we assess the share of Catholics and German-speakers (Kriesi et al. Reference Kriesi, Wernli, Sciarini and Gianni1996; Stadler Reference Stadler1996; von der Weid et al. Reference Von der Weid, Bernhard and Jeanneret2002, 63–65; Zürcher Reference Zürcher2006; Linder et al. Reference Linder2008). To assess party competition and power resources (Schmidt Reference Schmidt1996, Reference Schmidt2000, 25–27), we measure the strength of left-wing parties and trade unions (cf. Hibbs Reference Hibbs1977; Schmidt Reference Schmidt1996; Wagschal Reference Wagschal and Obinger2005, 38), because to (re)distribute across social strata is politically desirable for them and their electorate or members. To assess mobility and demographic structure, we measure the share of residents older than 65 years, the share of pupils in secondary education, the share of social benefit recipients and real median income (cf. Funk and Gathmann Reference Funk and Gathmann2011, 1260). Finally, to control for the impact of changing macroeconomic conditions (Schmidt Reference Schmidt1996, 167), we measure the performance of a canton using total federal corporate tax yield per canton, divided by that canton’s population, for each year of our analysis.Footnote 7
For unemployment and urbanisation, the share of Catholics and French-speakers, the strength of left-wing parties in cantonal parliaments (rather than in cantonal governments, as it is the overall strength of parties and not so much the number of government seats that the theory highlights), socio-demographics and federal tax yield, we rely on data from the BFS (2015). To measure the strength of trade unions, we rely once more on data by Schaub and Dlabac (Reference Schaub and Dlabac2012) (cf. Vatter and Freitag Reference Vatter2002, 63), whereas income data are gathered from federal income tax statistics (Schaltegger and Gorgas Reference Schaltegger and Feld2011). Further details on each variable, its measurement, sources and summary statistics are listed in the Appendix.
Method
To test which of the aforementioned explanations and specifications best match the empirical reality of the Swiss cantons as 26 unit-independent cases, we estimate time-series cross-sectional (TSCS) models as our units are canton-years. We have checked that our time series is stationary using the Augmented Dickey-Fuller Unit Root Test. Models are estimated using the R package “panelAR”. The package estimates linear models on panel data structures in the presence of AR(1)-type autocorrelation that are addressed via a two-step Prais-Winsten feasible generalised least squares procedure, allowing for common correlation coefficients across all panels (Kashin Reference Kashin2014), and panel-corrected standard errors (PCSEs) that are robust to both heteroskedasticity and contemporaneous correlation across panels. Such PCSEs allow for more valid significance estimations. Note that this method of estimating is rather conservative; hence, if significant correlations are obtained, these can be accepted with even more confidence than if another method had been chosen.Footnote 8
Findings
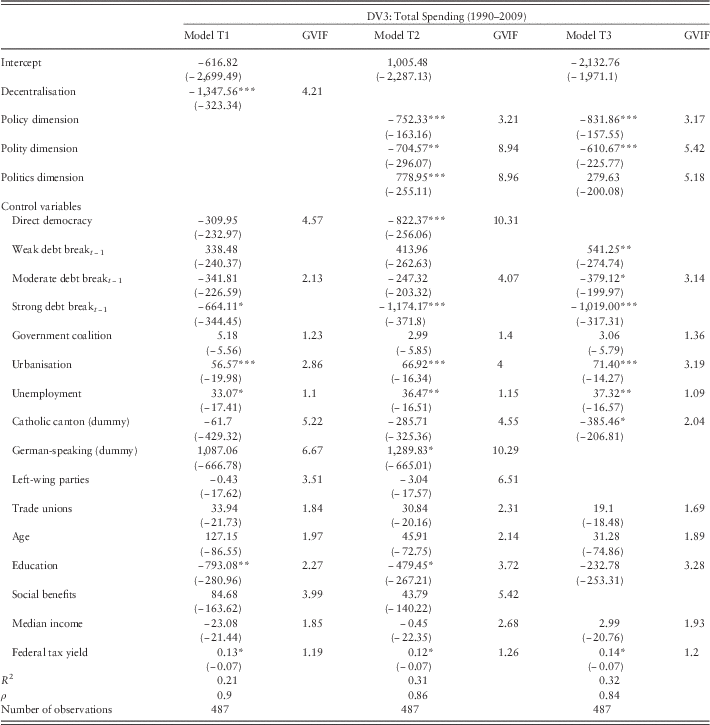
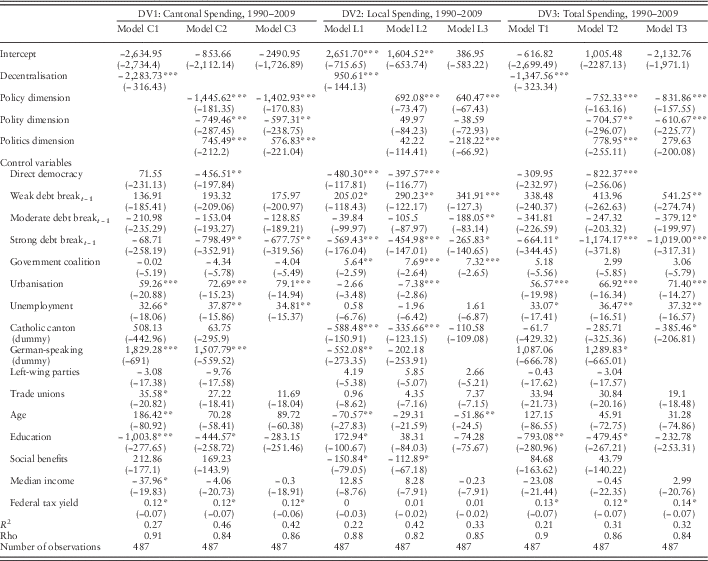
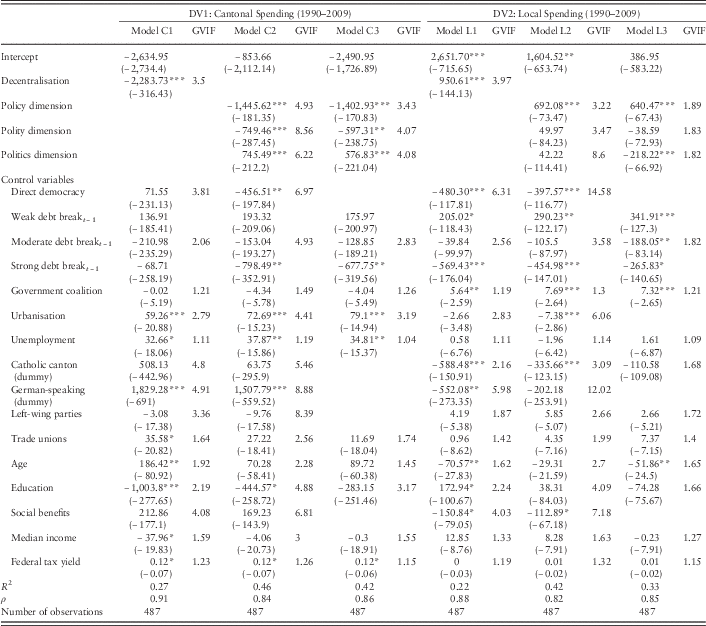
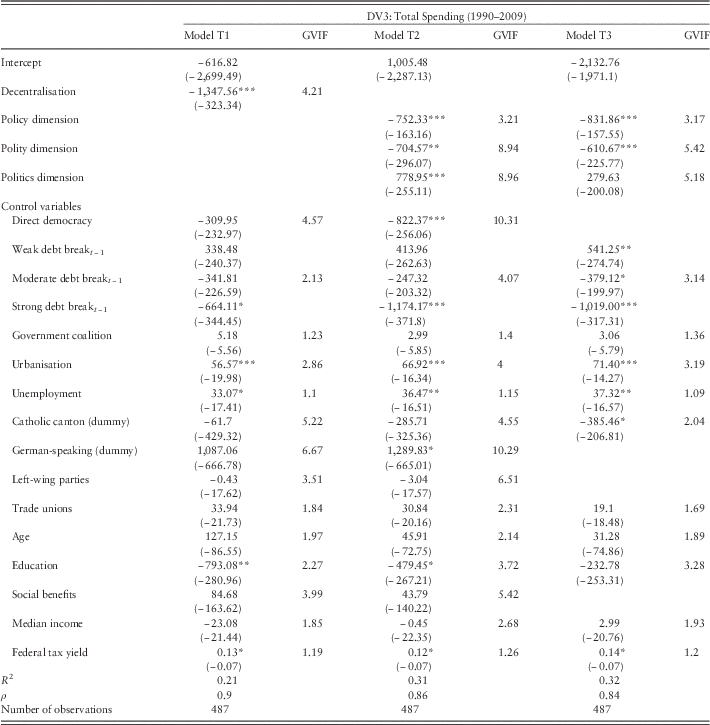
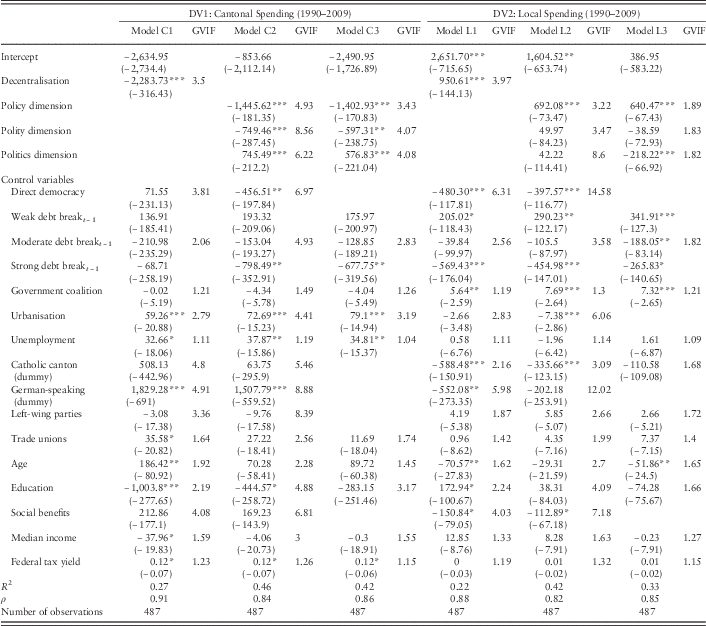
Table 2 displays the results of our nine TSCS models. For each dependent variable, we first include overall decentralisation and all controls (model 1), then the three dimensions of decentralisation and all controls (model 2), and finally, in model 3, the three dimensions of decentralisation plus all control variables with a generalised variance-inflation factor (GVIF) below 5 in any of the first two models.Footnote 9 The different number of cases (487 instead of 520) is due to missing values for some variables (cf. Appendix). Additionally, to avoid “collider bias”, that is collinearity between the independent variables – which is expected, as each forms one dimension of the same overarching concept – Table A.5 provides for a step-by-step inclusion.Footnote 10
Results of time-series cross-sectional models
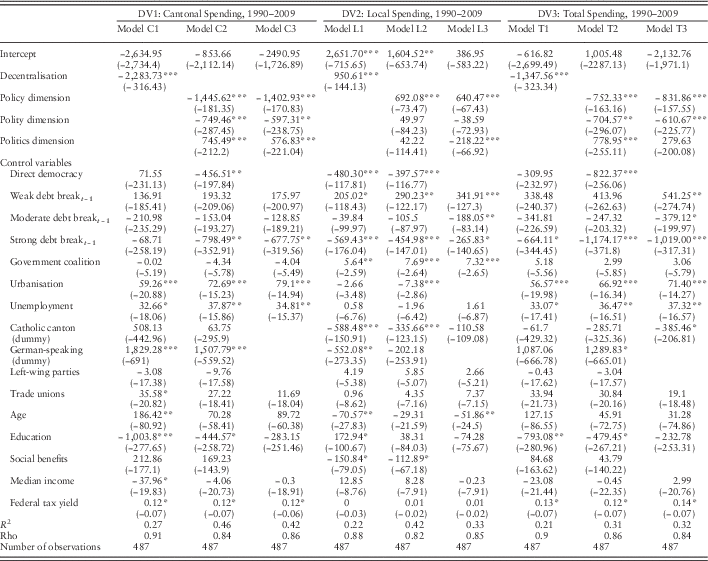
Notes: Nonstandardised regression coefficients, standard errors in brackets. For generalised variance-inflation factor values, see Table A.6.
*p<0.1, **p<0.05, ***p<0.01.
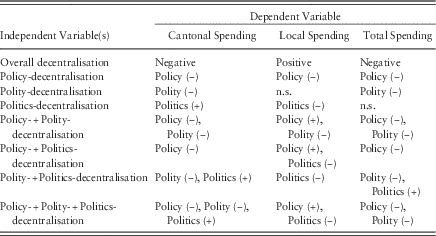
We can see that overall decentralisation (the mean of the standardised values of polity-, policy- and politics-decentralisation) has an effect on all three types of spending. What is more, this effect is strongly significant: the more a cantonal political system is decentralised overall, the lower its total and central per capita expenditure, controlling for several other institutional, socio-economic, cultural and political variables. The effect of overall decentralisation on local expenditure, on the other hand, is significantly positive (see also Table A.5). However, as we turn to decentralisation’s three dimensions, the picture becomes more varied.
For policy-decentralisation, a concept that most closely resembles the standard way decentralisation is measured to test the “Leviathan hypothesis”, the hypothesised negative effect on both total (model T3) and central (model C3) expenditures can indeed be shown to exist. In other words, as the revenue and administrative capacity of local governments increases, central government spending decreases to such an extent that this also leads to an overall decrease in spending. This finding withstands the inclusion of various controls and is robust to both outlier analyses (not shown) and a step-by-step inclusion to account for collinearity between the independent variables (Table A.5). As expected, policy-decentralisation also has a positive effect on local spending (model L3).
That pattern is almost the same for polity-decentralisation, which measures the degree of constitutional and perceived local autonomy. Such a type of decentralisation equally decreases central and total spending, but does not seem to affect local spending: the correlation coefficient in model L3 is negative, yet fails to reach statistical significance (see also Table A.5). In other words, a locally perceived and constitutionally codified ability to deviate from cantonal standards has the expected (H2a) negative effect on central spending – local freedom in this sense breeds both central and overall efficiency.
The most interesting to highlight, however, are the results for politics-decentralisation – that is, the extent to which political processes and actors are organised locally rather than centrally. Here, the effect is positive and significant for cantonal spending. What is more, the effect of politics-decentralisation on local spending is negative – hence, we are quite possibly witnessing a deliberate shift of the most costly policies (health, welfare, education) from the local to the cantonal level.Footnote 11 A look at Table A.5 confirms that in seven out of eight cases, politics-decentralisation has a positive effect on cantonal and a negative effect on local spending (but a significant effect on total spending only in one out of four cases, when included with polity-decentralisation).
What this means is that where mayors are directly represented in cantonal parliaments, where parties select their candidates for cantonal parliamentary elections at the very local level (in matching the constituencies), and where local governments qua local governments can make use of direct-democratic instruments to veto cantonal decisions, there the cantonal level can be brought to spend more rather than less. The interpretation of this finding would argue that this is so because local political actors are strategically interested in shifting costs “upwards”, to the cantonal level, so that their own polities appear to be in better fiscal shape than if they had to spend the money from their own budgets – and raise their own, local taxes correspondingly (Horber-Papazian and Soguel Reference Horber-Papazian and Soguel1996). The result is a sort of state capture from below.
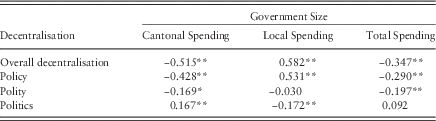
In assessing the relative impact of each of the three dimensions, we can see from Table 3 that in each column overall decentralisation has the biggest effect, that policy-decentralisation clearly tops the other two as regards central and local spending, and that politics-decentralisation is almost as important as policy-decentralisation with regard to cantonal spending – but in the opposite direction, that is leading to more rather than less spending. Of the remaining significant effects, the strongest impact is that by polity-decentralisation on total spending and by politics-decentralisation on local spending, both in a negative direction.
Relative impact of decentralisation on spending
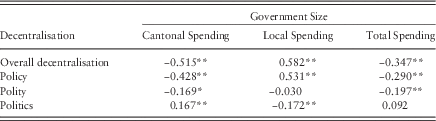
Note: Entries are the standardised β-coefficients from models 1 (for overall decentralisation) and 3 (for its three dimensions) of Table 2.
*p<0.05, **p<0.01.
Turning to our control variables, the debt break has a strong curbing effect on all three types of spending, which is in line with previous findings (e.g. Vatter and Freitag Reference Vatter and Freitag2007, 365). Unemployment, urbanisation and federal corporate tax yield (our measure of economic performance) all have positive and significant effects on both central and total spending.Footnote 12 Whether a canton has a catholic majority also matters for total spending, seemingly disconfirming Catholic-inspired statism (cf. Davis and Robinson Reference Davis and Robinson1999). Local spending, in turn, seems to be positively driven by consensual politics (Vatter Reference Vatter and Rüefli2014) and negatively by the age structure. Finally, all three types of spending are also driven by language, which, however, had to be excluded from model 3 because of collinearity problems. Only inconsistent effects can be discerned as regards education, left-wing parties and the strength of trade unions.
Discussion and conclusion
What explains why some governments spend more than others? This study has centred on decentralisation as a key institutional variable to understand why this is the case. Overall, we have been able to confirm the “Leviathan hypothesis” with new, original data at the Swiss subnational level: where there is overall decentralisation, there is less government, and this despite controlling for a number of other institutionalist as well as socio-economic, cultural and partisan factors. The commonly hypothesised effects of unemployment, urbanisation, income, demographics, political culture and direct democracy have also more or less been found in our data on 20 years of cantonal, local and total public expenditure.
However, that overall picture becomes more complex – and interesting – once we look at different types of decentralisation. The availability and careful combination of fine-grained fiscal, administrative, constitutional, electoral, direct-democratic, parliamentary, party-politics and survey data has enabled us to conceptualise and measure three different types of decentralisation. For each dimension, we hypothesised and found different effects: policy-decentralisation, that is the extent to which revenues and administrative staff are local rather than central, has the clearest negative effect on central and total public spending while boosting local spending. Polity-decentralisation, which pertains to constitutional freedom and local perceptions thereof, also reduces the size of the central and total state sector. However, for politics-decentralisation, which captures the strength of local political influence at the central level, we have shown a positive relation to exist with central expenditures and a negative effect on local spending.
The significance of these findings beyond the Swiss case is that decentralisation does not equal decentralisation. If the availability of tax-raising and administrative power is referred to (policy-decentralisation), a straightforward competition logic was shown to happen. The ensuing “race to the bottom” means that public services are provided at a level deemed optimal by both decisionmakers and consumers alike, as ideally these two overlap. If local autonomy refers to constitutionally guaranteed self-rule (polity-decentralisation), then that link is less straightforward, especially as regards local spending – a possible reason being that the same degree of local autonomy can be used for different purposes depending on dynamics taking place within the local entities. Finally, if by decentralisation we mean political aspects such as the extent to which political actors (parties, mayors) and processes (elections, direct democracy) function locally rather than centrally, more power at the lower level can mean more burdens placed on the higher level. In fact, the lower institutional echelons may try to delegate the provision of expensive and/or new public services to higher levels whilst maintaining all of their decisional capacities (Horber-Papazian and Soguel Reference Horber-Papazian and Soguel1996).
This last phenomenon is what we refer to as state capture from below. Its reasoning draws partly on Greve’s (Reference Greve2012) notion of “cartel federalism” and the observation that, were the component States to draw up the federal constitution and not individual citizens, they would try “not to discipline Leviathan but to empower government” (Greve’s Reference Greve2012, 178). As “revenue maximizers” (Greve’s Reference Greve2012, 189), subnational governments are interested in federal transfers as much as in broadening their own sources of income. Consistent with this is the observation that the Swiss Association of Cities has repeatedly called for a revision to the federal equalisation scheme introduced in 2008 to channel more funds to the urban regions as opposed to the countryside.Footnote 13 What is more, to better lobby for their financial interests at both cantonal and national levels, cities even created a special Conference of Urban Finance Ministers in August 2014.Footnote 14 But local governments also function as a break to further expenditures, as when 19 municipalities in Canton Grisons challenged a reform of the intracantonal equalisation scheme that, as it eventually passed, increased central spending – as well as their own contributions.Footnote 15
For further research into both territorial politics and public finance, this signifies, first, that a more nuanced understanding (and measurement) of decentralisation is worth pursuing, as not all types of decentralisation lead to the same outcome. Overcoming the divide between federalism and decentralisation studies is also necessary if all three dimensions of collective decisionmaking – policy, polity and politics – are to be included: there is nothing, neither at the conceptual nor at the theoretical level, that would justify treating local-cantonal relations as prima facie different from regional-national or local-national relations. Nevertheless, although it is quite plausible to think that well-organised local or regional actors are able to block policy changes that burden them with excessive costs but are quite happy to support policies paid for by the central state alone, this finding would of course have to be verified using more qualitative data, such as structured-focussed comparisons or process tracing, and in other contexts.
A second point of reflection concerns possible interaction effects, which we have alluded to above. In fact, exercising influence at the central level may require a certain minimum degree of self-rule for actors to be taken seriously. In the same vein, local discretion over the level of public service delivery remains symbolic if most of the revenue stems from earmarked transfers. These mutual conditioning effects are somehow controlled for by our subnational research design: all Swiss municipalities can levy at least some taxes autonomously; all have some basic legal protection (Art. 50.1 of the Federal Constitution); and almost everywhere we find local party sections, mayors in cantonal parliaments and LGAs. Nevertheless, future studies ought to theorise and test possible interaction effects more explicitly.
Hence, although Switzerland may be unique in the scope of autonomy accorded to both cantonal and local polities and its extremely noncentralised politics, this study has profited from this fact by comparing the 26 cantons as unit-independent political systems. And despite these limitations, the above cited evidence on Latin America, Canada, the US and Germany is broadly consistent with our conclusions that fiscal decentralisation hampers general government growth while political decentralisation favours increased central spending. We would expect these conclusions to apply to other federal political systems, too. There are, on the one hand, many regions within federal systems that similarly accord their local governments autonomy and influence over public policy. The German Länder, for example, are equally likely to fall prey to capture from below, as are the Swiss cantons. On the other hand, the mentioned “overfishing of the pool” (Rodden Reference Rodden, Eskeland and Litvack2006, 6) might also travel to the national and even European level, as when the Canadian provinces bargain with Ottawa (Simeon Reference Simeon1972) or when regions open embassies in Brussels (Callanan and Tatham Reference Callanan and Tatham2014) to influence “Who Gets What from Whom” (Schneider Reference Schneider2006). It is, however, unlikely that local governments or even regions without any constitutionally protected autonomy and/or a minimum level of fiscal autonomy are able to systematically exercise meaningful influence at higher levels.
A further avenue for future research might also be to distinguish between the effects for spatial, nonspatial, identity and welfare policies (Braun Reference Braun2000b; Wälti and Bullinger Reference Wälti and Bullinger2000), rather than overall spending. Here, one could assume the absence of territorial effects for nonspatial polices, unless coupled with the defence of territorially concentrated minorities, and take into account the ideological orientation and socio-economic attributes of lower-level entities themselves. Also, the effects of politics-decentralisation should be strongest for distributive policies from which all lower entities eventually profit. Here again, a distinction of types of decentralisation might prove useful, for, once given (symbolic?) institutional autonomy, some lower-level entities might be quite happy to renounce fiscal capacity, whereas others might be more pressed for being able to raise money at the expense of constitutional guarantees, and a third group (e.g. cities) might be most inclined towards shifting costs upwards, regardless of both the politics of symbols and own-source income.
To conclude, the wider implication of our study is that the balance between self-rule and shared rule has implications also for the size of the overall political system. Decentralisation, like many social science concepts, contains multiple dimensions. What our study has found is that political influence and local autonomy (both legal and fiscal) may have contradictory effects, with the former boosting but the latter reducing government spending.
Acknowledgements
Research for this article was partly funded through a grant by the Swiss National Science Foundation, No. 10001A_159343. The authors thank the four anonymous reviewers of Journal of Public Policy and its coeditor, Fabrizio Gilardi, for their helpful suggestions to improve previous versions. Remaining errors are the authors’ sole responsibility.
Appendix
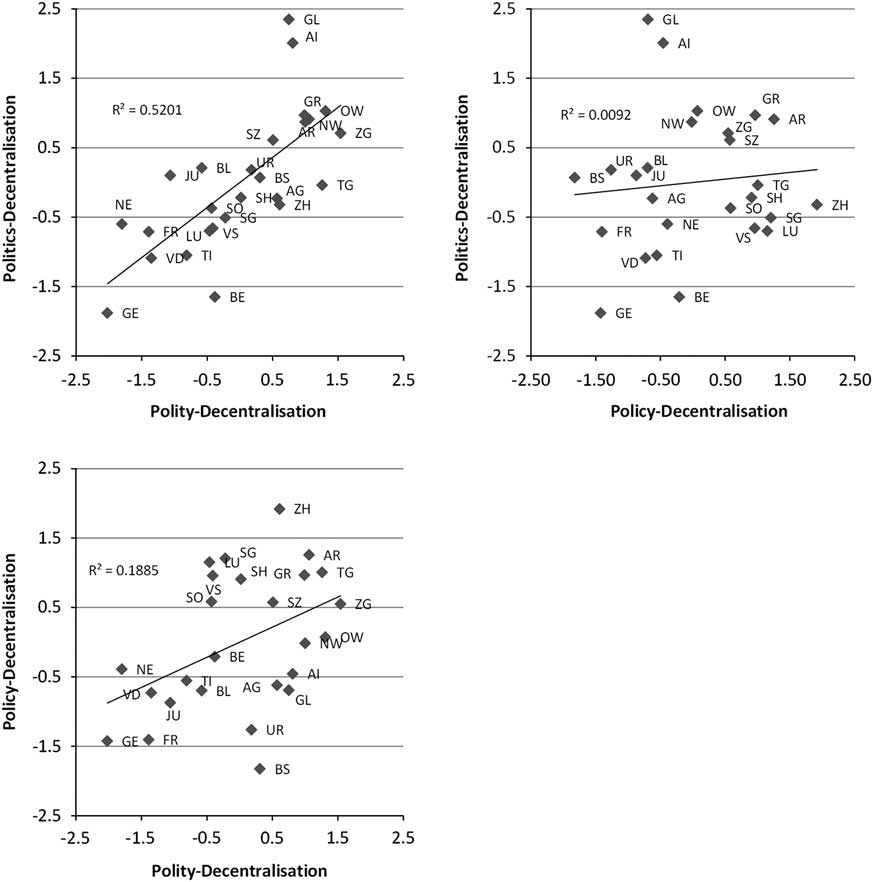
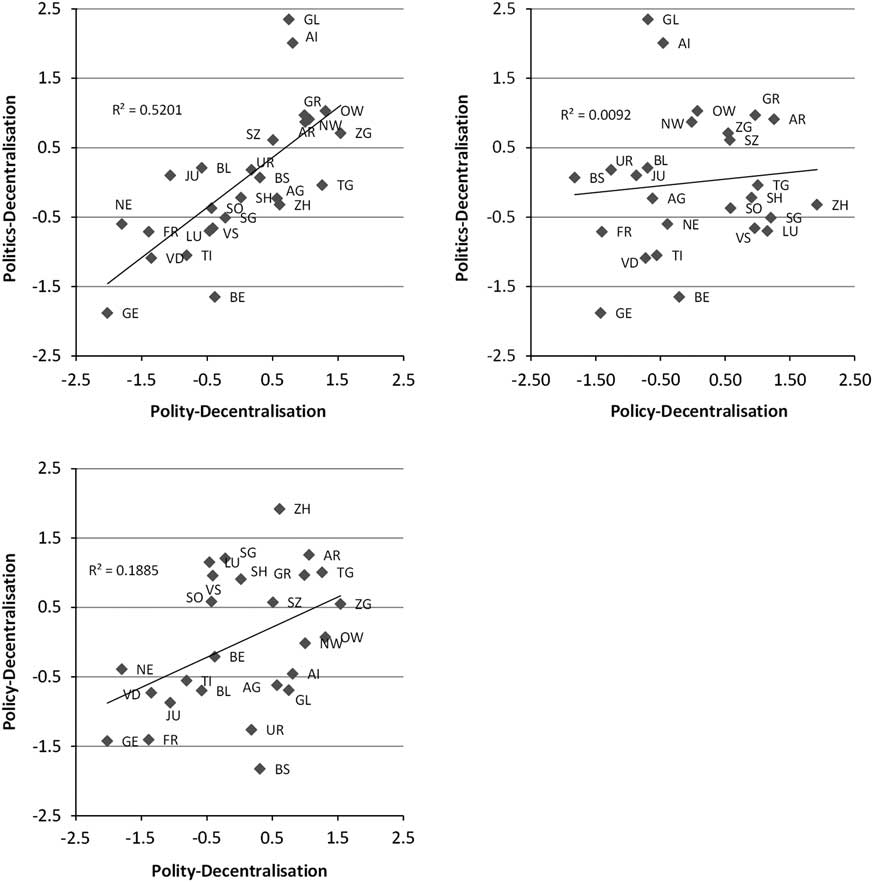
Empirical distribution of cantonal decentralisation dimensions Note: Mean values over the entire period are used for the sake of simplicity.
Two factor analyses for politics-decentralisation
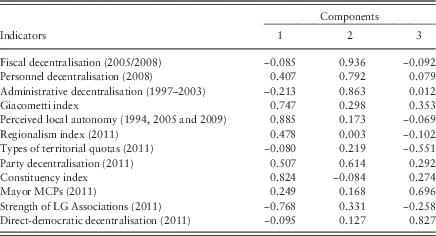
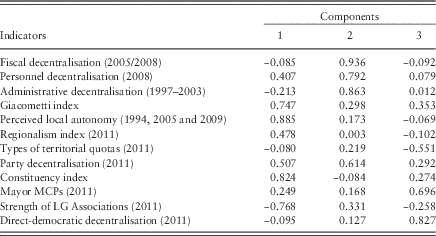
Factor analysis for overall decentralisation
Variable description
Summary statistics
Results of step-by-step time-series cross-sectional models
Results of time-series cross-sectional models including generalised variance-inflation factor (GVIF) values
(Continued)