


Urbanization is among the most critical social changes in human history, involving the creation and experience of novel spatial and social contexts of interaction: towns and cities. While causes and mechanisms of this process can differ greatly, societies must adapt to, among other things, significant changes in spatial organization, reduced social distance, increased diversity, and different subsistence strategies and social structures. Because of the well-preserved and complex urban settlements found in the archaeological record, Mesoamerican cities have been the object of intensive research concerning urbanization, where the co-construction of social complexity and new urban lifeways is of central interest (Carballo Reference Carballo2016; Cowgill Reference Cowgill and Hammond1974; Manzanilla Reference Manzanilla1997; Smith Reference Smith2005, Reference Smith2011; Smith Reference Smith2009). Although datasets vary in their nature and resolution, from detailed architectural information to scant surface collections, from ethnohistoric studies to modern comparisons, they provide materials from which archaeologists make population estimates, conduct settlement pattern studies, and reconstruct dimensions of urban life (e.g., economy, culture, environment). Where ancient urban settings are not obscured by sediment or modern occupation, the integration of LiDAR-derived data (Chase et al. Reference Chase, Reese-Taylor, Fernandez-Diaz and Chase2016; Fisher et al. Reference Fisher, Cohen, Fernandez-Diaz and Leisz2017; Venter et al. Reference Venter, Shields and Cuevas Ordóñez2018) has provided a new and powerful way to construct a comprehensive archaeological approach to the process of urbanization.
The northern region of the modern-day state of Michoacan, Mexico, underwent important transformations in settlement patterns from the beginning of the common era to the time of the European conquest. One of the most critical changes that occurred in this region was the dense and sudden aggregation of populations on top of an unwelcoming volcanic terrain located west of the modern town of Zacapu. Following the relative abandonment of the area during the Early Postclassic (a.d. 900–1250), densely inhabited aggregated settlements were created or extended in different parts of this landscape during the Middle Postclassic period (local phase Milpillas, a.d. 1250–1450). These settlements persisted for approximately two centuries before being systematically abandoned circa a.d. 1450.
During this period, the area of the Zacapu Malpaís constituted one of the most populated sectors of west-central Mexico in prehispanic times and is key to understanding the socio-spatial processes leading to the emergence of the Tarascan state in the Patzcuaro Basin (a.d. 1350–1541), 30 km to the south (Figure 1). At the time of European contact, the Tarascan State controlled most of what is now modern-day Michoacan by means of strong economic and political networks (Cohen Reference Cohen2021; Fisher Reference Fisher, Falconer and Redman2009; Michelet Reference Michelet, Manzanilla and Luján2001; Michelet et al. Reference Michelet, Pereira, Migeon and Manzanilla2005; Pollard Reference Pollard2008, Reference Pollard, Nichols and Pool2012). Contemporary understandings of the region are based on decades of research, especially the large surveys conducted between 1983 and 1996 by the French Centro de Estudios Mexicanos y Centroamericanos. This series of extensive archaeological surveys defined the spatial and chronological frameworks for this region and permitted the identification and initial characterization of the Zacapu Malpaís settlements, including the urban centers of El Palacio (Mich. 23), Malpaís Prieto (Mich. 31), El Infiernillo (Mich. 38), and Las Milpillas (Mich. 95). Based on these settlements and their surrounding sites, an initial population estimate of 15,000 inhabitants was made for this area (Migeon Reference Migeon and Darras1998:41).
Location of the Zacapu Malpaís area in northern Michoacan with extent of the 2015 LiDAR coverage. Based on 2021 Google Earth satellite image. Map by the author.

Since the 1980s, several studies have investigated the possible origins of this population through regional diachronic observation of changes in settlement patterns (Castañeda et al. Reference Castañeda, Darras and Déodat2020; Faugère Reference Faugère2007; Michelet et al. Reference Michelet, Pereira, Migeon and Manzanilla2005; Pereira et al. Reference Pereira, Migeon, Michelet and Manzanilla2005). These studies suggested that the Zacapu Malpaís populations derived from local groups as well as populations migrating from both further north in Michoacan and from south of Guanajuato (see Pereira Reference Pereira2023). The causes of this migration and aggregation remain unclear, although the north-to-south movement of the population might be associated with environmental changes occurring on the northern Mesoamerican border (Armillas Reference Armillas1969; Beekman Reference Beekman2010, Reference Beekman2012; Domínguez and Castro López Reference Domínguez, López and García2017). In contrast to these questions of origin, the present study focuses on the intrinsic characteristics of the settlements that arose in the Zacapu Malpaís and emphasizes three primary questions: (1) What are the characteristics of urbanism at these sites, and are they all similar to each other in terms of the built environment and spatial patterning?; (2) Can we refine the population estimate of the four urban sites and associated peripheral settlements (the urban system) in order to provide a clearer picture of this aggregation phenomenon?; and (3) What is the social structure of these aggregated communities, and what are their levels of complexity and degrees of social integration?
Each of these questions can be approached, to varying degrees, through the production and analysis of detailed site maps. Since 1983, multiple strategies have been used to map the Malpaís sites and obtain a comprehensive record that would facilitate further understanding of the spatial and social processes underlying urbanization in this area. Months of traditional pedestrian mapping, excavations, and subsequent analyses (from 1983 to today) have provided important ground-based data about the Zacapu urban settlements, which have already provided a detailed understanding of the local spatial and social structures. Full coverage of the Zacapu Malpaís settlements was not accessible until recently, and earlier interpretations were based upon samples of the explored landscape. In 2015, airborne laser scanning of the Zacapu Malpaís area produced the “big picture,” thereby enabling the observation of previously undocumented terrain and warranting a reassessment of the interpretations that were initially built on sample areas. The combination of remote-sensing data with information yielded by field-based research offered a unique opportunity to develop a high-resolution reconstruction of the demographic and social urban landscapes of these ancient cities at the time of their greatest extension—the middle Postclassic, Milpillas phase.
After a brief overview of the results from ground-based research upon which the analysis of form and function of urban features was built, we integrate new LiDAR-derived data to discuss two major aspects of the Zacapu Malpaís urban complex and their implications for understanding social change in that region during the Milpillas phase. First, we reassess population estimates for the urban settlements and contemporaneous peri-urban sites, based on revised counts and measurements of residential structures. Second, we investigate the social structure at these sites, based on the variation in size of residences and their spatial relationship with the strategic monumental religious centers located within these settlements.
The Malpaís settlements: view from the ground
Initial surveys and interpretations (1983–1996)
Although mentioned by early works (Caso Reference Caso1929; Freddolino Reference Freddolino1973; Lumholtz Reference Lumholtz and Dávalos1904), the settlements built on top of the Zacapu Malpaís volcanic landform (Reyes-Guzmán et al. Reference Reyes-Guzmán, Siebe, Chevrel, Guilbaud, Salinas and Layer2018) have only been the object of systematic scientific research since the early 1980s, when the French Centro de Estudios Americanos y Centroamericanos (CEMCA) initiated an extensive exploratory program over a 1000 km2 area of northern Michoacan (e.g., Darras Reference Darras1998; Michelet Reference Michelet1992). During the first survey and testing phase in 1983 and 1984, 12 Middle Postclassic sites (a.d. 1250–1450) were detected on the top of the different Malpaís lava flows and nearby areas, including the foothills. Four aggregated and extended settlements, including many monumental pyramids and habitational features, were documented: El Palacio (Mich. 23), Las Milpillas (Mich. 95–96), El Infiernillo (Mich. 38), and Malpaís Prieto (Mich. 31). In addition, several smaller peripheral sites (often lacking monumental religious structures) were recorded in the southeastern (Mich. 313-Achembo, Mich. 314-Pantheon Viejo, Mich. 315-Tacícuaro, Mich. 316-El Zirate, Mich. 322-Capaxtiro, Mich. 325-La Galera) and northern (Mich. 68-El Caracol, Mich. 317-El Malpaísillo, Mich. 319-Cerrito Pelón, Mich. 410-La Centeña, Mich. 417-El Observatorio) areas (see Figure 2). Due to the scarcity of their available residential data, the northeastern-most sites of Mich. 34–70 and Mich. 425, integrated into the urban system by Dorison (Reference Dorison2019), as well as the sites of Mich. 316 and Mich. 325, were not considered in the present study.
Milpillas phase occupation of the Zacapu Malpaís area (dotted area). Map by the author.

The four urban sites are well preserved, due to the combination of their abandonment around a.d. 1450 and the limited natural sedimentation on the abrupt, rocky hilltops that characterize the Malpaís. Inquiry into the settlement pattern and morphology was initiated by the excavation of a residential group at the site of Las Milpillas in 1985 (Michelet et al. Reference Michelet, Ichon and Migeon1988; Migeon Reference Migeon1990; Puaux Reference Puaux1989) and completion of the first partial map of the site (Michelet Reference Michelet1984). In the second phase of work, conducted between 1993 and 1996, an intensive survey was conducted at El Infiernillo and Malpaís Prieto, deploying a 100×100 m unit grid over the sites in order to count and roughly locate residential and monumental features. This mapping strategy led to the construction of density maps for the two settlements (see Michelet Reference Michelet and Darras1998, Reference Michelet, Litvak and Mirambell2000) and provided the first analysis of their internal structure through demonstrating variable architectural density and documenting the distribution of religious monumental mounds at each site (13 for Malpaís Prieto, 23 for El Infiernillo, including the example in Figure 3).
Pyramidal mound AI-28 at El Infiernillo. Photograph by the author.

The three phases of work at the settlements (the initial survey, the intensive excavation work at Barrio B at Las Milpillas, and the extensive survey of El Infiernillo and Malpaís Prieto) produced critical information, including an estimate of the spatial extent of the different sites (ranging from 40 ha for Malpaís Prieto to 140 ha at El Infiernillo) and a preliminary count of habitational features. Subsequent stratigraphic observations and ceramic studies associated with radiocarbon dating supported the interpretation of the general contemporaneity of these settlements and their greatest extent of occupation during the Middle Postclassic, local phase Milpillas (a.d. 1200–1450; Arnauld and Faugère-Kalfon Reference Arnauld, Faugère-Kalfon and Darras1998; Michelet Reference Michelet1992; Migeon Reference Migeon and Darras1998). Although Malpaís Prieto was exclusively occupied during the Milpillas phase, an earlier component was suspected for Las Milpillas and El Infiernillo. In contrast, El Palacio was confirmed to have been founded in the Epiclassic and occupied throughout the Postclassic period, with the Milpillas phase urbanism covering most of the earlier occupation (Forest Reference Forest and Forest2020). The Milpillas phase urbanism across all four sites exhibits substantial homogeneity (Michelet Reference Michelet, Mastache, Cobean, Cook and Hirth2008), with a strict and limited building typology, diagnostic of the Milpillas phase component, present throughout the Malpaís. The material assemblages from these sites have been interpreted as representing an early expression of Tarascan culture (Pereira and Padilla Gutiérrez Reference Pereira and Padilla Gutiérrez2018).
By 1996, the main characteristics of the four urban settlements and cultural traits of the Milpillas phase had been defined. The sites were interpreted as urban units, resulting from a major settlement pattern change and population movement that occurred in the region circa a.d. 1200. This nucleated way of life was unprecedented in the region (see discussion about population estimate below) and was characterized by homogeneously constructed and extended residential areas laid out to house this sizeable population. In addition, the low density of residences in the vicinity of pyramidal mounds was noted and the existence of neighborhoods at Las Milpillas was suggested (Michelet et al. Reference Michelet, Ichon and Migeon1988; Migeon Reference Migeon1990, Reference Migeon2015).
Investigating the socio-spatial structure from the ground (2008–2014)
Surveys and excavations were conducted between 2008 and 2014 by the Uacusecha Archaeological Project (French National Center for Scientific Research [CNRS]/CEMCA) to further investigate the urban structure and social organization of the Zacapu Malpaís urban sites themselves (Pereira and Forest Reference Pereira and Forest2009, Reference Pereira and Forest2010, Reference Pereira and Forest2011; Pereira et al. Reference Pereira, Forest, Michelet and Jadot2012, Reference Pereira, Michelet, Jadot, Manin, Elliott and Forest2013, Reference Pereira, Michelet, Forest, Dorison, Manin and Jadot2014) and to understand the structure of their surrounding sites through systematic survey and testing (Dorison Reference Dorison, Binnberg, Marini and O'Sullivan2017, Reference Dorison2019; Pereira et al. Reference Pereira, Michelet, Jadot, Manin, Elliott and Forest2013). This research design allowed for the collection of data about urban life and its peri-urban and rural dependants, forming a more accurate picture of the economic and social dynamics in the region.
Between 2008 and 2011, four systematic pedestrian surveys, using handheld GPS units, mapped portions of the sites of Malpaís Prieto (93% of site extent), El Infiernillo (6% of the site extent), El Palacio (25% of the site extent), and Las Milpillas (41% of the site extent, including verification of the 1984 map). The mapping method included in situ drawing on graph paper (using the UTM metric system and GPS) and the description of architectural features following the GPS mapping protocols established for this project (see Forest Reference Forest2008, Reference Forest2014; Pereira and Forest Reference Pereira and Forest2009). Between these four sites, a total of 100 ha of urbanized space was mapped, providing high-resolution, field-based data about the spatial organization and architectural components. Analysis of these data included quantitative and qualitative analyses within a GIS framework. Focusing primarily on Malpaís Prieto, due to the extensive survey coverage of this site, these analyses elucidated several aspects of the organization of the urban sites of the Zacapu Malpaís. A brief synthesis of these studies is presented below (detailed information can be found in Forest Reference Forest, Brunet and Sauvin2013, Reference Forest2014, Reference Forest, Roskamp and Albiez-Wieck2016; Forest and Michelet Reference Forest and Michelet2012).
At Malpaís Prieto, a total of 13 pyramidal mounds associated with large community houses, altars, and open, leveled terrace plazas were detected. These complexes were distributed throughout the site. Residential settings are composed of three main types of features: artificial terraces that allow building on top of the chaotic rocks of the Malpaís, room-buildings (mostly sub-square, single-room; see Figure 4) that constitute the individual habitations or domestic additions, and adobe granaries for which only the stone bases remain.
Residential room-building at Malpaís Prieto before excavation. Photograph by the author.

No adequate space for agriculture was detected within the limit of the site (Dorison Reference Dorison2019). The individual residences vary greatly in size, from 2.4 m2 to 140 m2, although the smaller buildings have been interpreted as possible storage features. Extensive excavations of structures from the small (n = 2), medium (n = 4), and large size (n = 1) classes and subsequent analyses of recovered artifacts demonstrated that both the use of space and the material assemblage within the large houses differed from those of the small and medium houses (Forest Reference Forest2014; Pereira and Forest Reference Pereira and Forest2010, Reference Pereira and Forest2011; Pereira et al. Reference Pereira, Michelet, Jadot, Manin, Elliott and Forest2013). An interpretation of these differences as being related to distinctions in status is supported by their spatial patterning. Throughout the site, large individual residences were systematically located in low-density residential areas within the vicinity of the religious areas. In contrast, small and medium-sized houses were densely clustered within well-defined neighborhoods. These observations suggested the existence of status differentiation in the society of Malpaís Prieto based on three different spatial “privileges”: individual residence size, neighborhood residential density, and proximity to the civic-ceremonial precincts. These results were both consistent with and complemented the data obtained during the 1980s in Barrio B at the site of Las Milpillas (Migeon Reference Migeon1990).
Population estimates (1983–2014)
Demographic estimates for the prehispanic occupation of northern Michoacan have been based on site extent and/or ceramic density distribution (Faugère Reference Faugère2007; Fisher et al. Reference Fisher, Pollard, Israde-Alcántara, Garduño-Monroy and Banerjee2003; Pollard Reference Pollard1977; Stawski Reference Stawski2008) or have employed sixteenth-century documents when architectural data are lacking (e.g., Stawski Reference Stawski2012, Reference Stawski, Williams and Maldonado2016). Alternatively, population estimates have been derived based on the number of residential structures and ethnographic comparisons (Kolb Reference Kolb1985). For those Malpaís sites occupied during the Milpillas phase, where architecture is well preserved, this second approach has been systematically applied by Migeon (Migeon Reference Migeon1990, Reference Migeon and Darras1998, Reference Migeon2015) and Michelet (Michelet Reference Michelet, Mastache, Cobean, Cook and Hirth2008). The different population estimates presented by these authors have been based primarily on variations of the following procedure: (1) recording the number of known residential structures; (2) calculating the average density at the inter-site scale; (3) extrapolating this average to sites for which spatial extent was known but structural data were sparse; and (4) multiplying the resulting estimate of the number of houses by the average number of people in a household (for Mesoamerica, Kolb (Reference Kolb1985) has suggested this number to be 5.5).
Through a detailed analysis of the room-buildings of Las Milpillas, El Infiernillo, and Malpaís Prieto, Michelet (Reference Michelet, Mastache, Cobean, Cook and Hirth2008) revised Migeon's (Reference Migeon and Darras1998) earlier estimate of 15,000 people to suggest that the total urban population of the Zacapu Malpaís ranged from 13,500 to 16,500 people. This estimate, however, did not include data from El Palacio or other peri-urban sites. More recently, Dorison (Reference Dorison2019) incorporated new information derived from survey and test excavations along the northern periphery of Malpaís Prieto. He produced a revised population estimate for the northern area of the Zacapu Malpaís of between 18,500 and 22,500 individuals during the Milpillas phase. This estimate, however, was based on all contemporaneous residential structures located within both urban and peri-urban settlements. The associated estimate of the urban population (including Malpaís Prieto, El Infiernillo, and Las Milpillas) ranged between 16,500 and 20,000 individuals.
The Malpaís from the sky: integration of LiDAR data
Data acquisition and desk-based interpretation
In 2015, 91.3 km2 of LiDAR data were acquired and processed by the National Center for Airborne Laser Mapping (NCALM), generating a surface elevation model (DEM and DSM) of the Zacapu Malpaís following NCALM data-processing procedures (Fernandez-Diaz et al. Reference Fernandez-Diaz, Carter, Shrestha and Glennie2014). All interpretation of archaeological and natural features using LiDAR data was based on specialist and non-specialist analysis and manual extraction. Dorison (Reference Dorison2019) demonstrated the possibility of interpreting LiDAR-derived data using multiple visualizations obtained through a series of analyses of the DEM (e.g., multiple hillshades, slope and reclassified slope analyses, positive and negative openness skyview factor, red relief image model, local relief model, and combinations of these DEM treatments). However, most desk-based interpretations were made using the hillshade and slope analysis visualizations due to the training of the analysts involved in manual extraction (see the procedure in Forest et al. Reference Forest, Costa, Combey, Dorison and Pereira2020). Feature extraction involved the systematic digitizing of buildings (as polygonal features) and terrain management features (as linear features) observed on the LiDAR-derived visualizations.
Several scholars have noted the importance of validating desk-based interpretations with field observations when utilizing LiDAR-derived data (e.g., Ainsworth et al. Reference Ainsworth, Stewart, Went, Opitz and Cowley2013; Bofinger and Hesse Reference Bofinger, Hesse and Cowley2011; Chase et al. Reference Chase, Chase, Chase, Masini and Soldovieri2017; Hutson et al. Reference Hutson, Kidder, Lamb, Vallejo-Cáliz and Welch2016; Quintus et al. Reference Quintus, Day and Smith2017). In the case of the Zacapu Malpaís, the characteristics of the terrain (visually distinctive rocky outcrops) are advantageous in that the distinction between pristine landforms and anthropogenic modifications is evident. As a result of this distinction, maximal site extent can be estimated with greater confidence than before. The linearity of anthropogenic features and architecture also contrasts strongly with the shape of natural landforms (see Figure 5), facilitating the identification of most of the architectural types at the sites (consistent and accurate identification of linear features is also discussed in Hesse Reference Hesse2010; Johnson and Ouimet Reference Johnson and Ouimet2014).
Hillshade visualization of the LiDAR-derived DEM (Azimuth 315° and Elevation 15°) before and after interpretation of room-buildings features in the vicinity of pyramidal mound T-23 at El Infiernillo. Images by the author.

Among the most readily detected features are the pyramidal mounds, locally called “yácatas,” and room-buildings. Pyramidal mounds vary from 10 to 40 m in length and 3 to 10 m in height, and typically exhibit the remains of a temple superstructure and central stairs oriented east or west (see Figure 3). Desk-based interpretation and field observations of pyramidal mounds are in complete agreement. Room-buildings are sub-square, single-unit buildings and constitute more than 60% of all architectural features and 97% of the residential features in the Zacapu Malpaís. Representing individual residences, room-buildings form the fundamental units analyzed in the present study. As such, room-buildings extracted from LiDAR-derived data were validated with field observations where possible and adjusted, as necessary.
Estimating house counts
The validity of desk-based interpretations of room-buildings was examined by comparing the desk-detected features with results from both pre-LiDAR pedestrian surveys conducted between 1984 and 2014 and post-LiDAR survey data produced between 2015 and 2017. Both approaches offer a way to compare desk-based interpretations of features against field observations and quantify both true positives (i.e., desk-based extracted features confirmed in the field) and false negatives (i.e., features undetected with LiDAR but observed in the field). Pre-LiDAR survey data, however, do not permit the estimation of false positives (i.e., features detected with LiDAR and not confirmed in the field). As previously discussed by Forest and colleagues (Reference Forest, Costa, Combey, Dorison and Pereira2020), 88.1–89.1% of the room-buildings identified through desk-based interpretation of LiDAR data are true positives. This success is tempered somewhat by the fact that 31.1–34.0% of the structures observed in the field were not detected in the LiDAR visualizations. These false negatives tended to be smaller room-buildings (less than 10 m2) and/or poorly preserved. These results confirm the limitations of LiDAR data noted by other researchers (e.g., Hutson et al. Reference Hutson, Kidder, Lamb, Vallejo-Cáliz and Welch2016). After validation of desk-based interpretations through comparison with field observations, we estimate the total count of room-buildings for the Milpillas phase occupation of the entire Zacapu urban system (both urban and peri-urban sites) to be 4,834 room-building features. Given the high false negative rate inherent in desk-based interpretation, however, this should be considered a minimum estimate.
Estimating house size
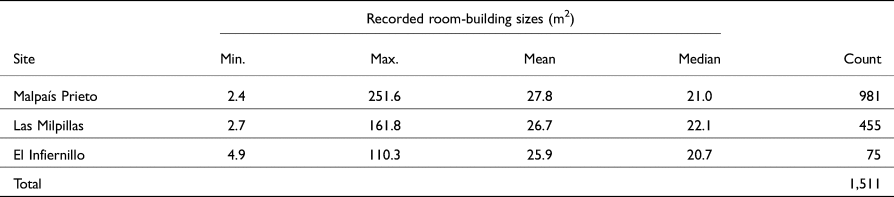
In addition to the number of room-buildings, it is also important to accurately estimate their size, as the latter can be used to make inferences regarding social diversity and integration at the Zacapu Malpaís sites, as well as to create a more nuanced estimate of the Milpillas phase population. The digitization of room-buildings using LiDAR-derived visualizations involves individual decisions when tracing structural outlines and, consequently, distorts estimates of building size. For the 63% of the identified structures for which field observations are unavailable, it would be beneficial to be able to quantify measurement error and adjust where necessary. Drawing on a sample of 1,511 room-buildings (see Table 1) for which both field measurements and LiDAR-derived measurements were available, we assessed whether any systematic bias existed within LiDAR-derived estimates of house size that might affect the utility of such estimates for subsequent analyses. Structures from El Palacio were not included in this sample, since field measurements were used during the desk-based interpretation.
Composition of the study sample.

Following Meindl and colleagues (Reference Meindl, Lovejoy, Mensforth and Walker1985), “bias” is here defined as the mean signed difference between LiDAR-derived estimates of house areas and those calculated from field measurements. A positive bias, then, indicates that the LiDAR-derived areas overestimate house size, where a negative bias indicates that LiDAR data produce underestimates. In contrast, “inaccuracy” is defined as the mean absolute difference between LiDAR-derived estimates and field-based calculations of house size. Due to their respective methods of calculation, the magnitude of an estimate's inaccuracy will typically exceed that of its bias.
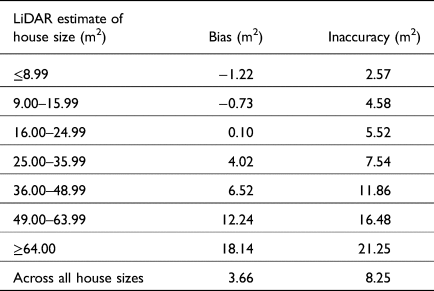
The bias of LiDAR-derived estimates of house area as calculated from the entire sample is 3.66 m2 and the inaccuracy is 8.25 m2. This relatively simple characterization, however, conceals much of the underlying structure in these metrics. Assuming an approximately square footprint for the majority of structures in this sample, we divided the sample into groups based on 1 m increments of wall length (e.g., a wall length of 3–4 m will yield a house area of 9–16 m2) and calculated the bias and inaccuracy for each group. These results are presented in Table 2. For the sites included in this sample, LiDAR-derived estimates of house size that are less than 16 m2 in magnitude tend to be underestimated. In contrast, LiDAR-derived estimates of house size that exceed 25 m2 tend to be overestimated. Further, both bias and inaccuracy generally increase with the size of the LiDAR-derived estimate. This suggests that estimates of population size and inferences of social stratification that are based solely on LiDAR-derived estimates of house size are likely to be distorted. At the same time, however, these results suggest that LiDAR-based measurements can potentially be adjusted in order to decrease their bias.
Bias and inaccuracy by house size.

To explore both the feasibility and the utility of adjusting LiDAR-derived measurements in order to decrease bias, we randomly selected 754 observations from our study sample to serve as a training set, reserving the remaining 757 observations as a testing set to evaluate the efficacy of any adjustments made.
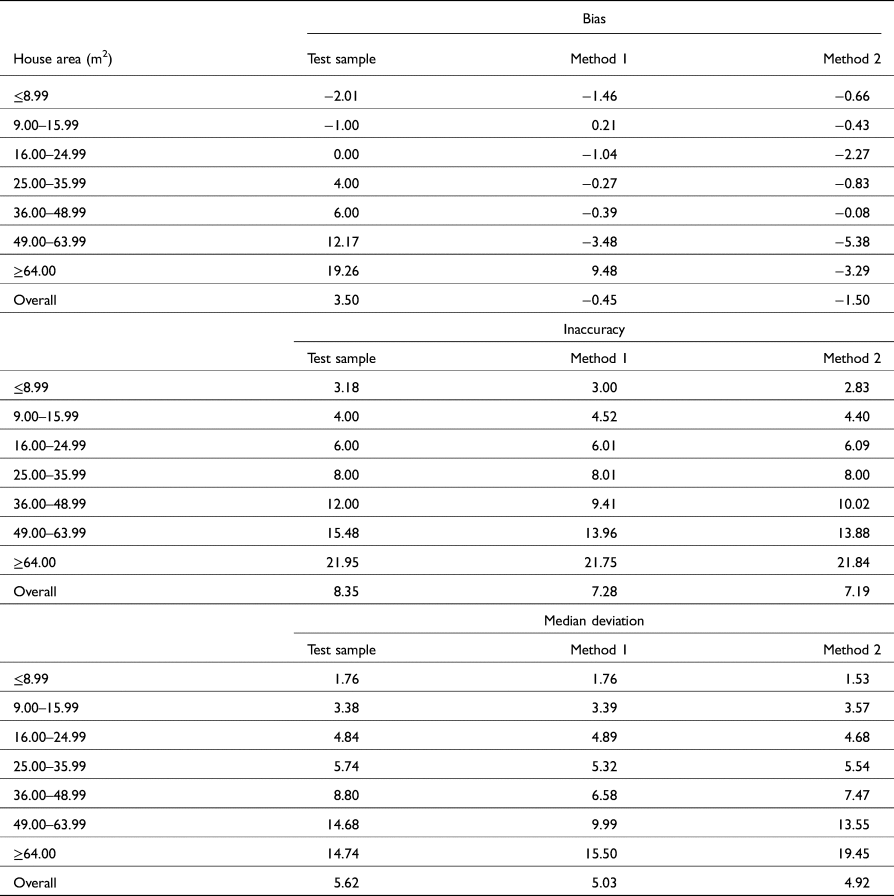
We grouped the training set into categories of identical size as those included in Table 2 and calculated the bias for each group. We then used these values to adjust the LiDAR measurements in the testing set and to evaluate any effects on both bias and inaccuracy. Two different methods of adjustment were used. For Method 1, we simply subtracted the values of the training set's size-specific biases from observed LiDAR measurements in the testing set. For example, if an observation in the testing set had a LiDAR-derived area estimate of 28 m2, then it was adjusted by 4.51 m2—the bias recorded for those buildings whose LiDAR-derived estimates of the area were 25–36 m2 within the training set—to become 23.49 m2. For Method 2, we used polynomial regression to create a model to predict bias from LiDAR-derived size estimates. A significant regression equation was found (F(2,4) = 58.56, p-value = 0.001) with an R2 of 0.967. This equation was then used to predict bias values for each of the LiDAR-derived estimates in the testing set. LiDAR-derived estimates were then adjusted by subtracting the value of their associated predicted bias from them. For both methods, the adjusted LiDAR-derived estimates were then compared to their corresponding field measurements to produce method-specific values for bias and inaccuracy. While the methods of adjustment used here are tailored to this project's dataset, the general procedure described above can be easily adapted and applied wherever comparable data are available.
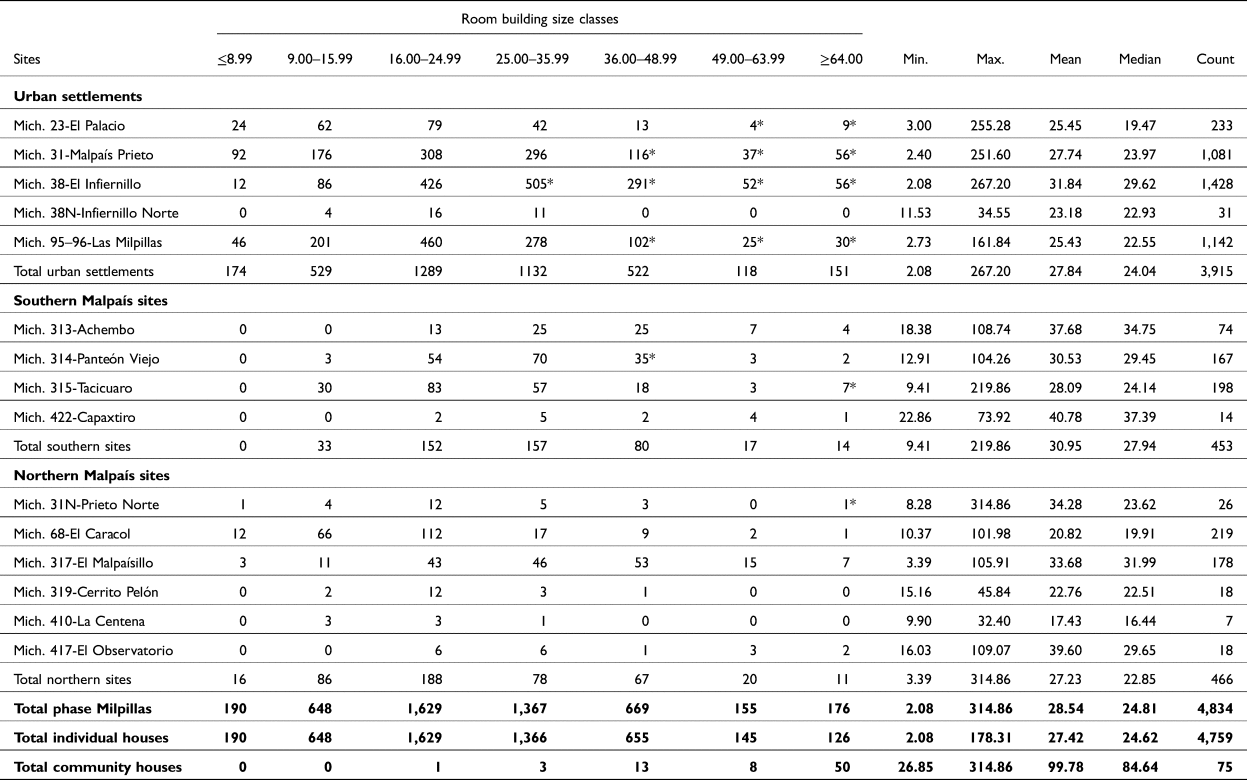
Table 3 presents the results of these two methods of adjustment alongside the unadjusted values of the testing set. Median deviation, or the median absolute value of the difference between LiDAR-derived area estimates and those produced from field measurements, is presented as an additional means of comparison. Both methods of adjustment produce significantly smaller magnitudes of overall bias (Method 1: t(1512) =−4.64, p < 0.000; Method 2: t(1512) =−3.07, p = 0.002) and inaccuracy (Method 1: t(1512) = 1.98, p = 0.048; Method 2: t(1512) = 2.17, p = 0.030), as well as moderately smaller values of median deviation. While the application of Method 2 produces slightly smaller values of overall inaccuracy and median deviation, Method 1 is both simpler to apply and produces a moderately smaller magnitude of overall bias. For this reason, the LiDAR-derived estimates of the house area used in the analyses below have been adjusted using Method 1 (the adjustments correspond to the bias measures presented in Table 2). The adjusted dataset provides detailed sizes for the 4,834 room-buildings recorded, as well as the potential to calculate cumulative residential floor areas (Table 4).
Comparisons of bias, accuracy, and median deviation for the unadjusted test sample as well as for values adjusted using both Method 1 and Method 2.

Counts of room-building (individual houses and community houses) by size class after adjustment with Method 1.

* This size class contains cases of community houses.
Reassessing population and social structure
Population estimates
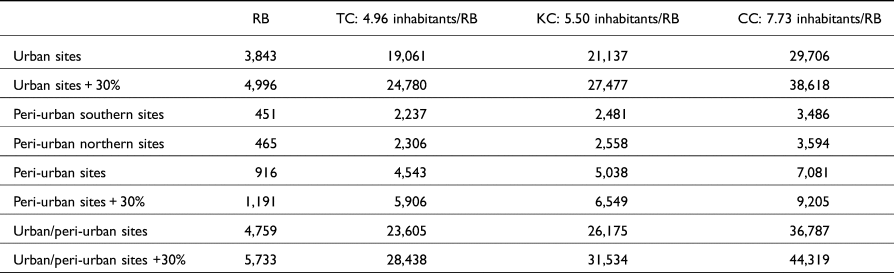
Population estimates for central and west Mexico generally rely on models presented by Kolb (Reference Kolb1985). These models, derived from ethnographic and colonial sources, relate household size to architectural features. Of particular relevance are the results of ethnographic studies conducted during the 1940s in two different Michoacan villages. In the village of Tzintzuntzan, located 22 km southwest of Zacapu, the average number of people in a nuclear family is 4.96 and approximately 6.55 m2 of floor space is available per person (Foster Reference Foster1967; Foster and Ospina Reference Foster and Ospina1948). In the village of Cheran, located 30 km southeast of Zacapu, these values are 7.73 people per household and 5.11 m2 of floor space available per person (Beals et al. Reference Beals, Carrasco and McCorkle1944). Kolb (Reference Kolb1985) combined these indices to provide an estimate of average family size of 5.5 persons with 6.12 m2 of available floor space per person. In combination with the residential room-building data, each of these indices (Tzintzuntzan Constant, TC = 4.96; Cheran Constant, CC = 7.73; and Kolb Constant, KC = 5.50) can be used to generate revised population estimates for the Zacapu Malpaís urban and peri-urban communities during the Milpillas phase.
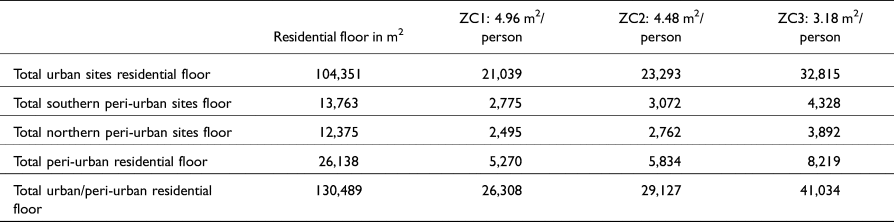
The median size of the residential room-building in the Malpaís urban system is 24.62 m2. Dividing this area by TC yields an estimate of 4.96 m2 of available floor space per person (we refer to this value as ZC1). Similarly, KC yields 4.48 m2 per person (ZC2) and CC yields 3.18 m2 per person (ZC3). Although slightly smaller than the average area per person suggested by Kolb (Reference Kolb1985), these values are tailored to the Zacapu Malpaís archaeological context, where the median size of individual dwellings is smaller than most of the ethnographic cases. From these various indices, we can estimate population using two different methods. The first multiplies household size by the number of room-buildings that are interpreted to be residences (Table 5). This method emphasizes socio-spatial diversity in that it assumes inequality in the amount of domestic space available per person both within the community and between urban and peri-urban communities.
Population estimates for the Zacapu Malpaís urban and peri-urban sites based on the number of inhabitants per residential room-building (RB). The potential 30% of non-desk-based detected features have been taken into consideration. CC, Cheran Constant; KC, Kolb Constant; TC, Tzintzuntzan Constant.

Estimated this way, the population of the entire Zacapu Malpaís urban and peri-urban system during the Milpillas phase ranges between 23,600 and 36,800 people. The urban population would have ranged between 19,000 and 29,700 people, while the peri-urban population would have ranged between 4,500 and 7,000 persons. However, when considering the false negative rate of desk-based interpretation, it is possible that these numbers underestimate the local population of the Milpillas phase by as much as 30%. Adjusting for this under-enumeration suggests that the total population may have included as many as 44,300 inhabitants. However, this should be considered a maximal estimate.
The second method is based on the available floor area per person (Table 6). Although calculated using external household composition constants (TC, KC, and CC), this scenario minimizes status distinctions by assuming that floor space per individual was constant, regardless of house size. Based on this method of calculation, the population of the whole urban/peri-urban system for the Milpillas phase would have ranged between 26,300 and 41,800 persons, including 20,800 to 32,400 urban inhabitants and a peri-urban population of between 5,200 and 8,400 individuals. Although the desk-based detection of room-buildings might represent an underestimate of total residential floor area, the estimates obtained here are relatively consistent with those produced by the first method.
Population estimates for the Zacapu Malpaís urban and peri-urban sites based on the available residential area per person.

Given the general agreement of the population estimates produced using these two methods, the average of the lowest and highest estimates (rounded to the nearest increment of 500) can be considered a reasonable estimate of the population of the Zacapu Malpaís. Following this rationale, we suggest a total urban population during the Milpillas phase of approximately 25,500 individuals, with an additional 6,500 inhabitants of the peri-urban areas (3,000 and 3,500 for the northern and southern peripheries, respectively). This estimate, however, does not consider the under-enumeration of structures that results from desk-based interpretation of LiDAR visualizations.
Socio-spatial structure
Based on extended work conducted at the site of Malpaís Prieto (Mich. 31), occupied solely during the Milpillas phase, several interpretations regarding the urban socio-spatial structure have been suggested. These interpretations can now be evaluated using data from the other three sites. Such interpretations rely on three primary kinds of spatial data: the variation in residential density, the distributions of different size categories of residential room-buildings, and the spatial relationship between variations in residential density, house size, and the location of religious centers. To observe these data in their geographic settings, adjusted room-building sizes were reintegrated into the GIS shapefiles containing the initial digitized feature polygons.
Density variation
Reevaluation of both room-building counts and site areas using LiDAR-derived data provides the opportunity to revise intra- and inter-site residential densities (Table 6). The urban sites (Mich. 31, 38, 23, and 95–96) present internal densities ranging from 431 to 2,702 room-buildings per km2, with an average density of 1,078 room-buildings per km2. Based on an estimate of 25,500 urban inhabitants, this suggests a population density of 7,025 persons per km2. Peri-urban extensions in the southern area of the Malpaís (Mich. 313, 314, 315, and 322) also exhibit comparable, although slightly lower densities (370–1,523, with an average density of 906 room-building per km2), with an estimated population density of 7,000 persons per km2. In contrast, the northern periphery (Mich. 31N, 68, 317, 319, 410, and 417) exhibits relatively low densities, ranging from 24 to 132 room-buildings per km2, with a population density of 615 inhabitants per km2.
At the intra-site scale, as illustrated in Figure 6 with the case of El Infiernillo (Mich. 38), residential room-building density varies widely, from low-density (site margins, 0–183 houses per km2) to high-density areas (over 1,600 buildings per km2) in the core areas in both the southern and northern portions of the site. Comparison of the residential density to the distribution of religious centers at the site suggests that only a small portion of religious centers are located in areas of high residential density, with most being located in areas of moderate density. This spatial structure is also evident at Las Milpillas, Malpaís Prieto, and, in a more limited measure, at El Palacio. This pattern seems therefore to be an important common structural trait of the four urban settlements.
Variation in residential room-building density in the northwest sector. Image by the author.

House size variation
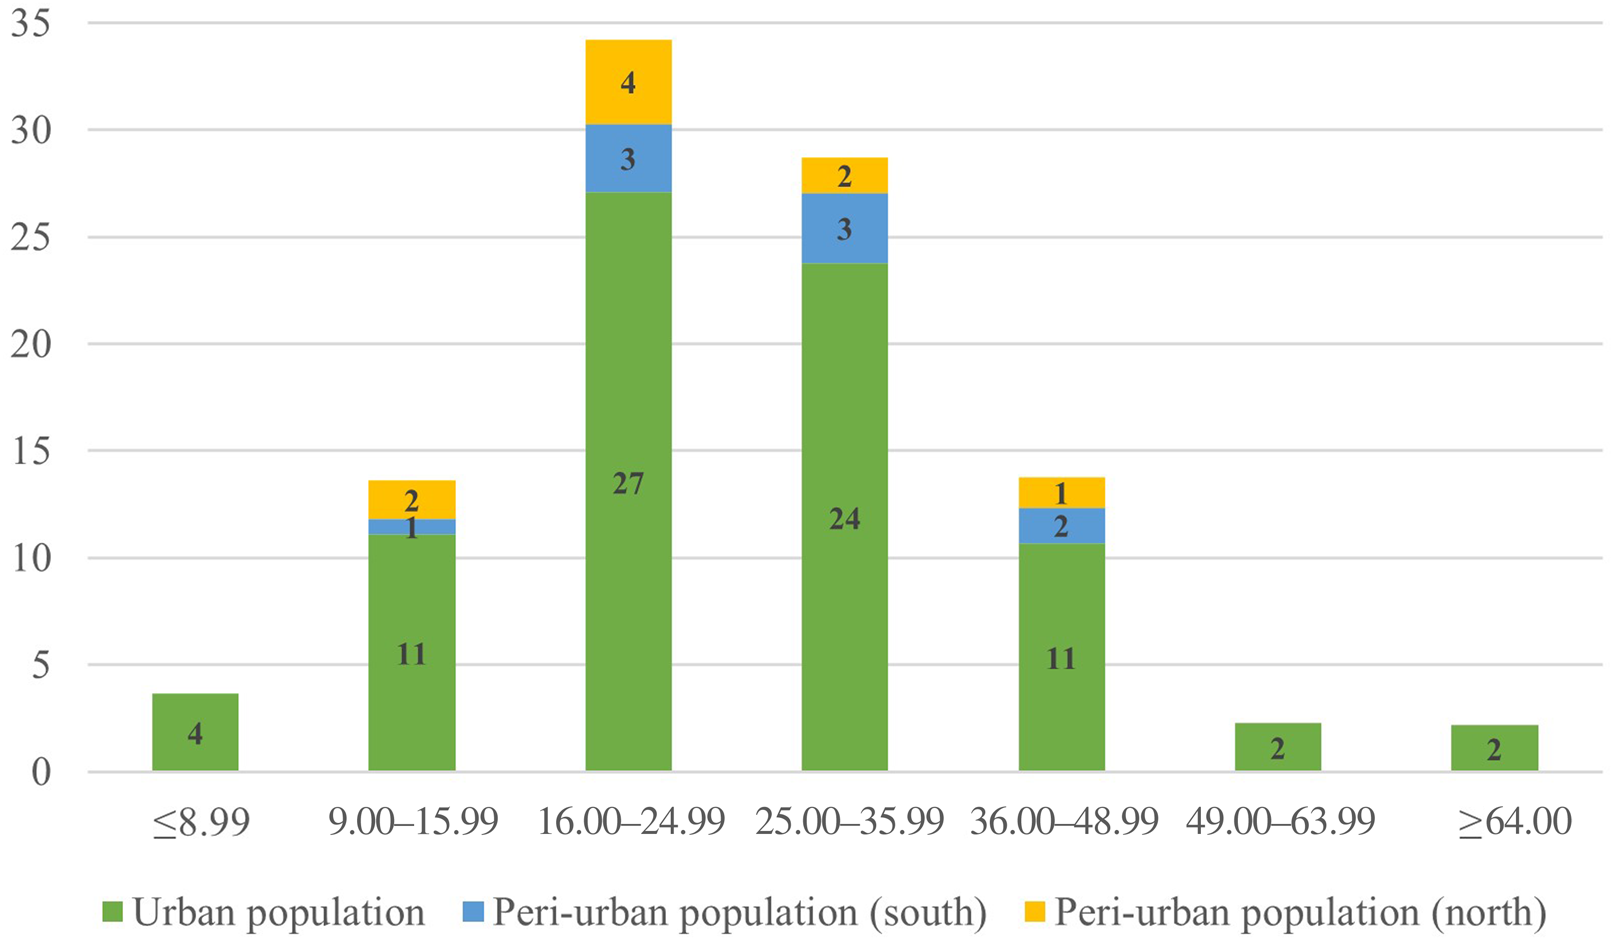
The inhabitants of the Zacapu Malpaís urban and peri-urban settlements lived in houses that varied greatly in size. Despite this variation, 63% of habitations range from 16 to 36 m2 in area. In comparison, only 18% of residential room-buildings exceed 36 m2 in area, and only 4% exceed 49 m2 (Figure 7). This distribution of house sizes can be interpreted as the expression of distinct household composition, as discussed above. However, the observed locations of large buildings as opposed to small and medium structures within the sites provide evidence for social differentiation expressed in both house size and differential access to the religious centers.
Distribution of urban and peri-urban populations within the house size classes. Graph by the author.

Figure 8 presents the results of the interpolation of residential room-buildings based on their size at the intra-site scale for El Infiernillo, in the northwest area of the Malpaís. Although present in most areas of the sites, large residential buildings tend to be located and concentrated in the immediate vicinity of religious precincts. This systematic association of large habitations with the religious centers is consistent with observations previously made at Malpaís Prieto (Forest Reference Forest, Roskamp and Albiez-Wieck2016) and observed at the site of Las Milpillas. This spatial distribution is present at different areas of these three sites, forming distinct concentric patterns structured around one of several religious precincts.
Inverse distance weighting (IDW) interpolation of house size in the northwest area of the Zacapu Malpaís. Image by the author.

In addition, when comparing the distribution of large houses against the density variation at the site (as illustrated by Figures 6 and 8) a clear relationship is apparent: areas with a higher concentration of large houses tend to be areas of lower residential density. This spatial relationship is observed at Las Milpillas, El Infiernillo, and Malpaís Prieto, and, to a lesser degree, at El Palacio. The preservation of the latter site somewhat obscures the patterning, but available data suggest that it is there.
Discussion
The analysis of the LiDAR-derived data obtained in 2015 for the Zacapu region has shed new light on the urbanization phenomenon that occurred between a.d. 1250 and 1450 in northern Michoacan. Characterizations of this social and spatial event within the regional context have been widely discussed in previous studies, and many initial interpretations and hypotheses have preceded this study. Reassessing population estimates and socio-spatial structure at the landscape scale that is facilitated by LiDAR provides a refined picture of the Zacapu Malpaís urban system during the Middle Postclassic that both confirms and revises previous interpretations. It also allows a finer integration of these settlements into the body of literature concerning migration-related urbanization processes in both the local and regional historical contexts, as well as the wider context of the Mesoamerican highlands.
The results of this study have provided revised population estimates for the Zacapu Malpaís, based on a comprehensive dataset built by the Uacusecha and Mésomobile archaeological projects, using LiDAR-derived data. Where previous population estimates had to rely on extrapolation for sites without available information, the manual extraction of features enabled the compilation of data for all urban and most of the peri-urban sites, thereby providing a refined and reliable count of residential structures. During the Milpillas phase, the Zacapu Malpaís urban system was more densely inhabited than has been previously suggested. The population estimates presented here represent an increase of at least 5,500 people for the four urban centers, and 12,000 people for the entire urban and peri-urban system.
The LiDAR-derived visualizations also enabled a more comprehensive evaluation of the variations in settlement density throughout the landscape (see Figure 9). During the Milpillas phase, the population was aggregated in different areas of the Zacapu Malpaís and its surroundings, with high variation in density between peri-urban rural sites (Mich. 31N, 319, 410, and 417), peri-urban secondary residential sites (Mich. 38N, 68, 313, 314, 315, 317, and 322), and the urban centers (Mich. 23, 31, 38, and 95–96).
Variation in residence density at the Zacapu Malpaís during the Milpillas phase. Image by the author.

The population estimates presented here are subject to at least four caveats. First, variation in preservation and the associated destruction of architectural features will generate false negatives. Second, desk-based interpretation also tends to produce false negatives due to the difficulties of detecting small features using LiDAR visualization. These two aspects can potentially result in an underestimate of population. Third, LiDAR data do not carry chronological information. As a result, it is possible that not all of the visible archaeological features pertain to the Milpillas phase occupation of the area and may therefore represent false positives in terms of population estimation. Finally, and related to the previous caveat, it is possible that not all of the residential structures were occupied simultaneously during the two centuries included in the Milpillas phase. This, too, represents a potential source of false positive results. While these potential sources of error should be acknowledged, they are difficult to evaluate, quantify, and adjust for, given currently available information.
Evidence for inter-site emerging social complexity
Considered as independent spatial units, the four urban settlements at the Zacapu Malpaís exhibit similar spatial structures, where social differentiation is expressed through the same suite of spatial privileges, including house size, lower density residential settings, and, more importantly, stronger spatial integration with the religious precincts at these sites. While these trends are less clear at El Palacio due to poor preservation and an apparently different trajectory of urban growth (Forest and Jadot Reference Jadot and Forest2020; Forest et al. Reference Forest, Quezada, Castañeda and Pereira2018), this polycentric structure seems to be a consistent pattern of the Zacapu Malpaís urban system, where 6–19% of the population appear to have engaged in higher-status residential lifeways. These results are consistent with the earlier hypothesis that the communities of the Zacapu Malpaís urban system during the Milpillas phase had undertaken a process of social differentiation that was expressed in the settlement pattern at a broad scale, and similar from one site to the other. There are two potential sources of this socio-spatial complexity. First, the groups who aggregated in the thirteenth century already exhibited social differentiation and incorporated these principles in the construction of their built environment. Alternatively, the sudden population aggregation and unprecedented lifeways generated by these new spatial settings initiated the process of increasing social, economic, and perhaps political complexity that accompanied and shaped the urban development. While both interpretations are plausible, a combination of the two provides a more nuanced explanation. Here, pre-existing principles of social differentiation were present in some or all of the groups who aggregated on the top of the Malpaís lava flow. However, they were catalyzed by the new urban settings and lifeways adopted by and/or imposed upon the entire new urban population, in a process of acculturation and social integration such as has been documented for rapid episodes of community formation and urbanization in both past and present contexts (e.g., Beals Reference Beals1951; Butterlin Reference Butterlin2003; Keefe Reference Keefe1979). Such a process could explain the highly homogeneous material culture, including the architectural typology and spatial patterning, expressed across these urban sites.
Social integration in the Zacapu Malpaís urban system
Analysis of the LiDAR-derived data also confirmed the contrast between urban and peri-urban communities that was previously discussed by Dorison (Reference Dorison2019) for the northern area of the Zacapu Malpaís. Where most of the Milpillas phase population lived close to the religious centers within the urban sites, the inhabitants of the immediate urban periphery likely had different lifeways than their urban neighbors. Both communities, however, were probably tightly connected and interdependent through both subsistence and religious practices. The religious centers, integrated within the urban settlements, might have attracted both urban and peri-urban residents during the Milpillas phase, increasing the urban population during specific ceremonies and community-scale events. At least 79 pyramidal mounds can be associated with the Milpillas phase, distributed throughout various religious precincts at the sites of Malpaís Prieto (13 mounds), El Infiernillo (23 mounds), Las Milpillas (20 mounds), El Palacio (14 mounds), Mich. 313 (3+ mounds), Mich. 314 (1+ mounds), Mich. 315 (1+ mounds), Mich. 68 (1+ mounds), and Mich. 319 (3 mounds). Other mounds have been detected using the LiDAR data (e.g., Mich. 68, Mich. 316, and Mich. 317); however, their utilization during the Milpillas phase remains uncertain. Based on the revised population estimates presented here, the ratio of inhabitants to public centers is over 417 people (or 76 households) per center if considering just the urban population, or 405 people (or 74 households) per center if considering the whole urban/peri-urban population. It is important to note that many features of religious and collective use, such as pyramidal mounds, altars, and community houses, may have been destroyed. This is especially true for small structures located in contemporary farmland that may have been systematically dismantled in the recent past. While small, local religious centers might have existed on the Milpillas phase landscape, it is likely that major community centers located in the four urban settlements were the largest and most important precincts at the time for both urban and peri-urban populations.
Conclusion
The integration of LiDAR-derived data offered the unique opportunity to reassess previous interpretations and hypotheses regarding the nature of the first episode of urbanization in northern Michoacan. Prior to the emergence of the Tarascan state in the Patzcuaro Basin, populations aggregated on top of the unwelcoming volcanic terrain of the Zacapu Malpaís and formed large communities structured in or around four urban cores where residential life exhibited a spatial hierarchy around strategic and polarizing religious centers. The peri-urban communities were most likely connected to the urban centers through economic relationships and processes of social integration related to the local religious life taking place almost exclusively within the urban settlements. More than 80% of the population in the area was living in medium- to high-density residential contexts within urban settings. This is especially true for Malpaís Prieto, where density may have been as high as 146 inhabitants per ha (based on Kolb's constant). As a point of comparison, this population density rivals that of Tenochtitlan (157.4 persons per ha; Smith Reference Smith2005:412). Malpaís Prieto, however, is an exception—the average population density among the urban sites is 70 persons per ha, corresponding to medium- to high-density urban cores documented elsewhere in Postclassic Mesoamerica (Smith Reference Smith2005). In the Patzcuaro Basin, during the Tariacuri phase (a.d. 1350–1541), Pollard (Reference Pollard2008) estimated population densities ranging from 32 to 44 persons per ha for different centers of the basin. As a final comparison, Fisher and colleagues recently analyzed the large Postclassic multicomponent urban settlement of Angamuco in the eastern area of the Patzcuaro Basin and suggested a population density of 15+ persons per ha (Fisher et al. Reference Fisher, Cohen, Fernandez-Diaz and Leisz2017:133).
Although methods of population estimation differ between these different studies, the comparative data they provide help to situate the Zacapu Malpaís urban communities in the broader context of Postclassic Mesoamerica. These sites appear as small to medium-sized urban settlements (the median size postclassic Mesoamerican city is estimated at 0.9 km2 by M. E. Smith Reference Smith2005), with a medium to high population density and a strong contrast between peri-urban and urban areas. What sets these Zacapu cases apart is that they reach these sizes and population densities within a relatively short period of occupation, within about two centuries, and are subsequently suddenly abandoned (Migeon Reference Migeon2003). While the size of the urbanization phenomenon of the Zacapu Malpaís is not exceptional in comparison to the whole of Postclassic Mesoamerica, the rate at which it occurred is impressive. These observations demonstrate that social complexity and urban life pre-dated the emergence of the Tarascan state and were likely crucial in this process.
Acknowledgements
I warmly thank the Uacusecha Archaeological Project (PI Grégory Pereira; project funded by the French National Center for Scientific Research and the French Ministère de l'Europe et des Affaires Etrangères) and the Mésomobile Project (PI Véronique Darras; LiDAR data, grant ANR-14-CE31-0016) for giving me the opportunity to collect and combine these data sets. All the data collection discussed in the article received the authorization of the Consejo de Arqueología of the Instituto de Antropología e Historia of Mexico (permit numbers C.A. 401-36/0356, 401.B[4]19.2011/36/1660, 01.B[4]19.2015/36/2458, 401.B[4]19.2016/36/2271) and complies with the permits’ terms. I am grateful for Andrew Seidel's critical help with proofreading, along with running the numbers to determine the bias and inaccuracy of LiDAR-derived measurements and to provide adequate adjustment methods. Antoine Dorison and Grégory Pereira provided important data and discussion during the preparation of this article, and I thank them warmly. Finally, I wish to thank the three anonymous reviewers for their helpful suggestions on this article.