Implications
An animal welfare index for sow herds based on register data from meat inspection, medication and mortality failed to display a linear relationship with an animal welfare index based on-farm animal-based measures. On-farm measures of welfare indicators are still needed to obtain valid assessments of animal welfare.
Introduction
Over the last decades research into methods of assessing animal welfare at herd level has intensified (Sorensen and Fraser, Reference Sorensen and Fraser2010). A comprehensive animal welfare assessment protocol for sows and piglets has been developed in the Welfare Quality® project (Welfare Quality®, 2009). Today the use of mainly animal-based measurements (e.g. vulva lesions, body condition score and hygiene) in welfare assessments of pig herds is recommended (EFSA, 2012). However, assessing welfare at herd level using an on-farm animal-based measurements protocol is rather cost intensive and time consuming. Thus, there is an interest in using already existing data such as register data on meat inspection, medication and mortality for assessing welfare at herd level.
Register data from dairy herds (e.g. on the incidence of mastitis, cow mortality, incidence of claw and lameness diseases) have been investigated as welfare indicators for assessing animal welfare in dairy cattle herds. Sandgren et al. (Reference Sandgren, Lindberg and Keeling2009) identified two fertility measurements and calf mortality as useful welfare indicators with which to identify dairy herds with poor welfare in Sweden. In 2011, a literature review examining the association of register herd data and on farm animal-based measurement used in Welfare Quality® (2009) for assessing animal welfare in a dairy cattle herd was carried out (de Vries et al., Reference de Vries, Bokkers, Dijkstra, van Schaik and de Boer2011). It was concluded that there was an association between 23 register data measurements and 16 of the Welfare Quality® (2009) measurements (de Vries et al., Reference de Vries, Bokkers, Dijkstra, van Schaik and de Boer2011).
In Denmark register data potential suitable for assessing sow herd data are stored in several central databases, each specializing in a specific kind of data obtained for different other purposes. However, our knowledge on the usefulness of database information for a multidimensional animal welfare assessment of pigs is limited.
In the paper, data from the three central databases – DAKA (mortality), Vetstat (medicine use: antibiotics and analgesics) and meat inspection (slaughter data) – are used to create a database welfare index (DBWI) at herd level for sows. For the purpose of validation, DBWI was compared with an on-farm animal-based welfare index (AWI) for sows in a herd. Both indices were structured according to the structure of Welfare Quality® (2009) assessment scheme with four principles and 12 criteria. The objective of the study was to develop the DBWI and validate it with the AWI by investigating the ability for DWBI to predict AWI.
Material and methods
Selection of herds
Data were collected from 63 herds; 51 conventional sow herds and 12 organic sow herds. The 51 conventional sow herds were selected from a random sample of 797 Danish herds with a herd size of ⩾100 sows. The 797 herds were randomly identified in the central Danish farm database and have been used in a previous study (Jensen et al., Reference Jensen, Bonde, Kongsted, Toft and Sorensen2010). For logistical reasons only the 660 herds located in Jutland or Funen were considered. A random sample of 264 herds out of the the 660 herd was selected and asked to participate in the study. Following enquiries, 51 (19%) of herds accepted and subsequently participated in the study. The average herd size of the conventional herds included in the study was 534, and actual numbers ranged between 130 and 2500. This compares with a national average conventional herd size of 640 sows. Organic sow herds in this study were recruited through an organic adviser group that covers 70% of all organic slaughter pigs in Denmark. Of the 16 herds owners approached, 12 volunteered to participate in the study. These 12 herds had an average herd size of 359 sows, with actual numbers in the range 80 to 1200. The study population of 16 herds had an average herd size of 335 sows, and actual numbers ranged from 50 to 1200 sows.
Description of housing systems
Danish conventional sows are housed indoors. We distinguish between two housing systems; a housing system with crated gestating sows in stalls and a housing system with loosed housed gestating sows. The present study, include 14 herds with crated gestating sows and 37 herds with loose-housed sows. The loose-housed gestating sows were fed separately, either in individual eating boxes or by electronic sow feeders in large groups. All sows in the included 51 conventional herds were crated during farrowing and lactation in farrowing crates. The piglets were weaned 4 to 5 weeks postpartum. Each of the 51 conventional sow herds was visited once between autumn 2010 and spring 2011 for data collection for the AWI. The recordings were conducted by three experienced observers (first author and two technicians).
The gestating sows in the organic herds included in this study had access to pasture all year around and were group fed. All sows farrowed in huts on pasture and piglets were weaned at the earliest at 7 weeks of age. The organic sows were kept on pasture during all seasons, except for a few weeks during mating, where they were kept indoor in loose housing with access to an outdoor run. The organic sows were not crated during gestation or lactation. All of the organic sows in this study had access to roughage all year round. Each of the 12 organic sow herds was visited between 14 June and 20 October 2011 for data collection for the AWI. The recordings were conducted by three observers (first author, a veterinary student and a technician): The observations conducted in each organic herd were conducted jointly by two observers.
Databases
Meat inspection data are collected routinely in all Danish slaughterhouses. The variables collected include slaughterhouse number, date, herd number, animal age/group and meat inspection codes for individual pigs. The meat inspection codes relate to health or pathological lesions. They record, for example, broken bones, signs of chronic pneumonia, and man-made bruises. The meat inspection data used provided the prevalence of sows at slaughter with a given meat inspection code from a given herd. In the national database Vetstat, the use of antimicrobials and analgesics for production animals is recorded at herd level. The data include information on animal species and age group (Nielsen, Reference Nielsen2011). Vetstat data originate from pharmacies, veterinarians and feed mills, but the veterinarian writes the prescription in all cases (Stege et al., Reference Stege, Bager, Jacobsen and Thougaard2003). The prescription is recorded together with information about the veterinarian, herd, and type of drug, and with information about the quantity of medicine and disease group. There are six main disease groups corresponding to the six main diagnostic groups for sows: (1) reproduction and urogenital system, (2) udder, (3) gastro-intestinal system, (4) respiratory system, (5) joints, limbs, hooves, central nervous system, skin and (6) metabolism, digestion, circulation. The measurements used in the DBWI are average daily doses (ADD) used per year per sow (200 kg) in a given herd for each diagnostic group. Consequently six measurements from Vetstat were included in DBWI. Data on sow mortality in herds were obtained from the rendering plant DAKA covering all of Denmark. Herd identity, animal group and age group are recorded at the rendering plant. Calculations of the percentage of dead sows per year as its measurement were used in the DBWI.
Herds with different database measures
After the herd visit, data from the three databases (meat inspection, Vetstat and DAKA) were obtained covering the year (365 days) before the herd visit date. Mortality rates, numbers of animals slaughtered, as well as ADD per sow per year, were calculated. Vetstat data were available from all 63 sow herds. Meat inspection data were absent from 28 herds because sows were delivered to slaughterhouses in Germany. DAKA records were missing from seven herds due to mistakes in the way the sows had been recorded at DAKA. Combined this meant that data for all measurements were available for 32 herds. Measurements from Vetstat and DAKA (but not meat inspection) were available for 56 herds.
Measurements included in DBWI and AWI
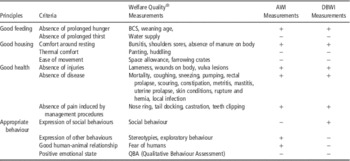
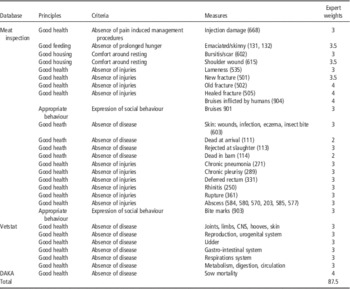
The Welfare Quality® (2009) structure is based on 12 criteria’s classified into four general principles. For the DBWI 28 measurements were selected from the three databases. The measurements covers all four Welfare Quality® (2009) principles and 6 out of the 12 criteria in Welfare Quality. The six criteria included were covered in the following manner. Absence of prolonged hunger: one measurement, Comfort around resting: two measurements, Absence of injuries: 11 measurements, Absence of disease: 11 measurements, Absence of pain induced by management procedures: one measurement and Expression of social behaviour two measurements. The six criteria ‘Absence of prolonged thirst’, ‘Thermal comfort’, ‘Ease of movement’, ‘Expression of other behaviours’, ‘Good human–animal relationship’ and ‘Positive emotional state’ were not covered by measurements from the databases. The AWI, includes 10 measurements on lactation sows and 10 measurements on gestating sows covering seven of the underlying 12 criteria in Welfare Quality® (2009). The five Welfare Quality® (2009) criteria not addressed in AWI were ‘Thermal comfort’, ‘Ease of movement’, ‘Absence of pain induced by management procedures’, ‘Expression of social behaviour’ and ‘Positive emotional state’. An overview showing which Welfare Quality® (2009) principles and criteria are covered by DBWI and AWI is presented in Table 1. The 28 measurements included in DBWI are listed in Table 2.
Coverage of principles and criteria’s in the Welfare Quality® framework by measurements included in the two sow welfare indices: the on-farm animal-based welfare index (AWI) and the database welfare index (DBWI)

+=included, −=not included; BCS=body condition score.
Median weights from the 12 experts for 28 welfare measurements used for aggregation of measurements into of the sow herd welfare index DBWI

DBWI=database welfare index; CNS=central nervous system.
Expert opinion panel
An expert panel’s opinion was obtained and used to assign all weights used for calculating DBWI and AWI. Sixteen Danish experts on sow welfare were invited to participate in an expert opinion panel. Twelve responded to an online questionnaire during 2012. The 12 expert panellist affiliations were as follows: the Danish Pig Research Centre (four individuals), the Knowledge Centre of Agriculture (two), the Danish Animal Protection Organization (one), the Danish Veterinary and Food Administration (one), Aarhus University (two), and local production adviser offices (two). Four veterinary practitioners, invited to participate in the expert panel, did not respond.
The experts were given an overall instruction explaining the purpose with their participation as expert. Each expert was provided with the protocol for the AWI and with a list of measurement to be included in DBWI. The experts were asked to provide weights in two steps. First step was to focus on three level variables (none, moderate, severe) and provide a weight for moderate relative to severe. The experts were subsequently (second step) asked to weigh all severe measurements according to each other to for making a single welfare index score for at herd level. In addition, the experts assigned weights expressing the relative importance of each of the three databases for calculation of the DBWI. For all measurements, opinions on relative measure weights in DBWI were obtained via closed questions. The experts were asked to give scores on a five-point Likert scale ranging from 1 (not-important) to 5 (very important) for each measurement. Relative weightings of measurements were ensured by recurring a mean of 3 (=equally important) (see Table 2).
DBWI and AWI aggregation models
All measures were aggregated into a herd DBWI using the formula:
 $$\eqalign{{\rm DBWI}= \left( {{{\sum_{j=1}^{k1} N_{j} W_{j} } \over {{\rm max}_{1} }}{\times}P1{\plus}{{\sum_{j=1}^{k2} N_{j} W_{j} } \over {{\rm max}_{2} }}}\right \cr \left{\times} P2{\plus}{{\sum_{j=1}^{k3} N_{j} W_{j} } \over {{\rm max}_{3} }}{\times}P3 \right) \times 100 $$
where N is the herd prevalence, or incidence, of measurements, W the expert panel medians of relative measure weights (see Table 2), j the individual measure within each database, P1 was the weight of the meat inspection database, P2 was the weight of the medication database Vetstat and P3 was the weight of the mortality database DAKA. The terms: max1, max2 and max3 was the maximum herd score for the three databases respectively, and k1 was 21, k2 was 6 and k3 was 1 corresponding to the numbers of measurements from each database. The complete aggregation model was multiplied by 100 to normalize the scores between 0 and 100.
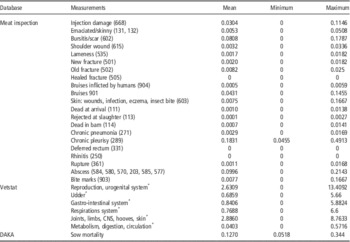
The maximum herd score was calculated as the sum of expert median weight (see Table 2) times the maximum observed prevalence (see Table 3) for each of the three databases (the medication database Vetstat, mortality database DAKA, and the meat inspection database).
Within herd prevalences and herd means (mean, minimum and maximum) of 28 welfare measurements from data collected in a year from three databases

CNS=central nervous system.
The herd prevalences (meat inspection and mortality data) and herd means (medication data) were used for calculation database welfare index (DBWI) for each herd.
* Average daily dose per sow per year.
The AWI scores were aggregated using the formula:
 $${\rm AWI}=\mathop \sum\limits_{i=1}^k \left( {M_{i} MW_{{i }} {\plus}S_{i} } \right)W_{i} {\plus}\mathop \sum\limits_{j=1}^l N_{j} W_{j} $$
(Modified Burow et al., Reference Burow, Rousing, Thomsen, Otten and Sørensen2013)
where M, S and N are the herd prevalence of moderate measurement levels, severe measurement levels and non-level graded measurements, respectively, MW and W were the expert panel medians of relative measurement level weights and measurement weights, respectively, i was the individual level graded measurement, j was the individual non-graded measurement, and k was 17 and l was 3.
Seventeen of the 20 measurements included in AWI were measured on the three-level scale (non-level, moderate and severe welfare problem). The moderate levels of graded variables were converted to severe level equivalents by weights given by the expert opinion panel. The three non-level graded measurements were measurements of present not-present variables.
Statistical analyses
Validation of DBWI with AWI
The linear dependency of AWI on DBWI was tested using a general linear model:
 $$Y_{{ij}} =\mu {\plus}A_{i} {\plus}Bx_{{ij}} {\plus}A_{i} Bx_{{ij}} {\plus}{\varepsilon}_{{ij}} $$
where Y is the herd AWI scores for the jth herd within the ith housing system, µ the intercept, A i the fixed effect of the ith housing system (Stalls, Loose-housed and Organic), B the estimate of the regression of DBWI on AWI, A i B the regression of DBWI on AWI for the ith housing systems, x ij the herd DBWI score for the jth herd within the ith housing system and ɛ ij is assumed to be normally and independently distributed (ɛ~N (0, σ 2)). The model were applied on three data sets from three groups of herds depending on their data; including the measurements from Vetstat only (63 herds), Vetstat and DAKA data (56 herds) and Vetstat and meat inspection and DAKA data (32 herds).
Results
Expert opinions
The experts’ median measurement weights are presented in Table 2. The measurement of individual weights ranged from 2 to 4. The panel was asked to weight the three databases against each other. Meat inspection data should account for 39% of DBWI, while Vetstat and mortality should account for 29% and 32%, respectively.
Herd prevalences of measurements and mean of ADD
Herd prevalences of the 21 meat inspection measurements and sow mortality as well as mean for the six ADD are shown in Table 3. The mean prevalences of the 21 meat inspection measures ranged from 0% to 18%. Five measurements had a prevalence of >1%, and three measurements had not been recorded at all, as shown in Table 3. The six different Vetstat measurements (diagnostic group means) ranged from 0.04 to 2.88 ADD per animal per year. The one DAKA measurement; sow mortality had a mean of 12.70%, with a range of 5.2% to 34.4%.
Validation of DBWI with AWI
The observed maximum herd score for each individual weighted database was: 2.39 for meat inspection, 50.32 for Vetstat, and 1.38 for DAKA, which was used directly in the aggregation into a herd DBWI. The scale of DBWI ranged from a theoretical 0 to 100. The DBWI index values for the 32 herds with complete data ranged between 17 and 79, with a mean of 48.
The general linear regression model analysis did not find significant linear overall dependency of AWI on DBWI and no significant dependency of AWI on DBWI within housing systems for any of the three groups of herds (herds with all data (32), herds with medication and mortality data (56), and herds with medication data (63)) (see Table 4).
Test of linear dependency of AWI on DBWI overall and within housing systems linear regression analyses were performed with the F-test

AWI=animal-based welfare index; DBWI=database welfare index.
In all, 32 herds with all 28 measurements, 56 herds with seven measurements form medication and mortality and 63 herds with six measurements form medication data.
Discussion
The objective of the study was to investigate whether an animal welfare index based on register data (DBWI) could replace a welfare index based on animal based on on-farm measures (AWI). This study showed no linear association between DBWI and AWI and therefore suggests that DBWI cannot replace AWI.
The investigations were based on data from 63 Danish sow herds. Both DBWI and AWI were based on the Welfare Quality® framework. A simple weighted aggregation model was used for both indices. The weights used to construct the indices were derived from expert panel opinions.
The Welfare Quality® (2009) welfare assessment protocols are generally based on cross-sectional data. A literature review conducted by de Vries et al. (Reference de Vries, Bokkers, Dijkstra, van Schaik and de Boer2011) investigating the association between register cattle data and welfare indicators from the Welfare Quality® cattle assessment protocol, concluded that there is an association between the former and the latter. Otten (Reference Otten2014) analysed in a parallel study with a similar design the relationship between an index based on on-farm animal-based measurements and an index based on register data for dairy cattle herds. Otten (Reference Otten2014) found similar to our study no clear relationship between indices based on these two types of data.
The Welfare Quality® criteria covered by AWI and DBWI are shown in Table 1. Each index only covers 6 out of 12 Welfare Quality® criteria’s only, However four criteria are common to both DBWI and AWI: ‘Absence of pain induced by management procedure’ and ‘Expression of social behaviour’ instead of ‘Expression of other behaviours’ and ‘Good human–animal relationship’.
As the two indices to a large extent cover the same criteria’s we expected a linear dependency.
AWI was based on measurements obtained during a 1-day herd visit. This provides a snapshot of the herd welfare on a specific day. DBWI was based on measurements from data collected over a period of time – in this case 365 days before the AWI measurements, to account for season and management variation. The two types of data do not cover the same animals in the same environment. However, it was expected that herd specific aspects related to housing and management would lead to similar results within a herd.
Conclusion
The present study suggests that an animal welfare index using combined data from register data including data concerning mortality, medication and meat inspection cannot replace an animal welfare index using on-farm animal-based measurements.
Acknowledgements
The study is part of the project ‘On-farm animal welfare assessment for farmers and authorities’, which is supported by funds from The Ministry of Food, Agriculture and Fisheries of Denmark. The authors wish to thank technicians and farmers for participating in the project.