Introduction
Nutritional status of the ewe during pregnancy is critical, as it has major implications through its effect on ewe reproductive efficiency and colostrum production, and also on foetal development and subsequent lamb survival and performance. Nutrition influences certain metabolic pathways, not only directly by providing essential nutrients, but also indirectly by modifying the expression of hormonal functions, which in turn influence oocyte maturation, ovulation, embryo development, foetal growth and the viability and vigour of the newborn lamb (Robinson et al., Reference Robinson, Rooke and McEvoy2002). In the past, greater emphasis has been placed on nutrition during late pregnancy, because during this period exponential foetal growth occurs, placing a significant increase in the dietary requirements of the ewe. However, attention is now turning to the important role of nutrition earlier in pregnancy through its effects on fertilisation, implantation, placental development, foetal organogenesis and growth.
Recently, it has been reported that the role of nutrition during the 1st month of pregnancy depends largely on the degree of maturity of the ewes, as adolescent and mature ewes differ in their response to different planes of nutrition in early pregnancy (Annett and Carson, Reference Annett and Carson2006). With mature ewes, Parr et al. (Reference Parr, Williams, Campbell, Witcombe and Roberts1986) reported that even though embryos underwent a period of reduced growth due to restricted maternal nutrition during the first 35 days of gestation, there were no detrimental effects on the offspring’s performance. More recently, Annett and Carson (Reference Annett and Carson2006) suggested that mature ewes were insensitive to an oversupply of nutrients as these authors found no effects of over- or under-feeding during the first 30 days of gestation on conception rate, foetal development or lamb output.
The impacts of nutritional manipulation during mid-pregnancy on placental development and foetal growth have been well documented. In reviewing the literature, Kelly (Reference Kelly1992) found that out of 16 experiments evaluating the effect of differential nutrition during mid-pregnancy (between 40 and 100 days of gestation) all but two demonstrated an effect on placental weight. Placental weight is highly correlated with birth weight (Mellor, Reference Mellor1983), which is associated with the survival and growth potential of the offspring. The effects of oversupply of nutrients during mid-pregnancy on foetal development have been less well studied than the effects of undersupply of nutrients. With singleton-bearing adolescent sheep, oversupply of nutrients throughout pregnancy promotes maternal tissue synthesis at the expense of the nutrient requirements of the gravid uterus (Wallace et al., Reference Wallace, Bourke, Da Silva and Aitken1996, Reference Wallace, Aitken and Cheyne2001 and Reference Wallace, Aitken, Milne and Hay2004). However, the same group (Wallace et al., Reference Wallace, Milne and Aitken2005), when working with adult sheep, found no differences between the treatment groups in placental or foetal weight.
Therefore, the ewe’s reproductive response and the results obtained on foetal development and offspring performance following nutritional manipulation during early and mid-pregnancy are influenced by critical factors such as maturity of the ewe, level and length of feeding regime, and stage of pregnancy (reviewed by Redmer et al., Reference Redmer, Wallace and Reynolds2004). The same authors have noted that most of the studies conducted on this topic have focused on nutrient restriction rather than oversupply; on mid- and late pregnancy feeding periods, rather than early gestation, and that the effects are usually evaluated during the foetal period rather than with lambs fully developed at birth or as subsequent juveniles.
In view of this background and with the aim of integrating the different aspects mentioned, the objectives of the current study were to investigate the effect of different planes of nutrition during early and mid-pregnancy of mature ewes, on maternal and offspring performance to weaning.
Material and methods
The work described in this paper, in particular all procedures involving animals, was conducted in accordance with the requirements of the UK Animals (Scientific Procedures) Act 1986.
Animals
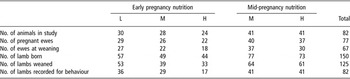
A total of 82 multiparous crossbreed ewes of 3 and 4 years of age were used in the study (Table 1). The breeds of the ewes were Greyface (Border Leicester × Scottish Blackface) and Texel × Greyface. Fifteen rams from two different breeds were used in the study – Charolais and Texel. Prior to the commencement of the study, all animals had ad libitum access to fresh pasture. The mean ± s.d. live weight (LW) and body condition score (BCS) of the ewes at the start of the study were 77.9 ± 8.0 kg and 3.8 ± 0.2, respectively.
Number of multiparous ewes and lambs involved in the study

Nutrition provided: low (L), medium (M) or high (H) as compared to predicted metabolisable energy requirements for maintenance.
Experimental design
The experiment was carried out at the Agri-Food and Biosciences Institute, Hillsborough. All ewes were housed in individual pens on wooden slat floors at the start of the study, where they remained throughout pregnancy. The ewes were submitted to an oestrus synchronisation regime based on intravaginal sponges containing 30 mg flugestone acetate for 12 days (Chronogest®, Intervet UK Ltd, Milton Keynes, UK), followed by an intramuscular injection of 300 IU serum gonadotrophin (Fostim 6000®, Pharmacia & Upjohn Animal Health Ltd, Kalamazoo, MI, USA). Two days after sponge removal the ewes were submitted to one controlled natural mating and randomly allocated to treatments and subsequently balanced for LW, BCS, ewe breed and sire breed.
From day 1 to day 39 post mating (early pregnancy, EP) ewes were placed on one of three planes of nutrition that were individually estimated to provide either 200% (high, H) 100% (medium, M) or 60% (low, L) of predicted metabolisable energy (ME) requirements for maintenance (Agriculture and Food Research Council, 1993). From day 40 to day 90 of gestation (mid-pregnancy, MP) ewes within each EP treatment were allocated to rations providing either 80% (medium, H) or 140% (high, H) of their individual ME requirements. The diets offered were based on grass nuts. They contained 899 g dry matter (DM) per kg and supplied the ewes with 149 g crude protein (CP) per kg DM. In vivo ME values (10.2 MJ/kg DM) determined previously (Annett and Carson, Reference Annett and Carson2006) for grass nuts were used in the current study. Ewes were offered on average ± s.d. 0.60 ± 0.04, 1.01 ± 0.08 and 1.98 ± 0.16 kg fresh weight per day for EP treatments L, M and H, respectively, and 0.75 ± 0.06 and 1.32 ± 0.11 kg fresh weight per day for MP treatments, M and H. Within each treatment, half of the ewes received a selenium supplement consistent of 1 g of Selplex® (Alltech, Belfast, NI, UK), providing a selenium intake of 0.5 mg per ewe per day, offered from day −14 to day 90 of pregnancy, as described by Muñoz et al. (2007). During early and mid-pregnancy, diets were supplemented daily with 25 g of barley, as a vehicle for the intake of selenium and 25 g of straw as a source of fibre. After 90 days of pregnancy, all ewes were offered increasing levels of grass nuts to meet their individual energy and protein requirements for late pregnancy calculated in accordance with their LW and expected litter size (Agriculture and Food Research Council, 1993). From day 105 of gestation onwards, diets were supplemented with 25 g of straw, 100 g/day of Sopralin® (Trouw Nutrition, Belfast, NI, UK) and 25 g/day of a standard vitamin and mineral mix: VMC Sheep® (Trouw Nutrition) which supplied per kg vitamin A, 400 000 IU; vitamin D3, 80 000 IU; vitamin E, 600 IU; Se, 10 mg; Ca, 170 g; P, 40 g; NaCl, 320 g; and Mg, 60 g. The total daily feed allocation was offered in a single feed at 0930 h. Pregnancy status of the ewes was determined by ultrasound scanning on day 55 of gestation. All non-pregnant animals were removed from the study and their data were included in the analysis only up to day 55. Following lambing, ewes remained indoors with their lambs for 48 h, after which, they were returned to pasture. Creep concentrate feeding (ME 12.3 MJ/kg DM; CP 204 g/kg DM; 30 g/kg VMC Intensive Lamb® (Trouw Nutrition): vitamin A, 400 000 IU; vitamin D3, 66.667 IU; vitamin E, 1000 IU; Se, 17 mg; Ca, 100 g; P, 3.1 g; and NaCl, 500 g per kg product) was introduced to lambs from triplet sucking ewes at 4 weeks of age and continued until weaning at 16 weeks.
Measurements
The effects of different planes of nutrition during early and mid-pregnancy on placental and foetal development were assed on all animals by transabdominal ultrasonography using a portable Aloka 500 SSD with a 3.5 MHz curvilinear transducer (Aloka, Tokyo, Japan). During the procedure, the sheep were restrained in a crate, in an inverted dorsal position. All ultrasonographic examinations were performed by the same operator. A continuous 2-min ultrasound recording was obtained for a single foetus from each ewe, at days 57 ± 3, 68 ± 2 and 80 ± 1 of gestation, to assess foetal development. Still images of the foetus were transferred to a PC using DT-Acquire 3.3.0 (Data Translation Inc., Marlboro, NY, USA). GLOBAL LAB Image/2 3.6 (Data Translation Inc.) was used for measurements of cranial and abdominal diameters (to the nearest mm), as described by Pharr et al. (Reference Pharr, Rowell and Flood1994). Placental growth was monitored during the same period based on a method described by Kelly et al. (Reference Kelly, Newnham, Johnson and Speijers1987).
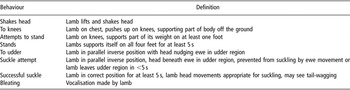
Data on neonatal behaviour were collected in situ immediately following parturition for the first 30 min after the birth of each lamb, using hand-held data recorders and the Observer software system for behaviour research (Noldus information technology, Wageningen, The Netherlands). The first lamb born from each ewe was prioritised for observation in order to maximise the number of replicates. The definition of lamb behaviours (Table 2) were as described by Dwyer et al. (Reference Dwyer, Lawrence, Brown and Simm1996).
Definition of lamb behaviours

Ewe LW and BCS (Russel et al., Reference Russel, Doney and Gunn1969) were recorded at fortnightly intervals throughout gestation, 48 h after lambing, at 3 and 6 weeks post lambing, and at weaning. Jugular blood samples were collected from all ewes at mating, at day 42, at day 83 and at day 138 of gestation. Samples were obtained 2 h 30 min after feeding using heparinised syringes. Blood samples were stored at room temperature for 1 h before centrifuging at 4000 r.p.m. for 10 min. Plasma was stored at −20°C until analysed for progesterone concentrations, determined using an enzyme-linked immunosorbent assay (ELISA) kit (Ridgeway Science Ltd, Gloucestershire, UK).
At lambing, records were kept of lambing date, litter size, lambing difficulty (0 = no assistance, 1 = assistance), birth presentation (normal or abnormal position), birth weight and sex for all lambs. Within 24 h of lambing, nutritional effects on foetal skeletal development were assessed by measuring head and crown-rump length, thoracic circumference, right fore limb and right hind limb length using a flexible measuring tape. Lambs were weighed at 24 h post partum, at 3 and 6 weeks of age, and thereafter at fortnightly intervals until weaning. The lambs were blood sampled by venipuncture using a 5 ml vacutainer. They were kept at room temperature for 1 h after collection and refrigerated at 4°C for a further 24 h. Samples were then centrifuged at 4000 r.p.m. for 10 min. The serum was collected and stored at −20°C until assayed for immunoglobulin (Ig) concentration estimated by zinc sulphate turbidity analyses (McEwan et al., Reference McEwan, Fisher, Selman and Penhale1970), free tri-iodothyronine (free T3) and thyroxine (T4) concentrations. Free T3 was measured using a free T3 kit (Siemens Medical Solutions Diagnostics, Tarrytown, NY, USA) on a Centaur Analyzer (Bayer Healthcare LLC, Diagnostics Division, Tarrytown, NY, USA). Thyroxine concentrations were measured using a T4 Dri kit (Microgenics Corporation, Fremont, CA, USA) on an Olympus AU640 analyser (Olympus UK Ltd, Middlesex, UK). Records of lamb and ewe mortality were kept throughout the study.
Statistical analysis
Due to the unbalanced nature of the experimental design, the quantitative data were analysed using Genstat REML (Residual Maximum Likelihood) procedure in a 3 (planes of nutrition in early pregnancy) × 2 (planes of nutrition in mid-pregnancy) × 2 (selenium supplementation) factorial design. The model used evaluated the main effects and interactions of the treatments while adjusting for the effect of ewe and ram breed. For the lamb data (foetal development, birth weight, skeletal size and LW gains calculated using linear regression), litter size, sex, post-lambing group and age of the lamb were also included as covariates, where appropriate. Categorical data were analysed by binary logistic regression using LogXact (Cytel Inc., Cambridge, MA, USA). Behaviour data were analysed using Stata survival analysis on the lamb latencies, and the Tobit method (Amemiya, Reference Amemiya1973) for the analysis of the frequency of presentation and duration of lamb behaviours.
Results
There were few interactions between plane of nutrition in early and mid-pregnancy, therefore main effects are presented in this paper. A subsequent paper (Muñoz et al., 2007) will describe the effects of selenium supplementation on performance including the one interaction which occurred between plane of nutrition and selenium supplementation.
Live weight and body condition score
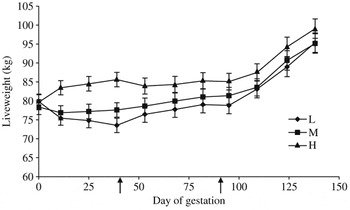
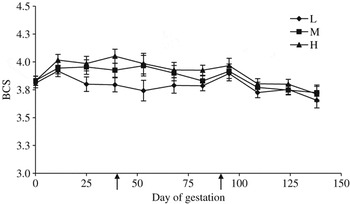
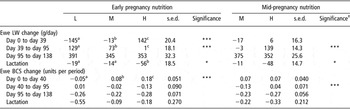
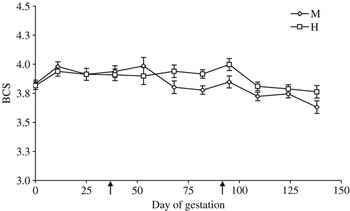
Increasing the plane of nutrition from day 0 to day 39 resulted in increases (P < 0.001) in LW (Figure 1), BCS (Figure 2) and in LW and BCS changes during early pregnancy (H>M>L; Table 3). During mid-pregnancy, ewes offered diet L-EP gained more LW (P < 0.001) and BCS (P < 0.01) than H-EP ewes, with M-EP ewes being intermediate. During late pregnancy, ewe LW and BCS were not different (P > 0.05) between early pregnancy treatments. Nonetheless, ewes offered diet H-EP were heaviest at lambing and lost more weight during lactation than M- or L-EP ewes (P < 0.05).
Effects of plane of nutrition of mature ewes in early pregnancy on mean (±s.e.d.) live weight throughout pregnancy. ↑, diet change.

Effects of plane of nutrition of mature ewes in early pregnancy on mean (±s.e.d.) body condition score (BCS) throughout pregnancy. ↑, diet change.

Effect of plane of nutrition of mature ewes in early and mid-pregnancy on live weight (LW) and body condition score (BCS) change throughout the study

Nutrition provided: low (L), medium (M) or high (H) as compared to predicted metabolisable energy requirements for maintenance.
a,b,cWithin a row, means without a common superscript letter differ (P<0.05).
*Significant at the 5% level, ***significant at the 0.1% level.
†There were no statistical interactions between plane of nutrition in early and mid-pregnancy.
LW = live weight; BCS = body condition score; s.e.d. = standard error of difference.
Feeding ewes diet M during mid-pregnancy resulted in lighter (P < 0.001) and leaner (P < 0.01) dams (Figures 3 and 4, respectively), than ewes offered diet H-MP, at the end of treatment period (day 95). This was also evident when examining LW and BCS change for the period, with H-MP ewes gaining weight and maintaining their fat reserves in comparison with weight and condition losses by M-MP ewes (P < 0.001) (Table 3). These differences were maintained throughout late pregnancy, with H-MP ewes being heavier (P < 0.001) and with more body condition (P < 0.01) than M-MP ewes at day 138. Ewe LW change during the lactation period was affected by plane of nutrition in mid-pregnancy, with ewes offered diet H-MP losing more weight (P < 0.05) than M-MP ewes.
Effects of plane of nutrition of mature ewes in mid-pregnancy on mean (±s.e.d.) live weight throughout pregnancy. ↑, diet change.

Effects of plane of nutrition of mature ewes in mid-pregnancy on mean (±s.e.d.) body condition score (BCS) throughout pregnancy. ↑, diet change.

Plasma progesterone concentrations
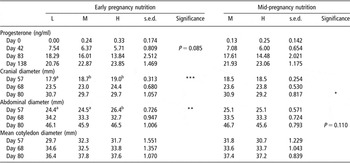
Plasma progesterone concentrations of ewes at mating were close to zero for all animals (Table 4). Progesterone concentration at day 42 of gestation tended to be influenced by plane of nutrition during early pregnancy, as ewes offered diet L-EP tended (P = 0.085) to have a higher concentration of progesterone than H-EP ewes, with M-EP ewes being intermediate. There was no effect of diet in mid-pregnancy on plasma concentrations of progesterone (P > 0.05).
Effect of plane of nutrition of mature ewes during early and mid-pregnancy on plasma progesterone concentrations, foetal growth and placental development

Nutrition provided: low (L), medium (M) or high (H) as compared to predicted metabolisable energy requirements for maintenance; s.e.d. = standard error of difference.
a,b,cWithin a row, means without a common superscript letter differ (P<0.05).
*Significant at the 5% level, **significant at the 1% level, ***significant at the 0.1% level.
Foetal and placental development
At day 57 of gestation, cranial (P < 0.001) and abdominal (P < 0.01) diameters were smaller in foetuses of ewes offered diet L-EP than foetuses from ewes offered diet H-EP (Table 4). These differences disappeared during mid-pregnancy (P > 0.05). Dietary treatments during mid-pregnancy affected foetal development at day 80 of gestation, with M-MP foetuses having greater (P < 0.05) cranial dimensions than H-MP foetuses. There were no (P > 0.05) differences between early or mid-pregnancy diets in mean cotyledon diameter between days 57 and 80 of gestation.
Lamb behaviour data
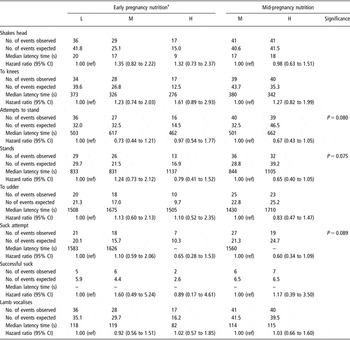
Plane of nutrition in early pregnancy had no effect (P > 0.05) on the frequency of presentation, the total duration or the latency of the lamb behaviours studied. However, plane of nutrition in mid-pregnancy tended to affect the frequency and affected the duration of the lamb behaviour ‘stands’, with lambs born from ewes offered diet M-MP presenting this behaviour more frequently (6.9 v. 5.1 times in 30 min; P = 0.070) and spending more time performing this behaviour (20.9% v. 13.6% of the observation period; P < 0.05) than H-MP lambs. With regard to latency of lamb behaviours (Table 5), lambs born from ewes offered diet M-MP tended (P = 0.080) to be quicker in attempting to stand for the first time than H-MP lambs. This was also observed for latency to the behaviour ‘stands’ with M-MP lambs tending (P = 0.075) to be quicker to stand successfully for the first time than H-MP lambs. Consequently, lamb latency to perform ‘suck attempt’ showed a similar tendency (P = 0.089) with M-MP lambs attempting to suck earlier than H-MP lambs.
Effect of plane of nutrition of mature ewes in early and mid-pregnancy on lamb latency to perform behaviours in the first 30 min after birth

Nutrition provided: low (L), medium (M) or high (H) as compared to predicted metabolisable energy requirements for maintenance.
– It was not possible to calculate median latency times if more than 50% of animals do not present the behaviour within the observation period.
†There was no statistical significance between treatments.
Ewe reproductive performance and parturition data
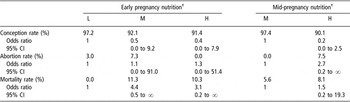
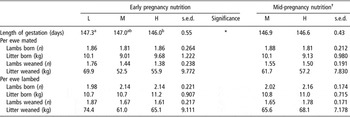
Conception rates were similar for all planes of nutrition in both early and mid-pregnancy with an average value of 94% (Table 6). Mortality and abortion rates for the ewes throughout the study were not affected by diets (P > 0.05). Gestation length was shorter (P < 0.05) for ewes offered diet H-EP than L-EP, with M-EP ewes being intermediate (Table 7). On a per ewe mated basis, the number of lambs born and reared per ewe was not affected by plane of nutrition in early or mid-pregnancy (P > 0.05). On a per ewe lambed basis, there was an interaction (P < 0.05) between early and mid-pregnancy. For ewes offered diet L-EP in early pregnancy, diet M-MP in mid-pregnancy resulted in higher number of lambs reared (2.06) compared with diet H-EP (1.68). In contrast, for ewes offered diets M- or H-EP in early pregnancy, diet H-MP in mid-pregnancy resulted in higher number of lambs reared than diet M-MP.
Effect of plane of nutrition of mature ewes in early and mid-pregnancy on conception, abortion and mortality rates

Nutrition provided: low (L), medium (M) or high (H) as compared to predicted metabolisable energy requirements for maintenance.
†There was no statistical significance between treatments.
Effect of plane of nutrition of mature ewes in early and mid-pregnancy on length of gestation, prolificacy and lamb output

Nutrition provided: low (L), medium (M) or high (H) as compared to predicted metabolisable energy requirements for maintenance; s.e.d. = standard error of difference.
a,bWithin a row, means without a common superscript letter differ (P<0.05).
*Significant at the 5% level.
†There was no statistical significance between treatments.
Lamb viability and performance
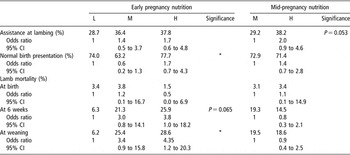
The amount of assistance required at lambing tended (P = 0.053) to be influenced by mid-pregnancy nutrition, with lambs born from ewes offered diet M-MP requiring less assistance than H-MP lambs (Table 8). Normal lamb birth presentations were reduced (P < 0.05) in the delivery of lambs born from ewes offered diet M-EP compared with L-EP or H-EP lambs. There was a tendency (P = 0.065) for lower incidence of lamb mortality from birth to weaning (3 and 6 weeks) with L-EP lambs. At weaning, lambs born from dams offered diet M-EP and H-EP presented higher (P < 0.05) mortality rates than L-EP lambs. Mid-pregnancy nutrition had no effect on lamb mortality (P > 0.05).
Effect of plane of nutrition of mature ewes in early and mid-pregnancy on lambing ease, birth presentation and mortality rate

Nutrition provided: low (L), medium (M) or high (H) as compared to predicted metabolisable energy requirements for maintenance.
*Significant at the 5% level.
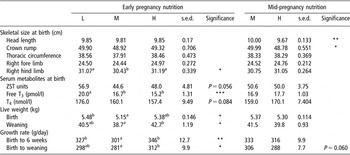
Lambs born from ewes offered diet L-EP were heavier (P < 0.05) at birth than M-EP lambs, with H-EP lambs being intermediate (Table 9). In addition, blood biochemistry 24 hpost partum was affected by EP feeding, with lambs born from ewes offered diet L tending to have higher (P = 0.056) immune status (ZST units), tending to have higher (P = 0.084) levels of T4, and having higher (P < 0.001) free T3 levels than lambs born from ewes offered diet M-EP or H-EP. Mid-pregnancy nutrition had no effect on these parameters (P > 0.05). Head, crown rump, fore limb length and thoracic circumference of the lambs were not influenced by plane of nutrition during early pregnancy (P > 0.05). However, hind limb length (P < 0.05) of lambs born from ewes offered diet L-EP and H-EP were longer than hind limbs of M-EP lambs. When examining the effects of mid-pregnancy feeding, the head (P < 0.01) and crown rump (P < 0.05) length of lambs born from ewes offered diet M-MP were longer than H-MP lambs.
Effect of plane of nutrition of mature ewes in early and mid-pregnancy on lamb parturition, birth weight and performance to weaning

Nutrition provided: low (L), medium (M) or high (H) as compared to predicted metabolisable energy requirements for maintenance; s.e.d. = standard error of difference.
a,bWithin a row, means without a common superscript letter differ (P<0.05).
*Significant at the 5% level, **significant at the 1% level, ***significant at the 0.1% level.
Plane of nutrition in early pregnancy affected lamb growth rates from birth to 6 weeks with lambs born from ewes offered diets H- and L-EP having greater (P < 0.01) growth rates than lambs born from ewes offered diet M-EP (Table 9). From birth to weaning, lambs born from ewes offered diet H-EP had greater (P < 0.05) growth rates than M-EP lambs, with L-EP lambs being intermediate. Consequently, lambs born from ewes offered diet H-EP were heavier (P < 0.01) at weaning than L- and M-EP lambs. With regard to plane of nutrition in mid-pregnancy, treatment M-MP tended to produce lambs with greater (P = 0.060) growth rates than treatment H-MP.
Discussion
Early pregnancy nutrition
In the present study, nutritional treatments during early pregnancy had no effect on pregnancy rate. This may be related to the nutritional status of the ewes at mating. Improvements in embryo survival of mature ewes offered a high level of nutrition in early pregnancy have been reported when ewes were in poor body condition at mating (<2.5) (reviewed by Robinson, Reference Robinson1986). The initial mean body condition score at the start of the present study was 3.8, regarded as a ‘very good’ body condition for mating (Russel et al., Reference Russel, Doney and Gunn1969), which would secure high ovulation rates (Robinson et al., Reference Robinson, Rooke and McEvoy2002), thus minimising the effect of this component on the resulting fertility. Additionally, post mating high feed intakes have been associated with decreased pregnancy rates and litter sizes through the reduction of blood progesterone to concentrations that compromise embryo survival (reviewed by Robinson et al., Reference Robinson, Rooke and McEvoy2002). Progesterone affects embryo survival through the control of maternal secretion of nutrients, growth factors and enzymes required for embryo development and maintenance of pregnancy (reviewed by Ashworth, Reference Ashworth1995). Parr et al. (Reference Parr, Davis, Miles and Squires1993) proposed that increased feed intakes are associated with an increased metabolic clearance rate of progesterone, due to increased blood flow to the gut and liver. An inverse relationship between maternal nutrition and peripheral progesterone concentration has been described in mature ewes (Parr et al., Reference Parr, Cumming and Clarke1982; Williams and Cumming, Reference Williams and Cumming1982). In the current study, despite the fact that there were no differences in conception rates of mature ewes, plasma progesterone concentrations at day 42 of gestation tended to be lowest for ewes offered high plane diets in early pregnancy. Previous work has indicated that plane of nutrition affects fertility of adolescent but not mature ewes (Annett and Carson, Reference Annett and Carson2006). The apparent reduced sensitivity to low peripheral progesterone concentrations in mature ewes may be related to the overall mean level of the hormone. Parr et al. (Reference Parr, Davis, Fairclough and Miles1987) proposed a progesterone threshold for satisfactory conception of 2 ng/ml on day 12 of gestation, although the highest conception rates were obtained for progesterone concentrations of 4 to 5 mg/ml. Therefore, while in the current study overfeeding mature ewes in early pregnancy decreased their progesterone concentrations, the level of the hormone remained higher than the threshold.
In the current study, foetuses carried by ewes offered low plane diets during early pregnancy were smaller at day 57 of gestation than foetuses carried by ewes offered medium or high plane diets. However, growth retardation effects rapidly reverted under the influence of mid-pregnancy diets, confirming that embryos were capable of compensatory growth. At birth, lambs born from ewes offered low plane diets in early pregnancy were heavier than medium plane lambs, with high plane lambs being intermediate. Additionally, lambs born from ewes on low and high plane diets had longer right hind limbs than lambs from ewes offered medium plane diets. The direct effect of nutrition on embryo growth has been previously reported. Parr et al. (Reference Parr, Cumming and Clarke1982) observed a reduction in the size of 35-day embryos collected from ewes restricted (0.25 M) from mating, compared with ewes offered a maintenance diet. Similarly, foetuses from ewes offered either 0.5 or 1.5 M from day 1 to day 35 of gestation had foetal size differences still evident at day 90 of gestation but no differences between lambs at birth, suggesting that foetuses were capable of compensatory growth during mid- to late pregnancy (Parr et al., Reference Parr, Williams, Campbell, Witcombe and Roberts1986). This demonstrates that even in the early stages of embryonic life, when direct nutrient requirements for conceptus growth are negligible (Robinson et al., Reference Robinson, Sinclair and McEvoy1999), maternal dietary intake still exerts direct influences. However, if the food restriction is removed by day 40 of gestation the effects appear to be temporary and not detectable at birth. These findings contrast with the results obtained by Annett and Carson (Reference Annett and Carson2006) in a study under similar conditions. The three same planes of nutrition (0.6 M, 1 M and 2 M) were imposed from day 2 to day 30 of gestation in mature ewes. The authors found no effect of plane of nutrition on lamb birth weight but they did observe differences in lamb skeletal size. The development of specific foetal tissues (long bones of the hind limbs) were sensitive to nutrition in early pregnancy, with lambs born from dams offered 0.6 M having shorter limbs than those from 2 M dams, an observation that only became evident after day 80 of gestation and remained until birth. These contrasting results may be explained by the mid- and late pregnancy feeding regimes imposed by each study. In the study by Annett and Carson (Reference Annett and Carson2006), low plane ewes remained lighter to term, compared with high plane ewes. This sustained constriction may not have given the developing foetus the opportunity to compensate for early pregnancy restriction, thus explaining the differential effects found at birth.
In the present study, the progeny of ewes offered low plane diets in early pregnancy were associated with higher immune status (ZST units), higher free T3 and higher T4 concentrations 24 h after birth, than the progeny of ewes offered medium or high plane diets, regardless of mid-pregnancy nutrition. Production of colostral IgG by the ewe during the first 18 h after parturition has a direct and positive association with the total amount of colostrum produced in the same period of time (O’Doherty and Crosby, Reference O’Doherty and Crosby1997). Although colostrum yield and composition was not measured in the current study, there is little indication from the ewe LW and BCS data, that ewes offered the low plane diet in early pregnancy would have a greater colostrum production compared with dams offered the medium or high plane diets, as they received the same diet during late pregnancy, a period which greatly determines mammary development and colostrum production (Robinson, Reference Robinson1983). These results may more likely be associated with the lamb’s efficiency to absorb colostrum. Pre-programming in utero effects on the absorption rate of colostral antibodies have been described previously by Boland et al. (Reference Boland, Callan, Brophy, Quinn and Crosby2006) when evaluating the effect of mineral supplementation of ewes during the last 6 weeks of gestation. Further research is required to confirm the causal component of these findings and to identify the mechanisms by which they act.
With regard to thyroid hormone concentrations, the results of the current study are somewhat at variance with previous findings by Rae et al. (Reference Rae, Rhind, Kyle, Miller and Brooks2002) who reported that mean T3 concentrations were significantly lower in both the maternal and foetal plasma, of ewes offered low plane diets (50% estimated ME requirements) compared with animals offered maintenance diets (100% requirements) from mating to day 119 of gestation, with no differences in circulating T4 concentrations. These contrasting results may be influenced by the stage of development of the offspring at the time of assessment and by the length and/or severity of the feeding regime utilised in each study.
In the present study, the blood biochemistry data reported for lambs born from ewes offered low plane diets in early pregnancy (higher ZST, free T3 and T4 serum concentration) were associated with decreased lamb mortality from birth to weaning. Lambs that survived the lactation period had higher concentrations of these parameters at birth than those that died. The improved lamb survival observed was not related to improved lamb behaviour at parturition. The reduced incidence of mortality observed may be associated with the longer gestation length observed for ewes on the low plane of nutrition during early pregnancy as this may have resulted in a physiologically more mature lamb at parturition than high plane lambs, although they had similar birth weights. Gestation length reductions have been described previously by Holst et al. (Reference Holst, Killeen and Cullis1986) and Wallace et al. (Reference Wallace, Milne and Aitken2005); however, these authors imposed their nutritional treatments only during mid-pregnancy or throughout gestation, respectively. Further research is needed to understand the mechanism underlying this result.
The greater growth rates to weaning observed for the offspring born from ewes offered high plane diets during early pregnancy was associated with these ewes losing significantly more body weight during the lactation period than ewes offered low or medium plane diets. These findings are likely to be determined by the close relationship existent between milk yield of the ewe and the growth rate of her lambs (Robinson, Reference Robinson1985).
Mid-pregnancy nutrition
In the current study, plane of nutrition in mid-pregnancy had a significant effect on foetal development measured at day 80 of gestation with foetuses from ewes offered medium plane diets having greater cranial diameters than foetuses from ewes offered high plane diets. Furthermore, at birth, lambs born from ewes offered medium plane diets had longer head and crown-rump lengths, although there were no differences in birth weight. This is consistent with results reported by Heasman et al. (Reference Heasman, Clarke, Firth, Stephenson and Symonds1998) when feeding ewes to meet either half or twice their maintenance energy requirements between day 30 and day 80 of gestation. The authors found that level of nutrition in early and mid-pregnancy not only influenced placental development in sheep, but also affected foetal conformation at term, where lambs delivered from ewes subject to restriction had significantly longer crown-rump lengths compared with controls, without differences in birth weights. This type of foetal programming effect has also been described in human babies (Barker, Reference Barker1994). This is in agreement with Heasman et al. (Reference Heasman, Clarke, Stephenson and Symonds1999) who, in reviewing several data sets, reinforced the recommendation by the Meat and Livestock Commission (1983) that, for mature ewes of body condition at mating of 3.5, a mild degree of under-nutrition from day 30 to day 90 of gestation, leading to the gradual loss of half a unit of condition score, enhances placental and foetal growth. For those in poor body condition, the effect is the opposite (quoted from Robinson et al., Reference Robinson, Rooke and McEvoy2002).
In the present study, ewes offered medium plane diets during mid-pregnancy tended to require less assistance at lambing than ewes offered high plane diets, despite lambs from ewes offered medium planes of nutrition having a larger skeletal size at birth. These results contrast with a study by Dwyer et al. (Reference Dwyer, Lawrence, Bishop and Lewis2003), who found that ewes exposed to a moderate (35%) nutritional restriction from week 4 of gestation onwards, had a higher incidence of malpresented lambs and required more assistance with the delivery. However, the authors were dealing with primiparous animals that are known to perform poorly at parturition compared with mature ewes (O’Connor et al., Reference O’Connor, Lawrence and Woodgush1992), and also, the restriction period for the study was extended throughout gestation, resulting in lambs with low birth weights and impaired postnatal survival.
Standing and suckling quickly have been related to improved survival rates in lambs (Dwyer et al., Reference Dwyer, Lawrence and Bishop2001). In the current study, lambs born to mothers offered medium plane diets in mid-pregnancy tended to have a quicker progression to stand and to attempt to suckle than lambs from dams offered high plane diets. However, this was not associated with differences in lamb survival. Furthermore, the behavioural tendencies described were not associated with differences in lamb birth weight as it has been earlier reported by Dwyer et al. (Reference Dwyer, Lawrence, Bishop and Lewis2003). However, the lambing assistance required at parturition by ewes offered high plane diets may have affected the latency of lamb neonatal behaviours, as behavioural retardation may be a consequence of lamb birth difficulties (Dwyer et al., Reference Dwyer, Lawrence, Brown and Simm1996).
Nevertheless, despite that ewes offered high plane diets in mid-pregnancy had higher body weights and condition pre-lambing than ewes offered medium plane diets and hence, the highest capacity to sustain milk production during lactation, lamb growth rates to weaning in the current study, tended to be greater for lambs born from dams offered medium compared with high plane diets. The beneficial tendencies observed for offspring performance may be due to lamb foetal programming effect, when moderately under-nourishing mature ewes during mid-pregnancy.
In the present study, the highest number of lambs weaned was a result of a low plane of nutrition in early pregnancy followed by a medium plane of nutrition in mid-pregnancy. This finding appears to be the result of the cumulative benefits obtained during the study from the two main effects: low plane diets in early pregnancy and medium plane diets in mid-pregnancy.
Conclusion
Ewe changes undergone to compensate for nutrient shortage or allowance during early to mid-pregnancy have the potential to alter the performance of the offspring. A low plane of nutrition in early pregnancy was associated with lambs with improved immune status, higher growth rates and reduced mortality to weaning. A medium plane of nutrition during mid-pregnancy was associated with increased foetal growth and a larger skeletal size at birth. The number of lambs weaned was highest when ewes were offered a low plane of nutrition in early pregnancy followed by a moderate plane of nutrition in mid-pregnancy. Thus, for mature ewes in good body condition at mating, nutrient restriction up to day 40 of gestation has the potential of improving lamb viability and survival, provided the ewe has an opportunity to compensate during mid- and late pregnancy nutrition.
Acknowledgements
The authors thank D. McBride at Ulster Hospital for thyroid hormone analysis. Also, D. Irwin, E. Doyle and J. Wilson from AFBI-Hillsborough for technical assistance and the laboratory staff at the Veterinary Science Division for the laboratory analyses. This study was supported by Programme Alβan, the European Union Programme of High Level Scholarships for Latin America, scholarship No. E04D047780CL and the Department of Agriculture and Rural Development of Northern Ireland.