Implications
This manuscript could have implications on the future biosecurity status of pig herds. It shows that there is still room for improvement in the biosecurity status in the four EU countries studied. Furthermore it shows that relevant associations exist between the level of biosecurity and production parameters. The found associations are of interest to farmers, since for example, an improved biosecurity level was associated with more weaned piglets per sow per year which is economically beneficial. We also show a lower proxy for disease incidence related with a higher biosecurity status. Furthermore with these results herd advisors and policy makers will also have tools to inform farmers of the importance of a good biosecurity level.
Introduction
Biosecurity is the term used in (veterinary) medicine to describe measures to prevent pathogens from entering farm premises or a group of animals (external biosecurity) or the spreading of pathogens within farm premises or groups of animals (internal biosecurity) (Amass and Clark, Reference Amass and Clark1999).
The Food and Agriculture Organization of the United Nations (FAO) describes biosecurity to be of direct relevance to the sustainability of agriculture, food safety and the protection of the environment (Food and Agriculture Organization of the United Nations – Committee on Agriculture, 2003). Biosecurity measures are of great importance to prevent or limit the risk of animals becoming infected with pathogens (Amass and Clark, Reference Amass and Clark1999; European Commission, 2007; Maes et al., Reference Maes, Segales, Meyns, Sibila, Pieters and Haesebrouck2008; Fraile et al., Reference Fraile, Alegre, López-Jiménez, Nofrarías and Segalés2010; Nöremark et al., Reference Nöremark, Frössling and Lewerin2010; Lambert et al., Reference Lambert, Arsenault, Poljak and D’Allaire2012; Laanen et al., Reference Laanen, Persoons, Ribbens, de Jong, Callen, Strubbe, Maes and Dewulf2013). A reduction in the risk of contracting an infection might lead to the reduced necessity of (antimicrobial) treatment of the animals (Laanen et al., Reference Laanen, Persoons, Ribbens, de Jong, Callen, Strubbe, Maes and Dewulf2013). Reduced and prudent usage of antimicrobials in livestock production is a hot topic in the media, politics and science nowadays, mainly in relation to public health. A reduced need for antimicrobials meets the requests for reduced antimicrobial usage (European Commission, 2011) and mitigated antimicrobial resistance (Chantziaras et al., 2013).
The level of biosecurity of a certain herd can be assessed by interviewing the farmer regarding biosecurity practices and collecting data by visual inspection. The risk-based weighted biosecurity scoring system (Biocheck.UGentTM) translates questions regarding biosecurity into a score for a herd for its internal, external and overall biosecurity status. This score aims at providing an objective, comprehensive and quantitative description of the level of biosecurity and can be used to inform the farmer on possible areas for improvements, and to compare his/her biosecurity level with that of other farms/herds. Combining the results of several farms may provide an overall idea of the level of biosecurity in a certain region or country (Ghent University, 2010; Laanen et al., Reference Laanen, Beek, Ribbens, Vangroenweghe, Maes and Dewulf2010 and Reference Laanen, Persoons, Ribbens, de Jong, Callen, Strubbe, Maes and Dewulf2013; Backhans et al., Reference Backhans, Sjölund, Lindberg and Emanuelson2015).
Having a good insight into differences and similarities in the biosecurity level of pig herds is of great importance for the advice that can be given and legislation that might be developed in order to improve the biosecurity status of pig production in the EU and the subsequent lowered probability of introduction and spread of diseases.
Farmers are likely to be more motivated to implement biosecurity measures if such measures can be expected to be beneficial for their farm performance (Casal et al., Reference Casal, De Manuel, Mateu and Martín2007; Valeeva et al., Reference Valeeva, van Asseldonk and Backus2011; Laanen et al., Reference Laanen, Maes, Hendriksen, Gelaude, De Vliegher, Rosseel and Dewulf2014), yet there is limited quantitative data available to link biosecurity and production parameters (Amass and Clark, Reference Amass and Clark1999; Laanen et al., Reference Laanen, Persoons, Ribbens, de Jong, Callen, Strubbe, Maes and Dewulf2013). Especially studying these relationships on the basis of multiple country data has not been done before.
Therefore, the aim of this study was to gain insight into the biosecurity status of farrow-to-finish herds in four European countries and to study associations with production and management characteristics. The results of this study will be used by the MINAPIG consortium to study the improved implementation of biosecurity measures as an alternative to antimicrobials in pig production.
Material and methods
Herd selection
The study aimed to include 60 farrow-to-finish herds with ⩾100 sows present at any given time and ⩾500 finishers in the four participating countries; Belgium, France, Germany and Sweden. In Belgium an email list of pig farmers subscribing to a newsletter issued by the faculty of veterinary medicine of Ghent University was used. Only farms in the Dutch speaking part of the country (Flanders) were selected. Flanders represents 90% of the pig production in Belgium (VILT – VLaams Infocentrum Land- en Tuinbouw, 2010). In Germany consultancy circles for pig farmers, combined with input from veterinary practices was used to select the herds. The herds were located in the regions Mecklenburg-Vorpommern, Niedersachsen and Nordrhein-Westfalen. These three regions represent ~64% of the total pig production in Germany (Statistisches Bundesamt, 2014). In France, from a database with names and addresses from the French Institute for pig and pork industry, farms located in the north-west part, representing 75% of the country’s pig production, were randomly selected. In Sweden, the database with names and addresses of pig farmers affiliated to the Swedish Animal Health Service was used and the farmers were contacted by their herd veterinarian or a consortium partner with the request for participation.
Herd visit and interviews
The participating herds were visited by one and the same researcher per country in Belgium, France and Germany and by a researcher (n=2) or a veterinarian from the Swedish Animal Health Service (n=15) in Sweden. All interviewers received training in using a standardized method for data collection. Furthermore, the complete protocol was developed in a way that similar methods of data entry could be guaranteed. Consultation of and discussion between the project partners assured the completeness and accuracy of the herd visit protocol.
Herds were visited between December 2012 and December 2013. The interviewer completed a farm inspection together with the farmer and the questionnaire was also completed during the visit. The information on herd management and technical parameters corresponded to the year preceding the herd visit.
Data collection
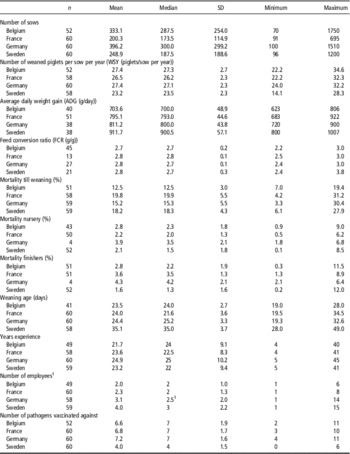
The data collected on the farms consisted of technical parameters (e.g. number of weaned piglets per sow per year (WSY), mortalities and average daily weight gain (ADG), see Table 1) and herd management information (e.g. gender of the responsible person in different age units, farrowing rhythm, vaccination protocol, see Table 2). The technical parameters were collected from the herd management system if available, the herd management information by interviewing the farmer. All information was first collected on paper and afterwards entered in an electronic platform.
General descriptive information of the participating herds regarding technical and management parameters

1 Employee=person involved in taking care of the pigs. A 0.5 employee was a halftime employee, that is, 2.5 employees refers to two fulltime employees and one half time employee.
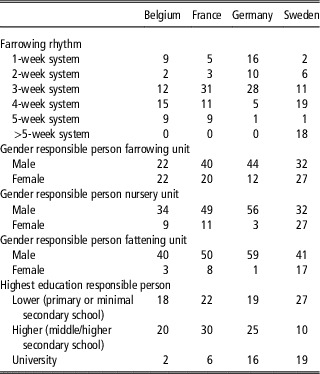
General information on the farrowing rhythm of the participating farms and gender and education information of the farmers

The farrowing rhythm of the herds (i.e. the interval, expressed in weeks, between the births of two batches of piglets) ranged between a 1-week system (every week a group of sows farrows) and 5-week systems for Belgium, France and Germany. In Sweden, farrowing rhythms exceeding 5 weeks were common. These were clustered into one category named ‘>5’.
The education level of the responsible person was categorised as being ‘lower’ (i.e. basic as in only primary school and lower as in minimal secondary education in the protocol), ‘higher’ (i.e. middle or higher level secondary education) or a having a ‘university’ degree.
The number of pathogens vaccinated against was obtained by summing the number of the vaccines (for all animal categories) used as a preventive measure against a certain pathogen. Combination vaccines were calculated separately for the respective pathogens they target.
Information on estimates of how common treatments against certain disease symptoms were, as a proxy for disease incidence, was also collected per animal category. For the sucklers, weaners and fatteners there were five predefined disease symptom categories; lameness, gastro-intestinal, respiratory, nervous, skin problems. For sows the symptoms mastitis and reproductive disorders were added to this list. For each of the symptoms the farmers were asked to assess how common treatments (e.g. with antimicrobials, anti-inflammatory products, probiotics, electrolytes, …) were applied to the animals on a 5-category-scale, where 1 was equal to never, 2 was rarely, 3 occasionally, 4 regularly and 5 commonly/always. Guidelines for the interpretation were not provided since the 5-category-scale was considered to be self-explanatory.
Biosecurity quantification
To quantify the biosecurity status in a reproducible and validated way, we used the publically available and previously described biosecurity assessment tool ‘Biocheck.UGentTM’, developed by Ghent University, Belgium (Ghent University, 2010; Laanen et al., Reference Laanen, Beek, Ribbens, Vangroenweghe, Maes and Dewulf2010 and Reference Laanen, Persoons, Ribbens, de Jong, Callen, Strubbe, Maes and Dewulf2013). This risk-based scoring tool, consisting of in total 109, mainly di- or trichotomous (yes, no/always, sometimes, never), questions, provides a score for internal and external biosecurity. Both internal and external biosecurity are further subdivided into six sub-categories each, with 2 to 13 questions per sub-category. For internal biosecurity these subcategories are; (1) disease management, (2) farrowing and suckling period, (3) nursing unit, (4) fattening unit, (5) measures between compartments, (6) working lines. External biosecurity is subdivided into; (1) purchase of breeding pigs, (2) purchase of piglets, (3) artificial insemination, (4) transport of animals, (5) feed and water supply, (6) removal of manure and dead animals. In the scoring system, every answer is translated into a score with absence of the biosecurity measure always resulting in score of 0 and presence of the measure varying in a score between 0.5 and 10 dependent on the importance of the measure. Furthermore the sub-categories have specific weight factors, again depending on their assessed relative importance for disease prevention (see supplementary data in Laanen et al. (Reference Laanen, Persoons, Ribbens, de Jong, Callen, Strubbe, Maes and Dewulf2013)). Finally the Biocheck.UGentTM scoring system provides a score for each subcategory as well as separate scores for internal and external biosecurity each time ranging from a minimum equal to 0 indicating total absence of biosecurity measures and a maximum 100 indicating full application of all described biosecurity measures. The total biosecurity score of the herd is calculated as the average over the internal and external biosecurity score.
Statistical analysis
Differences between countries in the overall, internal and external biosecurity score, the 12 sub-categories of biosecurity and farm characteristics were assessed using ANOVA with Scheffé’s method for post hoc comparison. If normal distribution and equality of variance could not be guaranteed, a nonparametric, two-sided, independent samples Kruskall–Wallis test was performed. Correlation between the internal biosecurity score and the external biosecurity score was expressed by using the two-way Pearson correlation coefficient.
For the analyses of associations between the biosecurity scores and the herd characteristics and technical results (i.e. from herd management data and questionnaire: number of sows, WSY, ADG (g/day), mortality till weaning (%), mortality of finishers (%), farrowing rhythm, weaning age (days), years of experience of the farmer, highest education level of the responsible person/farm manager, number of pathogens vaccinated against, number of employees and gender), first a causal path was designed based on the authors logical reasoning, including all possible associations between two variables and centering around both the internal and external biosecurity scores. Based upon the potential association described in this causal pathway, univariable analyses were performed with the variable where the arrow pointed towards as dependent variable. All analyses were corrected for the country effect by adding country as a fixed factor to correct for country-specific characteristics.
Those variables with univariable P-values of <0.20 were retained for further analysis in a multivariable model. Subsequently, with univariable associations that were retained, a multivariable general linear model was constructed using the stepwise backward selection procedure, including testing of two-way interactions of significant main effects. We checked for confounding effects during modelling by evaluating changes in parameter estimates. The association was considered significant if P<0.05. Normal probability tests and plots were examined to check whether the assumptions of normality and homoscedasticity of the residuals were fulfilled and no deviations from the assumptions were identified besides that a LOG transformation for the number of sows was required.
To investigate the link between the estimated frequency of treatment against certain disease symptoms as a proxy for disease incidence and the biosecurity level, the sum of the scores (never equals score 1; commonly/always equals score 5) per animal category was used as the dependent variable. Since for the sucklers, weaners and finishers the number of categories of disease symptoms was five and a 5-category-scale was used, the possible outcomes of this sum ranged from 5 till 25. For the sows seven categories of symptoms were described, leading to a range of 7 till 35. This sum was used as a dependent variable in a univariable linear regression model to examine associations between this parameter and the biosecurity level of a herd.
All statistical analyses were performed using SPSS statistics 22 (IBM).
Results
Farm selection and characteristics
Finally 52 participating herds in Belgium and 60 in each of the other three countries were included in the study, there were no non-responders or drop-offs. Our criterion of ⩾100 sows had to be lowered to ⩾70 sows to reach the maximum of participating herds. Three Belgian herds, six French herds and one Swedish herd had a number of sows between 70 and 100.
The characteristics of the participating herds are described in Table 1 while general information on the farrowing rhythm of the participating farms and gender and education information of the farmers is provided in Table 2.
The number of sows present on the farms was skewed to the right and therefore a LOG transformation of the data was performed for the statistical analyses.
The weaning age was on average 27 days (range 19 to 49) for the 232 herds, but this was highly influenced by the fact that Sweden showed a higher weaning age (Table 1). The number of WSY (number of weaned piglets per sow per year) was comparable in Belgium, France and Germany, but in general lower in Sweden. The mortalities showed large variation within the countries.
The farrowing rhythm showed that a 3-week batch system was most common in France and Germany, while in Belgium and Sweden a 4-week system was most common. In Sweden however, a large portion of the farms (32%) worked with a batch system >5 weeks.
The number of pathogens a vaccination was used against ranged from 0 (i.e. no vaccinations at all) till 11 (i.e. vaccines against 11 pathogens used on the farm).
Biosecurity in the different countries
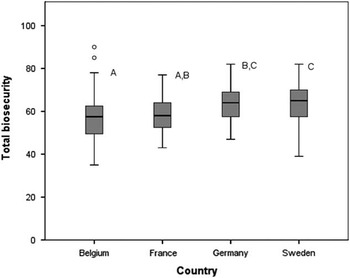
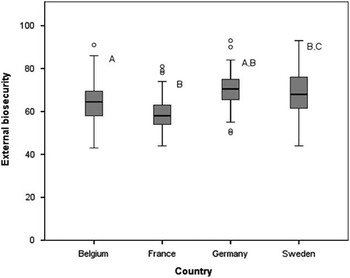
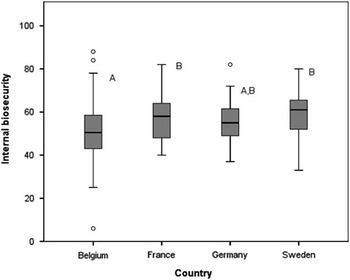
The biosecurity scores over all four countries showed a total biosecurity of 60.8 (residual standard error=8.9), with a higher score for external biosecurity (65.3, residual standard error=9.4) compared to the internal biosecurity (55.8, residual standard error=11.3). The boxplots per country for the total, external and internal biosecurity showed large variations between and within the countries (Figures 1, 2 and 3).
Boxplot for the total biosecurity score per country in farrow-to-finish pig herds. Letters A, B and C correspond to post hoc statistical tests. Different letters indicate a statistical significance difference (ANOVA) between the countries.

Boxplot for the external biosecurity score per country in farrow-to-finish pig herds. Letters A, B and C correspond to post hoc statistical tests. Different letters indicate a statistical significance difference (ANOVA) between the countries.

Boxplot for the internal biosecurity score per country in farrow-to-finish pig herds. Letters A, B and C correspond to post hoc statistical tests. Different letters indicate a statistical significance difference (ANOVA) between the countries.

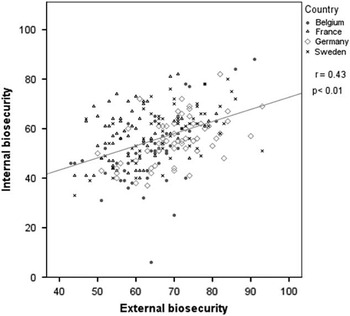
As shown in Figure 4, the internal and external biosecurity were positively correlated (R=Pearson r=0.43; P<0.01).
Link between internal and external biosecurity scores in farrow-to-finish pig herds. The dark line represents the fitted line for the association over all combined data. The different countries are represented by different markers.

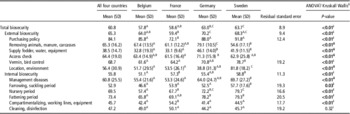
The external biosecurity subcategory ‘purchasing policy’ scored high with an average score of 84.1 (range 30 to 100, SD=14.4), while ‘supply of fodder, water and equipment’ showed the lowest average score of 38.5 (range 0 to 90, SD 14.7). Scores for internal biosecurity were more in line with each other, with the highest average score for ‘management of diseases’ (x̄=60.8, range 0 to 90, SD=25.4). The lowest score was seen for ‘compartmentalization, working lines and equipment’ (x̄=45.7, range 0 to 100, SD=18.3). Detailed information on the biosecurity scores in general and per country is presented in Table 3. ‘Cleaning and disinfection’ was the only subcategory where no significant differences between countries were observed.
Biosecurity scores total and based on external and internal biosecurity and their specific sub-categories in farrow-to-finish herds in four countries

Scores generated by using the risk-based Biocheck.UGentTM scoring system (minimum score 0, maximum 100). Similar superscripts (A, B or C) indicate statistical equality, while different letters indicate statistical significant differences between countries. Bold values represent P-values for a country comparison based on an ANOVA test (superscript i) or Kruskal–Wallis test (superscript ii) in case equality of variance could not be assumed.
Link between biosecurity and farm characteristics
Due to an unbalanced distribution between males and females for gender of the responsible person for the nursery and fattening periods (many males and very few females), this variable was not included in the analysis. Only the gender of the responsible person in the farrowing unit was tested for its link with other relevant parameters.
The univariable analysis resulted in retaining several variables related with each other.
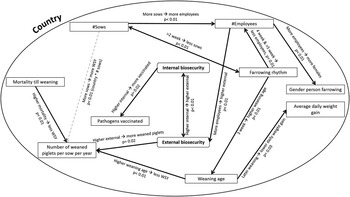
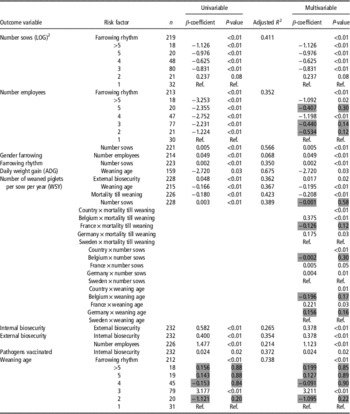
The different multivariable models, with outcome variables ‘number of sows (LOG)’, ‘number of employees’, ‘gender farrowing’, ‘education level’, ‘farrowing rhythm’, ‘daily weight gain’, ‘number of weaned piglets per sow per year’, ‘external or internal biosecurity’, number of pathogens vaccinated against’, ‘weaning age’ and ‘mortality till weaning’, corrected for the country effect, finally resulted in a total of 13 relevant associations linking the biosecurity levels with the before mentioned production and management parameters. These 13 associations are shown in the causal path in Figure 5 and in Table 4 significant associations between the before mentioned outcome variables and their risk factors are listed.
Causal pathway with statistical significant associations in the multivariable models between several herd management, production variables and internal and external biosecurity scores in farrow-to-finish pig herds. Gender person farrowing=gender of the person responsible for taking care of the pigs in the farrowing unit, #=number. Black lines represent the result of a multivariable linear regression analysis based on data from 4 EU countries. The light grey dashed line indicates a significant effect between these parameters only through interaction with country. The p-values correspond to the multivariable model. All models were corrected for the country effect by placing country as a fixed variable in the model, hence the circle around the figure.

Statistical results of univariable and multivariable general linear models for internal biosecurity score and herd characteristics in farrow-to-finish pig herds

LOG=log transformation.
Only associations significant (P<0.05) in the multivariable model are shown. The reference category for the analysis is indicated with ‘Ref.’ for categorical variables. In the multivariable model the P-values which are significant with P⩽0.05 and P>0.05 are shaded. Significant interactions are listed where applicable. All models were corrected for the country effect by adding country in the model as a fixed variable.
The number of sows positively influenced the number of employees (P<0.01) and number of weaned piglets per sow per year (P<0.01, country interaction). The number of sows and the farrowing rhythm were also associated, from a 2-week farrowing rhythm system onwards the number of sows was lower (P<0.01). The farrowing rhythm influenced the weaning age; a 3-week system had a higher weaning age. Furthermore herds where the farrowing rhythm was 4 weeks or ⩾5 weeks in general had less employees (P<0.01). More employees means as well that there were more often females responsible for the farrowing unit (P<0.01). The external biosecurity was positively influenced by the number of employees (P<0.01). Herds with a higher weaning age also had a lower ADG (P=0.03) and a lower number of weaned piglets per sow per year (P<0.01). The external biosecurity on the other hand positively influenced the WSY (P=0.02, Supplementary Figure S1), as did a higher number of sows (country effect), while a higher mortality resulted in less WSY. Finally external and internal biosecurity were associated with each other (P<0.01) and a higher internal biosecurity was associated with a higher number of pathogens vaccinated against (P=0.02).
Link biosecurity level – frequency of treatment against certain disease symptoms as a proxy for disease incidence
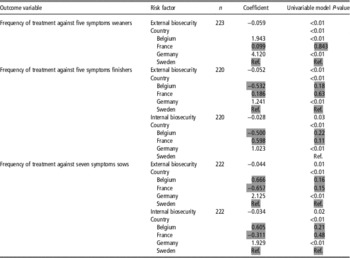
The sum of scores for estimated treatments given against certain disease symptoms was significantly associated with the internal biosecurity as well as the external biosecurity score for finishers (P=0.03; P<0.01) and sows (P=0.02; P=0.01). For the weaners the score was only significantly (P<0.01) associated with the external biosecurity. The association had a negative coefficient, indicating that a higher biosecurity was associated with a lower frequency of treatment for the different categories of disease symptoms (Table 5).
Significant (P<0.05) univariable country corrected general model results for the sum of the 5-point Likert scale results (1=never, 5=always) of the frequency of treatment against 5 (weaners, finishers) or 7 (sows) symptoms (lameness, gastro-intestinal, respiratory, nervous, skin problems, mastitis, reproductive disorders) per porcine animal category

The reference category for the analysis is indicated with ‘Ref.’
Discussion
Farm characteristics and study design
This study provides a first attempt to study and compare biosecurity practices in pig production in several European countries. Yet when interpreting the results, some caution is needed as this study, like any observational study, has some limitations. As the willingness to participate and share information by the farmer was an important selection criterion, it is likely that the participating farmers were representing the better end of the population, resulting in a possible selection bias. Since farmers were recruited in slightly different ways in the four countries this might have led to a participation bias as well.On the other hand the relative large number of herds included in each country enhances the representativeness.
Although our criterion of including herds with ⩾100 sows was not completely met (in total 10 farms had <100 sows), we were confident that our study was able to provide results which can be of interest for pig production in the participating countries. Participating herds were randomly selected within the regions in the four countries where the majority of pig production takes place. In Belgium there were ±5000 farms with sows in 2005, 34 000 in Germany, 11 000 in France and 2000 in Sweden (EUROSTAT, 2015). The differences in these numbers indicate that our sample of 52 (Belgium) and 60 (Germany, France and Sweden) only represents a small portion of total pig production in the four countries. The average herd size in our sampled herds (Belgium=333 sows/herd, France=200 sows/herd, Germany=396 sows/herd, Sweden=249 sows/herd) suggested that our sample population had higher numbers of sows compared to the national average herd sizes in the countries (Belgium=210 sows/herd in 2013 (Belgian FPS Economy, 2013), France=152 to 257 (depending on type of farm) in 2011 (SSP-Agreste, 2010), Germany=145 sows/herd in 2013 (German Federal Statistical Office, 2014) and Sweden=190 in 2013 (Statistics Sweden, 2014)). Via the number of employees a higher number of sows was associated with a higher external biosecurity, indicating that our sampled herds might represent the better end of the national population. The observation that the number of sows was positively correlated with the number of employees at the farm was believed to be a logical consequence of the increased workload by an increasing number of sows. Regarding the differences in weaning age and ADG we can state that in Sweden it is legally required to wean at 28 days minimum (Regeringskansliet Sweden, 1988), while in the other countries the weaning age is often lower. Council directive 2008/120/EC mentions an official weaning age of 28 days, but allows weaning at 21 days when certain minimal requirements are met (Council of the European Union, 2008). Furthermore, Sweden had a quite high ADG which is consistent with previous reports (Ingvar Eriksson, Reference Ingvar Eriksson2014).
Biosecurity in the different countries
The Biocheck.UGentTM system was proved by Laanen et al. (Reference Laanen, Beek, Ribbens, Vangroenweghe, Maes and Dewulf2010) to be a reliable and useful system in the comparison and quantification of the biosecurity status in Belgian pig herds. It also allows for objective comparisons of the biosecurity level between countries on an overall herd and pathogen level, whereas other available systems focus more often on a specific pathogen (e.g. American Association of Swine Veterinarians (AASV) (2007) and Wageningen University (2008). The results of this study clearly show that there is still room for improvement in the level of biosecurity in many pig herds in Belgium, France, Germany and Sweden. The large variation observed in the majority of the biosecurity subcategory scores in the different countries indicates that there were farmers who managed to adopt many more biosecurity measures compared with some of their colleague farmers.
The obtained biosecurity scores for Belgium were comparable to the results described by Laanen et al. (Reference Laanen, Persoons, Ribbens, de Jong, Callen, Strubbe, Maes and Dewulf2013), who carried out a study in Belgium in 2009 to 2010 using the same methodology (Biocheck.UGentTM). For the other participating countries there were no comparable data on the biosecurity status available, highlighting the importance of this study to get a first insight in the biosecurity level in several countries measured with a common tool.
The mutual low scoring subcategory for Belgium and France was ‘supply of fodder, water and equipment’ for external biosecurity. Often this is related to less structured farmyard logistics and the necessity for supplying companies to enter the premises and violating the ‘clean or herd-specific area’. Another important factor in this subcategory is the lack of regular chemical and microbiological testing of the water quality.
Furthermore, the results of the Biocheck.UGentTM scoring system do provide valuable information on the possible topics for improvement both at the country specific or overall level. For example, when looking at the standard deviation we noticed that mainly in the subcategory ‘vermin and bird control’ there was still room for improvement (x̄=68.7, SD=20.1), while for ‘purchasing policy’ there was less room for improvement (x̄=84.1, SD=14.4). A difference between countries, which might need country-specific advice, was for example seen for ‘management of diseases’ which scored low in Belgium (x̄=55.4, SD=21.6) and higher in Sweden (x̄=69.7, SD=27.2), with for both countries a high SD indicating that improvements at herd-level are still possible in both countries. For ‘location and environment’ we also noted a large variation, but this is a subcategory where interventions are generally more difficult to implement. For Belgium attention could be paid to the ‘farrowing and suckling period’ since the other countries show that higher scores for biosecurity can be obtained. Belgium, Germany and Sweden could also try to improve the subcategory ‘compartmentalization, working lines and equipment’, since results from the French herds show that this is possible. An interesting difference was also seen in the score for the ‘nursery period’, where Sweden was scoring higher and Germany also scored higher. The subcategory ‘nursery period’ is largely influenced by the high weight factor for the score for the maximum pig stocking density (Supplementary data in Laanen et al. (Reference Laanen, Persoons, Ribbens, de Jong, Callen, Strubbe, Maes and Dewulf2013)), which is lower in Sweden because of Swedish legislation (Regeringskansliet Sweden, 1988). The same applies, to a lesser extent, to the fattening period.
The higher external biosecurity score compared to the internal score could be explained by the idea that it is easier for a farmer to impose rules upon external visitors which are more related to external biosecurity in comparison to altering their own habits which are more related to internal biosecurity, which is in line with findings of Gunn et al. (Reference Gunn, Heffernan, Hall, McLeod and Hovi2008) and Laanen et al. (Reference Laanen, Persoons, Ribbens, de Jong, Callen, Strubbe, Maes and Dewulf2013). Another reason might be that farmers may be more aware of the risk of introduction of disease/pathogens from other herds or sources (Visschers et al., Reference Visschers, Backhans, Collineau, Iten, Loesken, Postma, Belloc, Dewulf, Emanuelson, Beilage, Siegrist, Sjölund and Stärk2015). However, the findings of this study suggest that improvement in both internal and external biosecurity was still possible in all countries since we observed a large range. The internal biosecurity might offer the best starting point for an improvement of the biosecurity status. (Laanen et al., Reference Laanen, Persoons, Ribbens, de Jong, Callen, Strubbe, Maes and Dewulf2013).
Link between biosecurity and farm characteristics
We identified and quantified associations between the level of biosecurity and farm characteristics and production parameters, but it should be stressed that these results were obtained in a cross-sectional study, which does not allow to identify causal relationships. However, by designing a likely causal path before executing the statistical analysis we tried to overcome part of this limitation. Since differences per country were likely to occur due to differences in cultures and habits, regulations, pig production structure, disease prevalence and external factors such as e.g. the presence of wild boars it was decided upon to include country as a fixed variable in all models to ensure correction for these effects.
The implementation of biosecurity measures can be considered as a proxy of overall herd management, therefore the observed associations could also be related to other herd factors as mentioned above. Although the information gathered on the production parameters and herd management were collected for the preceding year and the biosecurity status was measured at the moment of the herd visit, to our belief this did not influence the quality of the collected data.
Figure 5 shows that the internal biosecurity level associates with the level of vaccination (against how many pathogens was being vaccinated). This indicates that herds with a possible better understanding of the risks of transmission of disease within the herd tend to take more preventive measures such as improving their biosecurity status and ensure a good immunity status of the animals by vaccinating against a large number of pathogens.
The external biosecurity was linked to the number of weaned piglets per sow per year; a 10 point higher external biosecurity score resulted in our study in 0.2 piglets extra weaned in the multivariable model (Supplementary Figure S1).
Link between frequency of treatment against certain disease symptoms, as a proxy for disease incidence and biosecurity level
The estimated frequency of treatment against prelisted categories of disease symptoms was used as a proxy for the disease incidence in the studied herds. It should be noted however that this is a rough and subjective unit of measurement. However, the negative association found between the used parameter as a proxy for disease incidence and the level of biosecurity does suggest a lower level of disease in herds with better biosecurity indicating that indeed biosecurity could be seen as a tool for disease prevention as suggested before (Amass and Clark, Reference Amass and Clark1999; Maes et al., Reference Maes, Duchateau, Larriestra, Deen, Morrison and de Kruif2004; Casal et al., Reference Casal, De Manuel, Mateu and Martín2007; European Commission, 2007; Maes et al., Reference Maes, Segales, Meyns, Sibila, Pieters and Haesebrouck2007; Gunn et al., Reference Gunn, Heffernan, Hall, McLeod and Hovi2008; Brockhoff et al., Reference Brockhoff, Cunningham and Misutka2009; Brennan and Christley, Reference Brennan and Christley2012). The association was seen in relation with the internal biosecurity, which could be explained by the fact that part of the pre-listed symptoms, efor example lameness and skin problems, might be associated with management and pig-to-pig transmissible diseases by the farmer. On the other hand, the association with the external biosecurity could be explained by the reduced risk of introduction of disease, for example in the case of respiratory pathogens. A more thorough analysis of more detailed information on actual disease incidence or antimicrobial usage might provide more clear insights on these associations.
Conclusions
This cross-sectional study on 232 selected pig herds in Belgium, France, Germany and Sweden showed that there is substantial room for improvement in the biosecurity status in many herds. Belgium showed the lowest total and internal biosecurity score and France had the lowest external biosecurity score. Sweden had the highest scores for total and internal biosecurity and Germany the highest external biosecurity score.
Both the internal and external biosecurity scores were significantly associated with the country and each other.
Herds with more sows and subsequently more employees were likely to have a higher external biosecurity score. A higher external biosecurity score positively influenced the number of weaned piglets per sow per year and the internal biosecurity score. Other paths were also found relevant in the associations between herd management, production and biosecurity.
These results may be relevant in guiding pig farmers towards better biosecurity levels as a tool to achieve improved animal health and production.
Acknowledgements
The MINAPIG consortium would like to thank all participating farmers, their employees and herd veterinarians for their cooperation. The authors would also like to thank the MINAPIG consortium for their help in developing the protocol for this study. Boehringer Ingelheim is partner in the MINAPIG consortium, however they did not participate in the study design nor in the collection, analysis and interpretation of data, nor in the decision to submit the manuscript for publication.
Supplementary Material
To view supplementary material for this article, please visit http://dx.doi.org/10.1017/S1751731115002487