


Introduction
The damping of the Equator-to-Pole thermal gradient during mid-Cretaceous (120–90 Ma) remains a puzzling question. New sea-surface temperature (SST) measurements have shown that in Equatorial regions, SSTs were colder in the mid-Cretaceous than they are now (Reference Sellwood, Price and ValdesSellwood and others, 1994; Reference D’Hondt and ArthurD’Hondt and Arthur, 1996). On the other hand, there are now many measurements (Reference GordonGordon, 1973), including new reconstructions in the Arctic regions (Reference Herman and SpicerHerman and Spicer, 1996) that show that high-latitude temperatures were much warmer then than they are now. suggesting that high-latitude continents may have been ice free.
These recent analyses confirm the presence of a strong damping of the Equator-to-Pole thermal gradient. Such a dramatic change in global climate has to be explained by powerful changes in heat-transport processes by the atmosphere and ocean circulation. Using general circulation models (GCMs), Barron and associates have investigated the different causes that might result in such a damping (Reference Barron and WashingtonBarron and Washington, 1984, Reference Berner, Lasaga and Garrels1985; Reference Barron, Peterson, Pollard and ThomsonBarron and others, 1993,Reference Barron, Fawceett, Peterson, Pollard and Thompson1995).
The first reason that may explain the unvarying climate during the mid-Cretaceous is the change in sea-land distribution. Reference Barron and WashingtonBarron and Washington (1984) have shown, using a paleogeographic reconstruction of the mid-Cretaceous, that changes in sea land distribution have major consequences on atmospheric circulation, although they cannot explain the amplitude of the warming for high latitudes. More recently, Reference Valdes, Sellwood and PriceValdes and others (in press) have shown that, at least for North America, forcing the Universities Global Atmospheric Modelling programme (UGAMP) GCM with an accurate sea-land distribution (that accounts for the extension of the shallow sea over the northwestern part of the continent), induces an equable climate.
Another reason for increasing high-latitude temperatures in the mid-Cretaceous is the amount of CO2 in the atmosphere. Models that quadruple the present rate of CO2 production (Reference Barron, Washington, Sundquist and BroeckerBarron and Washington, 1985) have shown that CO2 increase has a considerable effect on high-latitude warming, but that it also enhances equatorial SSTs, which is inconsistent with the isotopic data (Reference Sellwood, Price and ValdesSellwood and others, 1994). Oceanic circulation also plays an important role in temperature distribution (Reference GordonGordon, 1973; Reference Rind and ChandlerRind and Chandler, 1991; Reference Barron, Peterson, Pollard and ThomsonBarron and others, 1993). Performing experiments sensitive to the amplitude of ocean-heat transport using an atmospheric GCM (AGCM) coupled with a mixed-layer ocean model, Reference Rind and ChandlerRind and Chandler (1991) have demonstrated the drastic consequences that variation in ocean circulation might have, and Reference Barron, Peterson, Pollard and ThomsonBarron and others (1993) have also shown the existence of an important damping of the Equator-to-Pole thermal gradient.
The aim of this paper is to assess these issues using a new AGCM and a different methodology from those already in use, and to quantify separately the impact of “tectonic forcing”, CO2 and SST changes, We will limit ourselves to analyzing the impact of these different forcing factors on temperature and the hydrologic cycle for high latitudes, and investigate whether these changes produce or inhibit the formation of ice caps.
Design of the Experiments and the Methodology
Description of the model
All the numerical experiments described in this paper were performed using the Laboratoire de Météorologie Dynamique (LMD) AGCM. This is a gridpoint model that uses an Arakawa C-grid (Reference Sadourny, Laval, Berger and NicolisSadourny and Laval, 1984). The standard resolution has 64 points regularly spaced in longitude, 50 points regularly spaced in latitude, and 11 vertical levels (4 in the boundary layer). Each horizontal gridcell has a constant area, corresponding to a cell of 400 × 400 km for mid latitudes. The vertical coordinate is the normalized pressure.
The radiation scheme is the same as that used in the European Centre for Medium-Range Weather forecasts (ECMWF) model: the solar element is a refined version of the scheme developed by Reference Fouquart and BonnelFouquart and Bonnel (1980), and the terrestrial component is attributable to Reference MoreretteMorcrette (1991). The boundary layer is parameterized using a diffusive equation where the mixing coefficients depend on a prescribed length scale and a diagnostic determination of turbulent kinetic energy. Condensation is parameterized separately for convective and non-convective clouds. Convection is parameterized using, in sequence, a moist adiabatic adjustment and a modified version of the Kuo algorithm.
A prognostic equation for cloud water is included in the model: sources and sinks of cloud-condensed water are parameterized, and the large-scale transport is taken into account. The main sink of cloud water is the precipitation process (Reference Le Trent, Li and ForichonLe Treut and others. 1994).
The main new features of our version of the model are the treatment of the surface, and of the surface atmosphere interaction. Our version includes a sub-grid representation of fractional sea-ice cover. A distribution between eight biomes, represents the type of vegetation for each cell. The surface scheme representing the hydrologic exchanges between the atmosphere and the biosphere is SECHIBA (Schématisation des Échanges Hydriques â I’Interface Biosphère Atmosphère; Reference Ducoudré and LavalDucoudré and Laval. 1993), Surface albedo is computed from measurements of snow depth, snow cover and age, and vegetation cover (Reference Chalita and Le TreutChalita and Le Trent, 1994).
Description of the Model
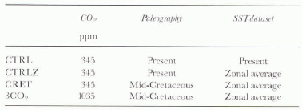
To quantify separately the climatic impact of each forcing factor, we have performed a set of four numerical simulations. The first is the simulation of present climate, and is referred to as CTRL. In order to be sensitive to paleogeo-graphical changes, we have to solve the “SST problem”. Since it is unrealistic as yet to use an ocean GCM (OGGM) to compute Cretaceous oceanic circulation (Reference Barron and PetersonBarron and Peterson, 1989), we have chosen to prescribe SST. Since there are gridpoints that are changing from land to ocean (and vice versa from the present paleogeography to the Cretaceous, we have performed an “intermediate” experiment. This simulation (referred to as CTRLZ) consists of computing the zonal mean of SST and albedo, and replacing it in the CTRL simulation. For the third stimulation, we keep the zonal average for SST and albedo, and modify the paleogeography to account for the Cactaceous land-sea distribution and orography. The third simulation is referred to as CRET The advantage of this method is that the zonal distribution of SST and albedo can be kept constant between the CTRLZ and the CRET simulations. As long as we only quantify the paleogeographic impact, this simulation allows us to separate it from other forcing factors. Its major disadvantage is that because of the prescribed SSTs, we only have the response of the atmosphere to changes in paleogeography. The final simulation comprises multiplying the CO2 partial pressure by a factor of 3 (increasing from 345 to 1035 ppm). This is referred to a 3CO2. For a synthesis of the simulations see Table 1.
Summary of the AGCM experiments
Results
By comparing CTRLZ and CTRL the impact of replacing the real distribution of SST and albedo by its zonal average can be seen. Similarly, comparing CRET and CTRLZ will allow the response of the AGCM to changes in sea land distribution and orography to be quantified. Finally, comparing 3CO2 and CRET, will allow the atmospheric response to the increase of CO2 to be assessed.
Analysis of the control run in zonal average
In Figure 1. the annual average surface temperature for CTRL, CTRLZ and the difference between them are plotted. Considering temperature, it is necessary to keep in mind that SSTs are prescribed for both experiments. For CTRL, we have used a 10 year average of the AMIP (Atmospheric Model Intercomparison Project) SST (1979–88). For CTRLZ, we have used the zonal average as described above. The main effect is that the zonal differences of the actual SSTs that exist in the present climate are lost. Regions where SSls are warmer than the zonal mean value, such as the warm pool in the Indian Ocean, the central and south Pacific and the north Atlantic (due to the Gulf Stream) appear colder in the CTRLZ-CTRL simulation. In contrast, regions colder than the zonal mean value, such as the central Atlantic and north Pacific, appear to be warmer in the CTRLZ-CTRL simulation. Another major change, which is due to changes in boundary conditions (see Table 1), is the drastic temperature increase over high latitudes for both hemispheres, due to the absence of sea ice in the CTRLZ run. This leads to a major albedo decrease and a severe warming(around 10°C).
Mean annual surface temperatures for the CTRL (top), CTRLZ (middle) and CTRLZ-CTRL (bottom) experiments. For CTRL and CTRLZ isotherms are drawn for −20,−10,0, 5, 10, 15, 20, 25 and 30°C. For the temperature differences (CTRLZ-CTRL), isotherms are drawn for −10, −5, −2.5, −1.1, 2.5, 5 and 10°C. Light-gray shading is used for a decrease > −5°C and dark gray for an increase of 5°C.
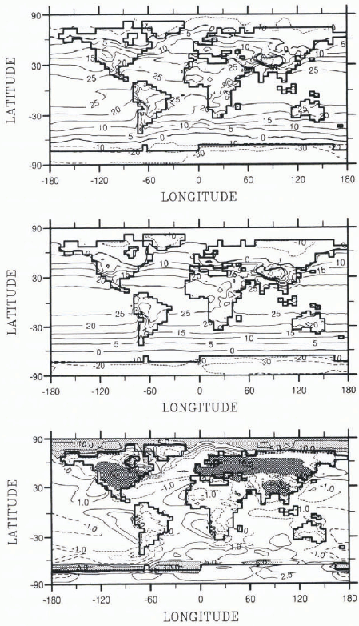
Over the continents, where the surface temperature is computed by the model, we observe a general cooling, except over Antarctica where the increase is clearly due to the fact that the ice-cap albedo effect was removed in the CTRLZ run and the albedo value was decreased to a snow-free land value. The cooling reached 5–10°C over Europe and central North America as a consequence of replacing the present SSTs by the zonal mean SSTs. Indeed, this change has a major impact on continental areas. First, it drastically decreases the Equator-to-Pole thermal gradient over the Northern Hemisphere (Fig. 1). Second, it damps the meridional circulation and decreases the strength of the Hadley cell (not shown). This is similar to what has been observed in doubling CO2 experiments: there is a weakening of the Hadley cell and of the meridional transport of heat when the Equator-to-Pole thermal gradient is reduced (Reference Le Trent, Li and ForichonLe Treut and others, 1994; Reference Ramstein, Le Treut, Sérafini, Foriehon and JoussaumeRamstein and others. 1996). Finally, the zonal circulation is enhanced and the Gulf Stream effect cancelled in CTRLZ, resulting in a cooling over Europe. The warmth of northern Europe compared to the colder temperatures of North America at the same latitudes in CTRL, does not exist anymore in CTRLZ (Fig. 1).
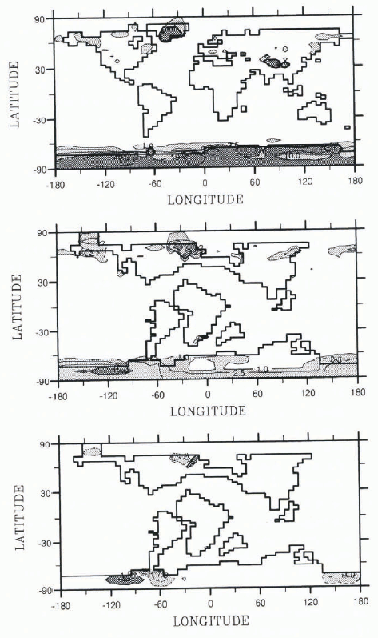
When mean annual snow depth is considered (Fig. 2), it can be observed that, despite the warming over Antarctica in the CTRLZ simulation, the temperatures are sufficiently cold to produce major ice caps there and in Greenland.
Annual mean snow depth for the CTRLZ (top), CRET (middle) and 3CO2-CRET (bottom) experiments. For the CTRLZ and CRET runs, isolines for snow depth of 1, 2.5, 5,10 and 20 m have been drawn, and light-gray shading has been used for depth >1 m and dark-gray shading for depth > 10 m. For the 3CO2-CRET run (bottom) light-gray shading represents a decrease of snow depth > −1 m and dark-gray shading an increase >1 m.
To conclude the first stage of the experiment, changing actual SSTs by zonal average SSTs and removing sea ice and ice sheets in the CTRLZ experiment allows the damping of the thermal gradient, especially for the Northern Hemisphere. However, complications arise in the cooling of mid-latitude continental areas.
The tectonic-forcing impact
Keeping the same zonal distribution of SSTs and albedo, we apply mid-Cretaceous topography to our AGCM (Reference Valdes, Sellwood and PriceValdes and others, in press). Results are shown in Figure 3. The main features are as follows: North America is linked with Europe, Australia is linked to Antarctica, but South America and Africa become separated by the Atlantic Ocean opening. India is an island in the Southern Hemisphere, The sea level is >200m higher, and the emerged land area decreases by 15%.
Paleogeography for the mid-Cretaceous interpolated on the AGCM grid. Light-gray shading represents land below 500 m, dark-gray shading is land 500–1500 m, and black is land > 1500m.

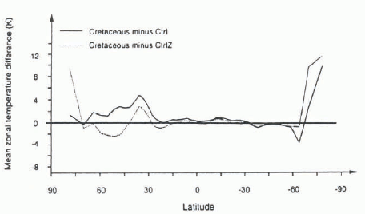
The annual mean surface temperature for the mid-Cretaceous is shown in Figure 4. The orographic impact is clear over South America, southern Africa and southeastern Asia. For high latitudes in the Southern Hemisphere (particularly over Antarctica), there is a net wanning of 10°C. By contrast, there is no change over the high-latitude areas of the Northern Hemisphere, because during the Cretaceous period there was little land at high latitude. Nevertheless, for both hemispheres, the temperatures are not warm enough to prevent the formation of ice caps. To provide a better idea of the changes in surface temperatures, Figure 5 shows the zonal average annual mean surface-temperature differences between CRETand CTRLZ, and CTRLZ and CTRL. Except for Antarctica, the major change between CTRLZ and CRET takes place over the mid-latitudes of the Northern Hemisphere where the warming reaches 4°C. Global warming is 1.3°C. Comparing our results with those of Reference Barron and WashingtonBarron and Washington (1984), the warming accountable specifically to paleogcography is, in both simulations, not sufficient to inhibit ice-cap development at high latitudes. The fact that we produce a smaller degree of warming than Reference Barron and WashingtonBarron and Washington (1984) (1.3 instead of 2.5°C) is mainly due to the fact Barron and Washington use a slab-ocean variable instead of proscribed SSTs.
Mean annual surface temperatures for the Cretaceous run. CRET (top) 3CO2 (middle), and 3CO2-CRET (bottom). For the CRET and 3CO2, runs, isotherms are drawn in dotted lines from −15 to 25°C every 5°C; For the 3CO2,-CRET run, the shaded area represents an increase of temperature >1°C dotted lines correspond to temperature increase of 0,0.,5, 1 and 1.5°C

Zonal mean annual surface-temperature differences (in K) for CTRLZ-CTRL, and CRET-CTRLZ
When snow depth is compared to the CTRLZ results (Fig. 2), the major conclusions are twofold. First, ice caps are still formed at high latitudes over West Antarctica and extreme northeastern America for the Cretaceous simulation. Second, the rate of formation of these ice caps is severely reduced in CRET compared to CTRLZ. On the present Greenland location, this damping reaches a factor of 2.5; over Antarctica, there is a large area which is ice free in the CRET simulation, but over western Antarctica, where an ice sheet is present, the formation rale is reduced in comparison to CTRLZ by a factor of 2.5. These results underline the important role of changes in the hydrologio cycle superimposed on thermal changes.
The impact of tripling CO2
There are many uncertainties regarding CO2 concentration during the mid-Cretaceous. Estimates based on the requirements of flowering plants for photosynthesis give a factor of 5, higher than for present-day CO2. Other estimates (Reference Lasaga, Berner, Gartels, Sundquist and BroeckerLasaga and others, 1985; Reference Berner, Lasaga and GarrelsBerner and others, 1983) give ranges from a factor of 2 to a factor of 10. The main reason for such high values are plate tectonics and volcanic activity, but the reduction of the continental area during the mid-Cretaceous also plays an important role (see Reference Crowley and NorthCrowley and North (1991) for a review on the evidence and quantification of higher CO2 during the mid-Cretaceous). In the 3CO2 experiment, we chose to triple the concentration of CO2 used in other experiments, which are based on the present value of 345 ppm. This gives a value of 1035 ppm. In Figure 5, we plot the annual mean surface temperatures for 3CO2 and the differences between 3CO2 and the CRET simulation. The increase in temperature, due to the CO2 tripling is, as expected, a function of latitude: there is a warming increase in high and mid huitudes of ∼2°C, and a smaller increase in Equatorial areas. These results show a weaker sensitivity forthe LMD model than for the National Center for Atmospheric Research (US NCAR) model (Reference Barron, Washington, Sundquist and BroeckerBarron and Washington, 1985), which is due to the use of a mixed-layer ocean which enables a full climatic response including increased SSTs. In Figure 2, we show the annual average snow-depth differences between 3CO2 and CRET. The warming observed in Figure 4 at high latitudes is not sufficient to prevent ice-sheet formation because the ice-sheet formation rate of 3CO2 is reduced in comparison with CRET by a factor of 1.3.
Conclusions and Outlook
As suggested by previous GCM experiments, a combination of several forcing factors is necessary in order to obtain a good understanding of the mid-Cretaceous climate (Reference Barron, Fawceett, Peterson, Pollard and ThompsonBarron and others, 1995). The change in sea land distribution plays an important role, and, especially in the case of North America, the homogenous climate may be related to the extension of shallow waters due to sea-level rise (Reference Valdes, Sellwood and PriceValdes and others, in press). The distribution we use here does not enable us to quantify this effect. New simulations using Aptian and Cenomanian paleogeographies should allow new insight into this question. Nevertheless, the temperature increase we obtain in our simulation experiments is of the same order of magnitude as that of previous experiments (Reference Barron, Washington, Sundquist and BroeckerBarron and Washington, 1985). CO2 increase has also had a major impact, but to quantify the response of the climate to rising CO2 levels, a slab-ocean component is required. However, our results show that the increase in temperature obtained from increased CO2 is too weak to prevent ice-sheet formation at high latitudes, although there is a suggestion that there is a reduction in the rate of ice-cap formation. Of course, a major component (heat transport by ocean) is missing, all hough future experiments using slab ocean or a reconstruction of SSTs deduced from O18 isotopic data should rectify this omission.
Acknowledgements
We gratefully acknowledge the Laboratoire de Météorologie Dynamique (CNRS, Paris, France for providing us with their GCM, P. J. Valdes for providing the mid-Cretaceous paleogeography, I. Sinet for participating in the simulation runs and J.Y Peterschmitt (LMCE) for the graphic outputs. The simulations were performed at the Laboratoirc de Modélisaliou du Climat et de l’Environnement. Computing facilities were provided by IDRIS and CEA.



