Introduction
The incorporation of recycled urea-nitrogen (N) into microbial N and the subsequent utilization of that protein by ruminants offer a distinct advantage to ruminants when dietary N content is low. However, the inability to accurately account for N recycling and its contribution to ruminally available N and to the metabolizable protein supply across a broad array of diets and production scenarios have hindered our ability to incorporate N recycling into current feeding models. A relatively non-invasive procedure to determine urea kinetics was developed in sheep (Sarraseca et al., Reference Sarraseca, Milne, Metcalf and Lobley1998; Lobley et al., Reference Lobley, Bremner and Zuur2000) and was subsequently implemented in cattle (Archibeque et al., Reference Archibeque, Burns and Huntington2001 and Reference Archibeque, Burns and Huntington2002; Marini and Van Amburgh, Reference Marini and Van Amburgh2003). Although useful for describing urea metabolism, this procedure does not directly measure ruminal microbial incorporation of recycled urea, but rather measures anabolic utilization. A determination of microbial utilization of recycled urea-N would be valuable because of the importance of adequate supplies of ruminally available N to optimize ruminal fermentation. Marini and Van Amburgh (Reference Marini and Van Amburgh2003) used urinary excretion of purine derivatives and the 15N enrichments of bacterial samples and plasma urea-N to calculate the incorporation of recycled urea-N into microbial N. As a further step, we wanted to evaluate microbial incorporation of recycled urea-N in the rumen and the subsequent appearance of that N in duodenal digesta using the urea kinetics procedure of Lobley et al. (Reference Lobley, Bremner and Zuur2000) in cattle with ruminal and duodenal cannulas. Al-Dehneh et al. (Reference Al-Dehneh, Huber, Wanderley, Theurer, Pessarakli and DeYoung1997) used dairy cows with duodenal and ruminal cannulas to determine microbial incorporation of recycled urea N; however, they did not determine urea kinetics using the methods outlined by Lobley et al. (Reference Lobley, Bremner and Zuur2000). We wanted to assess the adaptation periods required for the sample pools used to measure N recycling and microbial incorporation of N when using double-labeled urea. Therefore, the objective of the present study was to validate, in cattle, the length of time [15N15N]urea needs to be infused intravenously for plateaus to be reached in enrichments of urinary [15N15N]urea and [15N14N]urea, fecal 15N, ruminal microbial 15N and duodenal 15N.
Material and methods
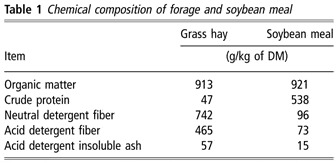
Five Angus × Hereford steers (average initial BW 237 ± 16 kg) were used in a completely randomized, one-period, two-treatment experiment to validate procedures used to determine urea kinetics and microbial incorporation of recycled urea-N in cattle. Double L duodenal cannulas (Streeter et al., Reference Streeter, Barron, Wagner, Hibberd, Owens and McCollum1991) and ruminal cannulas (plastisol, 10-cm diameter) were inserted, and steers were allowed 56 days prior to the initiation of the experiment. The experimental protocol was approved by the Institutional Animal Care and Use Committee at Kansas State University. Steers were housed in a continuously lighted barn and were provided ad libitum access to fresh water and plain white salt and were offered, at 0645 h, low-quality grass hay (Table 1) at 130% of average voluntary intake for the preceding 5 days. The two treatments were the provision of no supplemental protein (control, n = 2) or 1 kg/day of soybean meal (SBM) fed once daily at 0630 h (n = 3; Table 1). Steers consumed SBM within 15 min. Treatments were designed to have sufficiently divergent N intakes to allow for an evaluation of the experimental procedures across the range of N intakes planned for future experiments.
Chemical composition of forage and soybean meal

DM = dry matter.
The experiment was 15 days long, 7 days for adaptation to treatments and 8 days for label infusion and sample collection. For the first 5 days of adaptation, steers were housed in tie stalls (1.2 × 2 m2). For the remainder of the adaptation and throughout the collection period, steers were housed in metabolism crates to facilitate total collection of urine and feces and the jugular infusion of [15N15N]urea. Metabolism crates were designed such that urine was collected into a funnel directly beneath the mid-portion of the steer and subsequently was diverted into a bucket using gravity, whereas feces were collected in a pan placed directly behind the steer.
On day 9, at 1600 h, an indwelling catheter was placed in the jugular vein of each steer to infuse [15N15N]urea (Cambridge Isotope Laboratories, Andover, MA, USA) for the determination of urea kinetics. The catheter was inserted on the evening prior to the start of infusions to minimize the disturbances to the routine and insure that the label could be delivered on time. The [15N15N]urea solution was prepared by combining 1.16 g of [15N15N]urea (99.7% [15N15N]urea) with 1 l of sterile saline solution (9 g/l NaCl), and then it was filter sterilized (0.22 μm filter unit Sterivex; Millipore Corporation, Billeric, MA, USA). Saline solution was infused continuously, to prevent loss of patency, from the time the catheter was placed until 0700 h on day 10 when infusion of [15N15N]urea solution began. The [15N15N]urea solution was continuously infused at approximately 4.4 ml/h, which delivered 0.165 mmol of urea-N/h, until the end of the experimental period using a syringe infusion pump (Harvard Apparatus, South Natick, MA, USA). Total collections of urine and feces from day 9 were used to determine background enrichments of 15N. Additionally, ruminal bacteria and duodenal samples were obtained at 0500 h on day 9 and used to determine background enrichment of 15N. Samples from total collections of urine and feces collected from 0 to 24, 24 to 48, 48 to 72, 72 to 96 and 96 to 120 h after the initiation of [15N15N]urea infusion were obtained and used to determine when a plateau enrichment had been reached; these samples represented days 10, 11, 12, 13 and 14, respectively. Bacterial and duodenal samples used to estimate a plateau were collected at 22, 46, 70, 94, 118 and 142 h after initiation of [15N15N]urea infusion; these samples represented days 10, 11, 12, 13, 14 and 15, respectively. Samples of urine and feces collected on day 14 were used to determine urea kinetics using the methods outlined by Lobley et al. (Reference Lobley, Bremner and Zuur2000) with the exception of urine and feces, which were collected over the entire day rather than over 2-h periods. On day 15, whole ruminal contents (1 kg) and duodenal samples (300 ml) were collected prior to feeding (0 h) and at 3, 6, 9, 12, 15, 18 and 21 h after feeding to determine duodenal flows and incorporation of recycled urea-N into microbial protein. To isolate ruminal bacteria from the whole ruminal contents, 0.5 l of 9 g/l NaCl solution was added immediately after the sample was collected, it was then blended (5 min; Waring Commercial Blender; Waring Commercial, Torrington, CT, USA) and strained through two layers of cheesecloth, and the liquid fraction was immediately frozen and the material remaining in the cheesecloth was placed in the rumen.
Calculations of intake, digestion and N balance were made from day 9 to 14 (Cochran and Galyean, Reference Cochran and Galyean1994). Feed and ort samples were collected from days 8 to 13 to correspond with fecal and urine samples collected from days 9 to 14. Duodenal flow was measured with reference to acid detergent insoluble ash (ADIA) as an internal marker (Stafford et al., Reference Stafford, Cochran, Vanzant and and Fritz1996). Hay and SBM were sampled at feeding with 400 g of hay retained each day for later analysis. Orts were removed at 0600 h and approximately 200 g was retained for analysis. Fecal bins and urine buckets were removed and contents weighed at 0615 h daily. Feces collected over each 24-h period were thoroughly mixed, and samples (3%) were frozen (−20°C) for subsequent analyses. Urine collected over each 24-h period was thoroughly mixed and samples (2%) were retained and subsequently frozen (−20°C). Urine pH was maintained below 3 by adding 400 ml of 6 M HCl to urine collection containers prior to collection.
Laboratory analyses
Partial dry matter (DM) of hay, ort and fecal (used for fecal output determination) samples was determined by drying at 55°C for 96 h in a forced-air oven. Duodenal samples were frozen and lyophilized. Subsequently, all dried samples were ground with a Wiley mill to pass a 1-mm screen. Hay and SBM samples collected during the measurement phase were pooled across days on an equal weight basis. Ort and fecal samples were composited by steer across days. Hay, supplement, ort, fecal and duodenal samples were dried for 24 h at 105°C in a forced-air oven to determine DM and then combusted for 8 h at 450°C in a muffle furnace for organic matter (OM) determination. Nitrogen content of hay, SBM, wet feces, urine and duodenal digesta was determined by total combustion (Nitrogen Analyzer Model FP-2000; Leco Corporation, St. Joseph, MI, USA). Crude protein was calculated as N × 6.25. All hay, ort, fecal and duodenal samples were analyzed for NDF and ADF with the ANKOM-Fiber Analyzer (ANKOM-Technology, Fairport, NY, USA) with sodium sulfite and amylase omitted and without correction for residual ash. To determine ADIA of hay, ort, fecal and duodenal samples, the ANKOM bags containing the ADF residues were combusted for 8 h at 450°C in a muffle furnace. Dry fecal and duodenal samples were analyzed for 15N using a stable isotope elemental analyzer (Thermofinnigan Delta Plus; Thermo Electron Corporation, Waltham, MA, USA). Duodenal samples from day 15 were pooled prior to analysis. To isolate ruminal bacteria, samples of ruminal contents were thawed and feed particles were removed from the sample by centrifugation at 500 × g for 20 min. Supernatants were then centrifuged at 20 000 × g for 20 min to pellet the bacteria. The pellet was resuspended with 9 g/l NaCl and centrifuged at 20 000× g for 20 min. The bacterial pellets were frozen and lyophilized. Bacteria were analyzed for 15N enrichment with samples from day 15 being pooled prior to analysis.
For determination of urea kinetics, urinary urea and ammonia concentrations were determined colorimetrically with an auto analyzer (Technicon Analyzer II; Technicon Industrial Systems, Buffalo Grove, IL, USA) using methods of a Marsh et al. (Reference Marsh, Fingerhut and Miller1965) and Broderick and Kang (Reference Broderick and Kang1980). To initially remove ammonia from the urine samples, 2 ml of Dowex 50W-X8 ion exchange resin 100 to 200 mesh, H+ form (Sigma Chemical, St. Louis, MO, USA) was mixed with 10 ml of urine, vortexed for 15 s and allowed to stand for 15 min. From the tube, 31 μmol of urea was pipetted into a column containing 2 ml of Dowex resin to remove any remaining ammonia, and the effluent was discarded. Deionized water (20 ml) was added to the column, and the effluent was discarded (Read et al., Reference Read, Harrison and Halliday1982). An additional 10 ml of deionized water was added to the column, and the effluent was retained. Urea and ammonia concentrations of the retained effluent were determined visually using previously discussed methods. If no ammonia was present, then 3 μmol of urea was transferred into an Exetainer (Labco International, Houston, TX, USA) tube, and the sample was brought to 4 ml with deionized water and subsequently frozen. If ammonia was present, the initial step of mixing the urine with the Dowex resin was repeated until no ammonia was present in the final effluent. To prepare samples for Hoffman degradation, He was bubbled through the samples for approximately 10 min and samples were quickly frozen in liquid N2. After freezing, 0.5 ml of hypobromite (27 g bromine per 100 ml of 40% (wt/wt) NaOH) was added and the lid screwed on (Volk and Jackson, Reference Volk and Jackson1979). With the tube remaining in liquid N2, a vacuum pump was used to remove the gas from the tube and He was added; this process was repeated thrice. After the final addition of He, the Exetainer was removed from liquid N2 and allowed to thaw at room temperature. The thawed sample was then placed in a 60°C water bath for 15 min to allow the Hoffman degradation reaction to occur rapidly. Samples were then analyzed for 28N2, 29N2 and 30N2 using a stable isotope gas bench (Thermofinnigan Delta Plus; Thermo Electron Corporation, Waltham, MA, USA).
Calculations
Urea kinetics were calculated as outlined by Lobley et al. (Reference Lobley, Bremner and Zuur2000) and included correction (0.56%) for non-monomolecular reactions during the Hoffman degradation. This correction was based on standards analyzed at the same urea concentration (0.75 mM) as the samples and was lower than the correction factor (4.68%) reported by Lobley et al. (Reference Lobley, Bremner and Zuur2000), but was in accordance with the correction factor reported by Marini and Attene-Ramos (Reference Marini and Attene-Ramos2006). Duodenal DM flow was calculated by dividing fecal ADIA output (g/day) by the ADIA concentration of duodenal digesta. Bacterial N flow was then calculated by multiplying duodenal N flow by the ratio of duodenal 15N enrichment to bacterial 15N enrichment. The flow of bacterial N derived from recycled urea-N was calculated by multiplying bacterial N flow by the ratio of bacterial 15N enrichment to urinary 15N-urea enrichment. Urinary 15N-urea enrichment was determined by adding the ratio of 30N2 : 28N2 to half the ratio of 29N2 : 28N2 and, subsequently, dividing that sum by one plus the ratios of 30N2 : 28N2 and 29N2 : 28N2. Undegradable intake protein flow was determined by subtracting bacterial N flow from the total duodenal N flow, and there was no correction for the contribution of endogenous N flow.
Statistical analyses
Intake, digestion, N balance, urea kinetics and duodenal flows were analyzed using the MIXED procedure of Statistical Analysis Systems Institute (SAS) System for Windows Release 8.1 (SAS Institute Inc., Cary, NC, USA). The term in the model was treatment. Enrichment variables were analyzed using the MIXED procedure of SAS. Terms in the model were treatment, day and treatment × day with steer included as random term. The repeated term was day with steer serving as the subject. Compound symmetry was used for the covariance structure. Plateaus in urinary N enrichment of 29N2 and 30N2 and bacterial, duodenal and fecal enrichments of 15N were determined using a single-slope, broken-line model with the NLIN procedure of SAS (Robbins et al., Reference Robbins, Norton and Baker1979).
Results
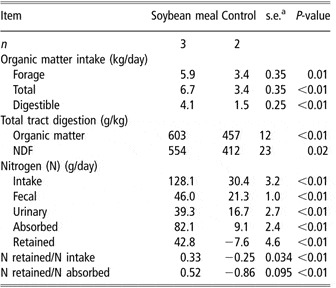
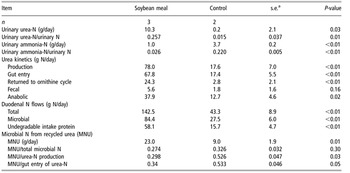
As expected, steers responded to SBM supplementation by nearly doubling the total OM intake over control (6.7 v. 3.4 kg/day; P < 0.01; Table 2) with 75% of the increase in total OM intake being accounted for as increased forage OM intake. Additionally, total tract OM digestion was greater (P < 0.01) for SBM than for control. When digestion and intake were combined as total digestible OM intake steers fed SBM consumed 173% more total digestible OM than control steers. As per the design of the study, N intake was greater (P < 0.01) with SBM than with control, which translated into greater fecal and urinary excretion of N (P < 0.01). Subsequently, N retention was greater for SBM (43 g of N/day) than for control (−7.6 g of N/day; P < 0.01). Urinary urea excretion was greater as an absolute amount of N (P = 0.03; Table 3) and as a fraction of urinary N excretion (P = 0.01) for SBM than for control. In contrast, urinary ammonia excretion was greater for control than for SBM when expressed as an absolute amount (P < 0.01) and when expressed as a fraction of urinary N excretion (P < 0.01). Supplementation with SBM tripled the appearance of microbial N at the duodenum from 27 g/day of microbial N for control to 84 g/day for SBM (P < 0.01). Total duodenal N and undegradable intake protein flows more than tripled in response to SBM v. control (P < 0.01).
Effects of soybean meal supplementation on intake, digestion and nitrogen balance in steers fed low-quality grass hay

as.e. for n = 2.
Effects of soybean meal supplementation on urea-nitrogen (N) excretion, ammonia-N excretion, urea kinetics and microbial incorporation of recycled urea-N in steers fed low-quality grass hay

as.e. for n = 2.
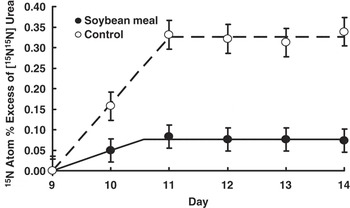
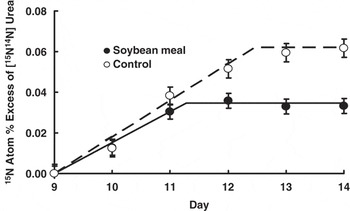
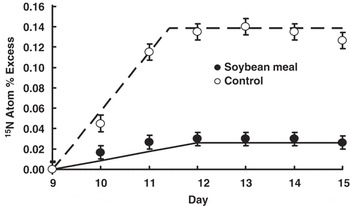
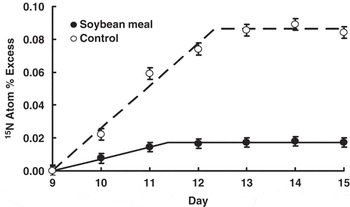
Urinary enrichment of [15N15N]urea plateaued within 24 h of initiation of intravenous infusion of [15N15N]urea (prior to the beginning of collections on day 11; Figure 1). There was a treatment × day interaction (P < 0.01) for [15N15N]urea enrichment in the urine. This interaction, observed in urine, fecal, ruminal bacteria and duodenal samples, occurred (1) because treatments had identical enrichments prior to the initiation of [15N15N]urea infusion (i.e., background on day 9), whereas during infusion the enrichments were greater for control than for SBM and (2) because the time to achieve plateau differed between treatments (for urinary [15N14N]urea and for duodenal and fecal 15N enrichments). Urinary enrichment of [15N14N]urea plateaued by day 12 for SBM and by day 13 for control or within 48 and 72 h of the initiation of intravenous infusion (Figure 2). Ruminal bacteria 15N enrichments plateaued by day 12 or within 48 h for both treatments (Figure 3). Duodenal digesta 15N enrichments plateaued by day 12 for SBM and by day 13 for control or within 48 and 72 h, respectively (Figure 4). Fecal 15N enrichment plateaued by day 12 or within 48 h for SBM and by day 13 or within 72 h for control steers.
The effect of day of [15N15N]urea infusion on [15N15N]urea enrichment in urine. The [15N15N]urea infusion began after a background sample was collected on day 9. The lines shown were created using a single-slope, broken-line model. A plateau was reached by day 11 for both treatments (treatment × day interaction; P < 0.01). Error bars indicate standard error of the mean.

The effect of day of [15N15N]urea infusion on [15N14N]urea enrichment in urine. The [15N15N]urea infusion began after a background sample was collected on day 9. The lines shown were created using a single-slope, broken-line model. A plateau was reached by day 12 for the soybean meal and day 13 for the control (treatment × day interaction; P < 0.01). Error bars indicate standard error of the mean.

The effect of day of [15N15N]urea infusion on ruminal bacterial 15N enrichment. The [15N15N]urea infusion began after a background sample was collected on day 9. The lines shown were created using a single-slope, broken-line model. A plateau was reached by day 12 for both treatments (treatment × day interaction; P < 0.01). Error bars indicate standard error of the mean.

The effect of day of [15N15N]urea infusion on duodenal 15N enrichment. The [15N15N]urea infusion began after a background sample was collected on day 9. The lines shown were created using a single-slope, broken-line model. A plateau was reached by day 12 for soybean meal and by day 13 for control (treatment × day interaction; P < 0.01). Error bars indicate standard error of the mean.

When urea kinetics were measured in steers consuming low-quality forage and either unsupplemented (control) or supplemented with 1 kg of SBM daily, urea production, gut entry, the amount of urea returned to the ornithine cycle and anabolic utilization were greater (P ⩽ 0.02) for SBM than for control (Table 3). Microbial N from recycled urea-N was greater for SBM than for control (23.0 v. 9.0 g/day; P = 0.01). In contrast, the fraction of microbial N from recycled urea-N was not statistically different between the two treatments (P = 0.30) and averaged 0.30. However, the fraction of urea production and gut entry captured in microbial N was greater for control than for SBM (P = 0.03 and 0.05, respectively).
Discussion
Determination of urea kinetics using a method similar to the one used in our study was first reported in ruminants by Sarraseca et al. (Reference Sarraseca, Milne, Metcalf and Lobley1998), and the model to calculate urea kinetics was subsequently refined by Lobley et al. (Reference Lobley, Bremner and Zuur2000). In both cases, sheep were maintained in a quasi-steady state by providing feed continuously or hourly, respectively. Because the sheep in their studies were maintained in a quasi-steady state, they could collect urine samples every 2 h between 48 and 56 h after the initiation of [15N15N]urea infusion to determine urea kinetics. Although this methodology is useful, its applicability in research where the primary goal is to investigate urea kinetics in animals fed a discontinuous supply of nutrients (e.g., protein supplements) is limited because discontinuous supplementation will alter the urinary enrichments of [15N15N]urea and [15N14N]urea during the course of the day, rendering the short urinary sampling protocol of Sarraseca et al. (Reference Sarraseca, Milne, Metcalf and Lobley1998) and Lobley et al. (Reference Lobley, Bremner and Zuur2000) inadequate for animals fed a discontinuous supply of nutrients. To account for the discontinuous supply of nutrients, we extended collections over an entire day because nutrients (i.e., N) were provided in similar amounts every day. By integrating the sampling over the entire day, the animal is, in effect, in a quasi-steady state over the 24-h period. By utilizing the longer collection periods, this method can be used to measure urea kinetics in animals maintained under more ‘normal’ production scenarios. Additionally, it allows observation of the effect of frequency of nutrient provision (e.g., frequency of protein supplementation). Our observation of urea kinetics over a 24-h period is in contrast to previous observations in cattle where samples for determination of urea kinetics were collected over a 6 to 8 h time period in beef cattle (Archibeque et al., Reference Archibeque, Burns and Huntington2001 and Reference Archibeque, Burns and Huntington2002; Huntington et al., Reference Huntington, Burns and Archibeque2007), in dairy cattle (Marini and Van Amburgh, Reference Marini and Van Amburgh2003) and in sheep (Sunny et al., Reference Sunny, Owens, Baldwin, El-Kadi, Kohn and Bequette2007). In work by Sunny et al. (Reference Sunny, Owens, Baldwin, El-Kadi, Kohn and Bequette2007) and Marini and Van Amburgh (Reference Marini and Van Amburgh2003), animals were fed every 2 h to ensure the animals were at steady state. In contrast, Archibeque et al. (Reference Archibeque, Burns and Huntington2001 and Reference Archibeque, Burns and Huntington2002) offered hay twice daily and provided the supplement once daily, and they made no attempt to account for the discontinuous supply of nutrients when collecting samples for the determination of urea kinetics. Additionally, Huntington et al. (Reference Huntington, Burns and Archibeque2007) used grazing cattle and also made no attempt to correct for the discontinuous supply of nutrients in their work. Presently, we are unaware of any research documenting the measure of urea kinetics over a 24-h period in using the continuous infusion of [15N15N]urea in ruminants provided a discontinuous supply of nutrients. Previous research has been reported in dairy cattle and sheep (Ruiz et al., Reference Ruiz, Tedeschi, Marini, Fox, Pell, Jarvis and Russell2002; Marini et al., Reference Marini, Klein, Sands and Van Amburgh2004) given a pulse dose of [15N15N]urea, where urine was collected over a 72-h period for the determination of urea kinetics.
The primary objectives of our study were to determine when plateaus were reached in urinary, bacterial, duodenal and fecal enrichments, when [15N15N]urea was intravenously infused into cattle provided a discontinuous supply of nutrients and to evaluate procedures for the concurrent determination of urea kinetics and the incorporation of recycled urea-N into microbial N. Paramount to determining any marker-dependent measure without the total collection of the marker is insuring that procedures allow adequate time for marker equilibration before measurements are taken. Urinary enrichment of [15N15N]urea followed a pattern similar to that observed by Lobley et al. (Reference Lobley, Bremner and Zuur2000) for sheep with enrichment reaching a plateau within 24 h of initiation of intravenous infusion of [15N15N]urea (on day 11; Figure 1). Sunny et al. (Reference Sunny, Owens, Baldwin, El-Kadi, Kohn and Bequette2007) observed in sheep, that urinary [15N15N]urea enrichment plateaued before the sheep had been infused for 32 h. The treatment × day interactions observed in our study for 15N enrichment in all sample pools were expected because we intravenously infused [15N15N]urea at a constant rate (0.154 mmol urea-N/h) for both treatments. In doing so, the level of enrichment attained in the sample pool was less when the N intake was greater (i.e., SBM sample pools had lower enrichments than control) because there was more N in the system to dilute the 15N. Lobley et al. (Reference Lobley, Bremner and Zuur2000) made a similar observation; when a constant rate of label was infused, greater N intake resulted in lower enrichments. In contrast, Sunny et al. (Reference Sunny, Owens, Baldwin, El-Kadi, Kohn and Bequette2007) attempted to maintain similar enrichments among treatments by varying the amount of labeled urea infused with the level of N intake.
Our observations of plateau in urinary enrichment of [15N14N]urea were in accordance with the observations of Lobley et al. (Reference Lobley, Bremner and Zuur2000) and Sunny et al. (Reference Sunny, Owens, Baldwin, El-Kadi, Kohn and Bequette2007) in sheep. Urinary [15N14N]urea enrichment is delayed in reaching a plateau when compared to [15N15N]urea enrichment because the 15N enrichment must reach equilibrium in all the pools where urea is hydrolyzed and the resulting N is subsequently returned to the ornithine cycle (Lobley et al., Reference Lobley, Bremner and Zuur2000). This is supported by the longer [15N15N]urea infusion periods required for ruminal bacteria (Figure 3) and duodenal digesta (Figure 4) to reach a 15N enrichment plateau in comparison to urinary [15N15N]urea enrichment. Observations of [15N14N]urea excretion acquired before plateau would not accurately reflect urea metabolism.
The plateaus in 15N enrichment of ruminal bacteria and duodenal digesta in our study are in contrast to the lack of plateau observed in ruminal microbial and duodenal digesta samples obtained from dairy cattle intravenously infused with 15N-enriched urea for 72 h (Al-Dehneh et al., Reference Al-Dehneh, Huber, Wanderley, Theurer, Pessarakli and DeYoung1997). One possible explanation for these differences is their use of gravity flow with hourly adjustment as a means of infusing 15N-enriched urea, whereas we used an infusion pump, which provided very consistent flow rates throughout the infusion period. This conclusion is supported by the unexplained increase in enrichment occurring after 60 h of infusion in their study. In accordance with our observations, duodenal 15N enrichment was lower than bacterial 15N enrichment and urinary urea enrichment was greater than both duodenal digesta and ruminal bacteria in dairy cattle (Al-Dehneh et al., Reference Al-Dehneh, Huber, Wanderley, Theurer, Pessarakli and DeYoung1997). In our study we used the ratio of duodenal 15N enrichment to bacterial 15N enrichment to provide a measurement of the proportion of duodenal N derived from ruminal microbes. Similarly, the ratio of ruminal bacterial enrichment to urinary urea 15N enrichment was used to calculate the fraction of microbial N coming from recycled urea-N. The two underlying assumptions in this calculation are that urinary urea enrichment accurately reflects the enrichment of the plasma urea pool and that plasma urea is the sole source of 15N for microbial incorporation. The first assumption is also made for all urea kinetic determinations that use the method reported by Lobley et al. (Reference Lobley, Bremner and Zuur2000). In contrast to the second assumption, Ouellet et al. (Reference Ouellet, Demers, Zuur, Lobley, Seoane, Nolan and Lapierre2002) reported that approximately 13% of duodenal N flow in dairy cows was from endogenous sources other than urea and half of that was found in microbial N. However, the contribution of 15N from endogenous sources other than urea to microbial N in our study was likely lower because of the shorter [15N15N]urea infusions used in our study (120 v. 200 h).
Anabolic utilization was greater than microbial incorporation of recycled urea-N for both treatments. This was also observed by Marini and Van Amburgh (Reference Marini and Van Amburgh2003) when microbial protein yield was estimated with urinary excretion of purine derivatives. Anabolic utilization is calculated by subtracting urea N returned to the ornithine cycle and urea N excreted in the feces from gut entry of urea. The observation that microbial incorporation of recycled urea-N was less than anabolic utilization was unexpected because anabolic use would not include either the indigestible fraction of microbial N (accounted as urea N excreted in the feces) or N from microbial amino acids that were absorbed and catabolized, if the N contributed to urea production (i.e., returned to the ornithine cycle). Some of the observation that anabolic use exceeded microbial incorporation may be explained by the urinary excretion of label in unmeasured forms (e.g., other than urea) that would be calculated as anabolic use; the methodology may be improved by measuring the total 15N urinary excretion, which would prevent non-urea losses from being accounted for as anabolic use. Additionally, labeled amino acids are predominantly retained by the animal via protein synthesis; because net protein deposition is a small proportion of protein synthesis and the amino acids released by protein degradation are unlikely to have reached isotopic plateaus over the short infusion periods, the anabolic fraction likely reflects protein synthesis more than protein deposition.
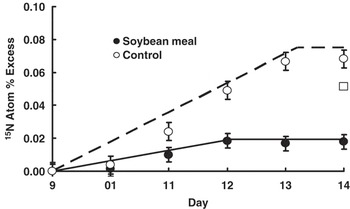
Fecal 15N enrichment plateaued for both treatments in our study (Figure 5). This is in contrast to Lobley et al. (Reference Lobley, Bremner and Zuur2000) and Sunny et al. (Reference Sunny, Owens, Baldwin, El-Kadi, Kohn and Bequette2007) where fecal 15N enrichment did not plateau after 96 and 80 h of intravenous infusion, respectively. Both of our treatments plateaued within the amount of time both Lobley et al. (Reference Lobley, Bremner and Zuur2000)and Sunny et al. (Reference Sunny, Owens, Baldwin, El-Kadi, Kohn and Bequette2007) intravenously infused [15N15N]urea in their studies. One potential explanation for this difference is that they both used sheep, whereas we used cattle. Differences in diet (i.e., the low protein content of our diet) and feeding patterns are also possible explanations.
The effect of day of [15N15N]urea infusion on fecal 15N enrichment. The [15N15N]urea infusion began after a background sample was collected on day 9. The lines shown were created using a single-slope, broken-line model. A plateau was reached by day 12 for soybean meal and by day 13 for control (treatment × day interaction; P < 0.01). The open box symbol (□) represents an observation for soybean meal that was deemed to be an outlier and was not used in determining the single-slope, broken-line model. Error bars indicate standard error of the mean.

We are unaware of other researchers measuring urea kinetics (Sarraseca et al., Reference Sarraseca, Milne, Metcalf and Lobley1998; Lobley et al., Reference Lobley, Bremner and Zuur2000) while directly measuring duodenal flow to allow measurement of microbial incorporation of recycled urea-N. Marini and Van Amburgh (Reference Marini and Van Amburgh2003) used urinary excretion of purine derivatives and the 15N enrichments of bacterial samples and plasma urea-N to calculate the incorporation of recycled urea-N into microbial N. Al-Dehneh et al. (Reference Al-Dehneh, Huber, Wanderley, Theurer, Pessarakli and DeYoung1997) intravenously infused a 15N-enriched urea solution into dairy cows during lactation for 72 h to determine the contribution of urea recycling to microbial N synthesis and duodenal flow of recycled urea-N, but they did not measure urea kinetics. However, they were able to determine that recycled urea-N contributed more to meeting microbial N requirements in cows fed a high-grain diet than those fed a high-forage diet (0.37 v. 0.13, respectively). Marini and Van Amburgh (Reference Marini and Van Amburgh2003) determined that, at the lowest level of N intake studied, urea recycling contributed 0.19 of the N for microbial N synthesis. The contribution of recycled urea-N to microbial N synthesis was higher in our study (0.27 for SBM and 0.32 for control) than in that of Marini and Van Amburgh (Reference Marini and Van Amburgh2003) and similar to the high-grain diet studied by Al-Dehneh et al. (Reference Al-Dehneh, Huber, Wanderley, Theurer, Pessarakli and DeYoung1997). Given the low N content of our diet, the low ruminal ammonia concentrations previously reported with a similar diet (Koster et al., Reference Koster, Cochran, Titgemeyer, Vanzant, Abdelgadir and St-Jean1996), and the availability of fermentable OM, we expected urea recycling to play a significant role in meeting ruminal N demands, especially for the control treatment, due to the relationships of these factors to urea transfer to the rumen (Kennedy and Milligan, Reference Kennedy and Milligan1980). Although supplementation of SBM corrected the degradable intake protein deficiency, in accordance with previous observations (Mathis et al., Reference Mathis, Cochran, Stokka, Heldt, Woods and Olson1999), urea recycling still played a significant role in meeting microbial N demands and accounted for more microbial N mass than it did in the unsupplemented controls; however, a similar fraction of total microbial N was provided by recycled urea-N for both treatments.
This study established when plateaus are reached in enrichment of isotopically labeled N pools that are important for determining urea kinetics and incorporation of recycled urea-N into ruminal microbial N in cattle. Urine collections were extended across entire days to account for diurnal variation in N metabolism in cattle consuming low-quality forage and supplemented discontinuously with protein. Procedures outlined in this paper are useful for the concurrent determination of urea kinetics and microbial incorporation of recycled urea-N.
Acknowledgements
This paper is contribution no. 07-286J from the Kansas Agricultural Experiment Station, Manhattan. The authors gratefully acknowledge Dr Gerald Lobley at Rowett Research Institute for his technical assistance with analyzing 15N-enriched samples, data interpretation and willingness to provide advice. Additional thanks to Dr Roxane Fagan at North Carolina State University for her assistance in analyzing 15N-enriched samples and Ms Cheryl Armendariz at Kansas State University for her assistance in the laboratory.