

Globalization has distributional consequences both within and across societies. In the areas of international trade and immigration, theoretical and empirical research has explored how the movement of goods and people affect distributions of income. Although considerable debate remains, existing economic models provide falsifiable hypotheses on how trade and migration affect income distributions. Surprisingly, despite the vast literature on multinational corporations (MNCs) and their investments and the increasing activity of countries in attempting to woo foreign investment, little research has explored the impact of foreign direct investment (FDI) on income inequality.
In this article we argue that theoretical predictions regarding the effect of FDI on income distribution within a country are muddled. Economic models of FDI, usually focused on decisions at the firm level in response to market imperfections, provide competing predictions of the relationship between FDI and income inequality. We believe that measuring the net impact of FDI on income inequality becomes an empirical question, but one that has to be approached carefully, because potential issues of reverse causality, selection bias, and omitted variable bias in studies of FDI can lead to spurious results.
We focus on the liberalization of capital flows in Mexico from 1990 to 2000 and on how the ensuing surge of multinational investments changed state-level income inequality. Thus, we can compare Mexico prior to FDI to Mexico after FDI and assess the effects on the distribution of income of such capital inflows. More importantly, the decision of most U.S. MNCs to locate close to one of the six main border routes linking the United States and Mexico also provides spatial variation that allows us to explore how levels of income inequality changed in Mexican states that attracted massive amounts of FDI in contrast with Mexican states that attracted little FDI. This geographic component of FDI provides us with a natural experiment: using instrumental variables estimation, with “distance to the border” as a truly exogenous variable, we find that states that attracted higher levels of FDI enjoyed lesser income inequality relative to states with less FDI. We believe this strategy mitigates the serious problem of omitted variable bias.
We present our argument as follows. In the next section, we review the extant literature on the international determinants of inequality, especially arguments regarding the effect of FDI on income inequality. In the second section, we point to potential problems of endogeneity that plague previous findings in the literature. We lay out an appropriate research design and focus the discussion of FDI and income inequality on the case of Mexico, a middle-income economy that benefited from increased FDI flows during the 1990s. We then describe the construction of empirical indicators and carry out estimation of a model of FDI and income inequality in the third and fourth sections. We conclude in the last section by pointing out avenues for further research.
Theory
The topic of income inequality has received increasing attention within the fields of international and comparative political economy. For starters, a lively debate currently rages over whether patterns of economic inequality within and across nations have changed at all during the past two decades, and if so, whether these changes can be attributed to globalization.1
Although a full literature review of the determinants of income inequality is beyond the scope of this article, we find it useful to summarize some of the hypothesized causal connections between globalization and economic inequality. Following Bradley and colleagues, we distinguish arguments as either emphasizing state institutions or global markets as the main forces driving income inequality.2Bradley et al. 2003.
Many scholars believe that economic distribution is ultimately shaped by domestic factors such as labor market organization and political institutions, even if changes in international market conditions are the main cause of demands for redistribution. At least in countries within the Organization for Economic Cooperation and Development (OECD), where this research program has made most inroads, studies argue that patterns of income inequality are determined by political demands for redistribution and safety nets, and by institutions that regulate the supply of public policy, such as party system organization. In particular, several authors have recently argued that similar market pressures derived from globalization will translate into different public policies and, presumably, into different patterns of income inequality.3
The capacity of political parties to achieve more egalitarian distributions of disposable income seems to be constrained by patterns of labor market organization. For example, some research suggests that highly unionized labor markets and institutions conducive to centralized wage bargaining allow leftist parties to achieve more egalitarian distributions of opportunity through nontargeted social programs.4See Beramendi and Cusack 2004; Esping-Andersen 1990; Garrett 1998; Kenworthy and Pontusson 2005; Pontusson, Rueda, and Way 2002; and Wallerstein 1999.
Iversen and Soskice 2001.
Most of these studies adopt a decidedly cross-national perspective to explore variation in domestic political institutions as a determinant of distributive outcomes. In contrast, theoretical arguments that emphasize the role of global markets tend to emphasize similarities across countries. For example, Rodrik argues that globalization leads not only to a shift in demand but also increases the elasticity of demand for labor. As capital can credibly threaten to relocate in a global economy, the bargaining power of labor is greatly diminished, presumably leading to wage concessions across countries.7
Rodrik 1997.
Among theorists that build on the premise of comparative advantage, the common understanding is that while the liberalization of trade and capital flows provides a net gain for all countries, the forces of globalization generate winners and losers within the borders of nation-states. For example, in one of the classic trade models, Stolper and Samuelson argue that free trade would raise the incomes of the abundant factors of production and lower the returns to the scarce factors of production.9
Stolper and Samuelson 1941.
Wood 1994.
A second broad research agenda focuses on differences between various types of labor, particularly skilled versus unskilled, and how trade affects income inequality. A number of scholars have argued that globalization has led to an increased premium for skilled labor, thus suggesting that trade liberalization decreases the returns to low-skilled labor and increases the returns to high-skilled labor. These arguments became familiar to noneconomists in the recent debate in the United States over the impact of North American Free Trade Agreement (NAFTA) on U.S. workers. Although debate remains over the distributional impact of trade, economic models provide us with theoretical tools to generate hypotheses regarding the effects of trade on income inequality.
While the vast literature on the link between income inequality and trade provides guidance on how globalization affects income inequality, one has to tread carefully in applying these insights to the study of FDI. FDI blossomed as a field of study when Hymer identified the differences between FDI and other types of financial capital.11
Hymer argued that FDI is driven by market imperfections, rather than by factor endowments or differences in rates of return across borders. Foreign firms have advantages over domestic firms, and these foreign firms choose to locate in a country to turn this advantage into profits, rather than export their goods or services or license domestic firms to make the product for the MNC. One of the main explanations for FDI is that MNCs possess intangible assets that are not easily transferred across borders.12Markusen 1995.
Thus, MNCs often look quite different from domestic firms, employing more skilled workers and using more advanced technologies. One fairly consistent finding within the FDI literature is that MNCs pay a wage premium over local firms.13
See Moran 1998.
See Te Velde 2003, for a review of the literature.
Feenstra and Hanson 1997.
What does this mean for the relationship between FDI and levels of income inequality? We emphasize two mechanisms through which MNCs may affect income distribution within a country. First, MNCs bring capital into the country, decreasing the total returns to capital and increasing the returns to labor. Thus, foreign capital competes with domestic capital for domestic workers, driving up wages and decreasing the profitability of domestic firms. This effect would speed up convergence of the incomes of labor relative to capital, decreasing income inequality. Second, MNCs pay a wage premium over domestic firms. If MNCs pay a wage premium for skilled workers, this would lead to an increase in the income differential between skilled and unskilled workers but also to diminished income disparity between skilled workers and holders of capital. Conversely, if MNCs would hire unskilled workers and pay a wage premium for them, FDI would decrease income inequality by raising the incomes of workers that are most likely at the bottom of the income distribution.
The complex relationship between FDI and income inequality becomes clear from an overview of the theoretical determinants of FDI: for the most advanced countries, such as the United States, Japan, or Europe, much of the cross-border FDI consists of mergers and acquisitions. For example, Europe's Daimler-Benz purchase of Chrysler led to a massive flow of FDI into the United States; yet, we have little theoretical insight into how this affected income inequality in the United States. Perhaps more perplexing is the inflow of Japanese FDI into the U.S. auto sector. Most scholars argue that Japanese auto manufacturers chose to “jump” U.S. tariffs on imported automobiles and build autos in the United States. What was the impact of this FDI on income inequality in the United States? Clearly the success of Japanese auto producers has had some impact on Detroit, where fierce competition has cost the city numerous highly paid auto production jobs. In contrast, foreign car companies have built production facilities that generate high-paying jobs in the Midwest, West, and South. Most of these foreign plants are not unionized and pay lower wages than the unionized plants of the Big Three U.S. car manufacturers. These foreign car facilities are generally located in poor areas of the United States, generating employment and wage growth, especially in the South.
In this article we attempt to circumvent the existing empirical pitfalls in the study of links between FDI and income inequality by focusing on a natural experiment in a middle-income country. We focus on the liberalization of capital inflows into Mexico in the mid-1990s to test the impact of FDI on income inequality. In the following section we discuss the case.
Research Design
Few studies have directly tested the impact of FDI flows on income inequality. One recent study by Reuveny and Li tests the impact of FDI on income inequality in sixty-nine countries from 1960–95.18
Reuveny and Li 2003.
Alderson and Nielsen 1999.
See Te Velde 2003, for a review of the literature on FDI and income inequality in Latin America. See also World Bank 2006, for a broad overview on the relationship between globalization and income inequality.
Although we believe it is important to address cross-national patterns of domestic income inequality, we are slightly skeptical about the ability to test the causal link between FDI and the distribution of income with this type of research design. In this design, FDI is generally treated as an exogenous factor. Consider, however, the case of China, which received little FDI in 1960 but is the leading FDI recipient in recent years and where income inequality has arguably increased during the past decade. We believe that other factors, such as economic liberalization, have an equally plausible claim to explain the increase in income inequality in China.
More formally, we can think of studies exploring the link between income inequality and FDI as potentially suffering from omitted variable bias, selection bias, and reverse causation. The issue of omitted variable bias is the most transparent in the study of FDI. FDI decisions occur at the firm level, yet most scholars study FDI flows with models that look at country-level variables measured annually. This is damning if omitted variables are correlated with the error term. We believe that this bias is especially problematic in countries that enact economic reform in a bundle, liberalizing FDI laws at the same time that they privatize state-owned enterprises and implement sweeping trade reforms.21
Unless appropriate indicators are included in the model specification, any findings on the relationship between FDI and income inequality may be capturing the impact of omitted variables on changing patterns of income inequality.Selection bias can also lead to spurious results on the study of FDI and income inequality. For example, an excellent study by Moran finds that MNCs, even in the most labor-intensive industries, tend to locate their operations near pools of highly trained labor.22
Moran 2002.
Finally, there is an argument for the possibility of reverse causation. Firms could be purposely locating in countries with high or low levels of income inequality. The argument for firms purposely investing in countries with high-income inequality is most probable in the textile or footwear industry. In numerous countries, governments have attracted these labor-intensive operations to export-processing zones.24
Moran 2002.
Alesina and Perotti 1996.
In this article we explore how FDI affects income inequality within a single country. To begin with, this strategy allows us to more precisely specify our theoretical intuitions on how FDI will affect wages. We focus on the impact of FDI inflows on income inequality in Mexico during the 1990s. Mexico underwent a rapid process of liberalization starting with the Salinas administration in 1988, a process that eventually led to the negotiation and implementation of NAFTA.27
See Hanson 2005b.

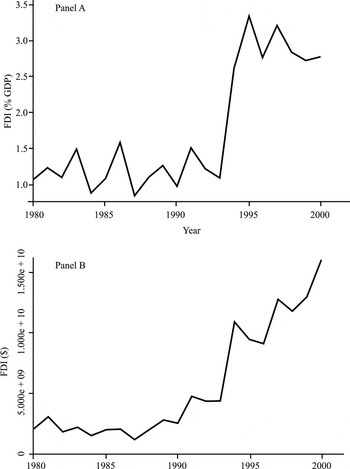
FDI over time
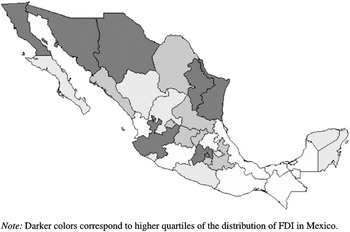
Furthermore, we can exploit the regional variation in FDI to address its effect on income inequality. As in the example of China given earlier, Mexico carried out major economic reforms, including liberalization of the financial sector, throughout the 1990s. National changes in income inequality from 1990 to 2000 could be easily attributed to any of several national-level policy changes or even to state-level characteristics. Yet, the interesting regional pattern of FDI inflows gives us leverage to address the issue of endogeneity of our FDI indicator. Most of the FDI flowing into Mexico located either in the states bordering the United States or in Mexico City (see Figure 2).28
After controlling for population density, this pattern becomes even more accentuated. Average per capita annual flows of FDI from 1994 to 2000 amount to US $1,130 along the six border states (Baja California, Sonora, Chihuahua, Coahuila, Nuevo León, Tamaulipas), but only US $311 in the rest of the country (and even this figure is exaggerated by inclusion of Mexico City).

Territorial distribution of FDI stock, 2000
It would be difficult to argue that this pattern of investment close to the U.S. border was conditional on higher levels of education, better infrastructure, cleaner governance, or many of the other state-level factors we would normally associate with a good investment environment. Instead, these decisions were largely carried out based on an exogenous factor, namely, the distance from one of the six major routes linking Mexico to the United States. Consistent with the typical maquila pattern of FDI, U.S. firms located in Mexico to take advantage of lower labor costs and to export finished or intermediate products back into the United States. Spatial variation provides leverage to evaluate how FDI inflows affected income inequality within Mexico. Unlike other studies that ignore the endogeneity of FDI flows, we argue that while the timing of FDI was clearly caused by factors such as Mexican trade and capital liberalizations, the actual location of FDI was determined by an exogenous geographic factor. States that border the United States received lots of FDI while the rest of Mexico, bar Mexico City, received little FDI.
Comparing the changing pattern of income inequality in states close to the border as opposed to other states in Mexico provides us with a natural experiment. By using the distance from U.S. border crossing points as an instrument explaining the decision of MNCs to invest into different Mexican states, we can circumvent the pitfalls of endogeneity we identified above and more persuasively estimate the effect of FDI on income inequality. Distance to the border is an ideal instrument, as it is highly correlated with FDI, but there is no theoretical reason to believe that it is associated with unobserved variables omitted from the model. We build an instrumental variable model using the minimum distance from one of the six major land routes between the United States and Mexico as an instrument for state-level FDI. We then estimate the changing pattern of income inequality that follows from the decision of foreign firms to invest in Mexican states. We minimize potential concerns about reverse causation by measuring inequality in 1990, four years before our first available measure of FDI. We then gauge the effects of FDI flows on income inequality in 2000.
What are our predictions about the impact of FDI on income inequality in Mexico? As argued before, the relevant literature has explored the differential between skilled and unskilled labor as one causal mechanism linking FDI to inequality. Feenstra and Hanson find that FDI increased the relative demand for skilled workers and was a driver of income inequality from 1975–88.29
Feenstra and Hanson 1997.
Aitken, Harrison, and Lipsey 1996.
Hanson 2005a.
While these studies provide important findings, they focus on explaining the widening gap between skilled and unskilled labor. Our article is concerned with the broader question of how FDI affects income inequality, which is also driven by the relative returns to capital and labor, along with wage differentials within the broad categories of skilled and unskilled labor. This is not a minor point. The relative scarcity of skilled workers in Mexico makes us skeptical about the impact of changing skilled-labor wages on patterns of income inequality. According to the 2000 International Labour Organization (ILO) survey of Mexico, a little more than 6 percent of workers in the country are classified as professional or technical workers.32
López-Acevedo, Tinajero, and Rubio 2005 analyze firm-level 2001 data for Mexico and find that 71 percent of employees had no more than lower secondary school education.
A secondary issue is that most research focuses on the wage differences between low-skilled and high-skilled workers. One of the motivations for attracting FDI is for the prospects of skill upgrading. We can imagine a situation where a widening wage difference between skilled and unskilled labor could still lead to a leveling of income inequality if some of the unskilled workers become skilled workers.
We believe instead that the major impact of MNCs will be similar to what Stolper and Samuelson would predict.34
Stolper and Samuelson 1941.
If workers were perfectly mobile within Mexico, we would expect national wages for low- and semi-skilled workers to increase, leading to a leveling of income inequality across the whole country. Yet, as we know, workers are never perfectly mobile even in the most advanced industrialized economies. In Mexico, there is evidence that the lower skilled are significantly less mobile both internally (between-states migration) and externally (migration to the United States).35
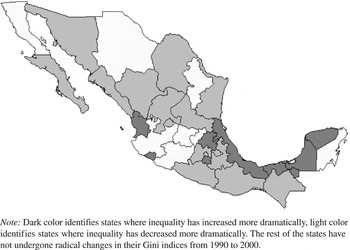
If workers are imperfectly mobile, regional wage differences can arise in relation to the location of foreign firms. Thus, we believe that the major impact of FDI in Mexico is a changing pattern of income inequality within regions in Mexico. In the states with the most FDI, largely determined by geography, we expect a decrease in levels of income inequality relative to the states with least FDI. Figure 3 provides a first glimpse at the changing patterns of income inequality from 1990 to 2000. Note that although some states along the U.S. border have seen improvements in the distribution of income, it is by no means obvious that FDI (as portrayed in Figure 2) is driving the process.
Territorial distribution of changes in state Gini indices, 1990–2000
Income Inequality and Foreign Direct Investment Data
To test our claim that FDI improves income distribution, we must construct subnational measures of income inequality and FDI. In this section, we operationalize FDI and state-level inequality. The income inequality indices are based on information from the 1990 and 2000 Mexican national census; census data are publicly available through the Instituto Nacional de Estadística, Geografía e Informática (INEGI).36
See 〈www.inegi.gob.mx〉. Accessed 16 March 2007.
INEGI aggregates the census information at the municipal level and posts frequencies by income group for the purpose of public dissemination. The data may consider a family to be rich if it reports high income without consideration of family size. Since poorer, rural families tend to be larger, the extent of income inequality is underestimated; see Cortés 2003, 142. A more appropriate measure should consider per capita income, but even INEGI routinely reports inequality figures that are not corrected by family size, see Cortés and Rubalcava 1995; and Cortés 2003.
To measure the amount of FDI at the state level, we draw on two data sources. Patricio Aroca Gonzalez generously provided his data on state-level FDI, which we have updated with information from the Dirección General de Inversión Extranjera of the Mexican Ministry of the Economy.39
Data are available at 〈http://www.economia.gob.mx/?P=1178〉, accessed 16 March 2007.
Aroca Gonzalez and Maloney 2005.
FDI data are not available at the state level prior to 1993. Given that the bulk of FDI entered the Mexican economy after the implementation of NAFTA, we do not have reason to believe that this will bias our results.
Empirical Results
To explore the relationship between FDI and the distribution of income, we first estimate a cross-sectional ordinary least squares (OLS) regression to estimate the impact of inflows of FDI in the thirty-two Mexican states on levels of income inequality. Using the OLS results as a benchmark, we then estimate an instrumental variable two-stage least squares (IV-2SLS) regression model of the following form:


Thus, we model the level of income inequality in each Mexican state in 2000 as a function of the level of income inequality in 1990, per capita gross state product in 1990, and an instrument for (log) average FDI inflows from 1993–2000 (FDI1993–2000*), namely, fitted values of a regression of FDI on excluded instruments—distance to the border and education (average years of schooling)—and all other second-stage independent variables as included instruments.42
Strictly speaking, the dependent variable is bounded above (1) and below (0). However, the cross-state distribution of the Gini indices is unimodal, and even the maximum (0.58) and minimum (0.41) values are so far from the theoretical bounds that we are comfortable modeling E(Y|X) as a linear function of effect parameters, as in OLS or 2SLS.
Baum, Schaffer, and Stillman 2003.
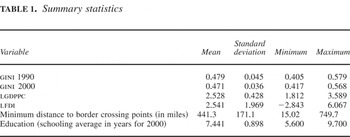
Summary statistics

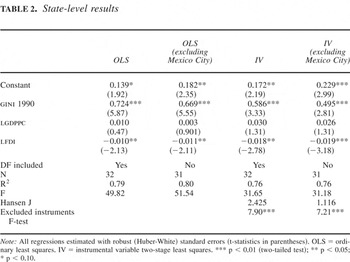
We present our models based on state-level data in Table 2. Column (1) of the table suggests that increased levels of FDI are associated with a decrease in income inequality in an OLS model. As argued earlier, many MNCs register their operations in Mexico City, although their production operations are located near the border. As a check on the robustness of our results, we estimate the impact of FDI inflows on income inequality in column (2) of the table, dropping Mexico City. Our substantive results remain unchanged.
State-level results

As highlighted earlier, FDI flows may be endogenous, making the OLS estimates inefficient, biased, and inconsistent. Foreign investors may select production locations based on factors such as the quality of infrastructure or prevailing state-level wages. To mitigate these endogeneity concerns, we present in column (3) of Table 2 the results of an IV-2SLS regression using the minimum distance from one of the six major border crossings and the total number of years of education as instruments for FDI. IV regressions have become relatively common in political science, but it is important to note that this method is not a panacea for solving issues of endogeneity. For our instrument to be valid, the minimum distance to the U.S. border crossing and the level of education must be correlated with FDI inflows, and they must not be correlated with the error term in equation (1). For our IV specifications, we include F-tests for excluded instruments and tests of overidentification using Hansen's J-statistic. In our IV estimates, the F-test for excluded instruments is statistically significant at the 0.01 level, indicating that we have valid instruments for the level of FDI inflows. Also, Hansen's J-statistic is not statistically significant at even the 0.1 level, indicating that we cannot reject the null that our regressions are appropriately overidentified.44
Ibid.
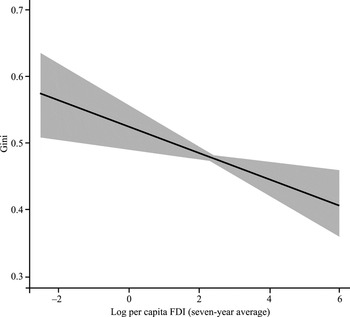
The results of the IV regressions, both including and excluding Mexico City, are similar to the OLS regressions, although the magnitude of the impact is substantially increased when compared to the OLS benchmark results. The impact of FDI on income inequality is negative, meaning that exposure to FDI leads to decreasing levels of income inequality. Based on coefficients from the IV-2SLS specification, we find that a two standard deviation increase in FDI leads to a 2.4 standard deviation decrease in income inequality from 1990 to 2000. Figure 4 illustrates uncertainty regarding the effect of FDI on income inequality by displaying a 95 percent confidence interval around expected values. Despite large estimation uncertainty caused by a relatively small set of observations (thirty-two states), we still find that increases in FDI are associated with large reductions in levels of income inequality, all else constant.

Expected Gini index conditional on per capita FDI (95% confidence interval)
Although our study focuses on whether or not FDI affects the distribution of income, it is important to consider the causal mechanism linking FDI and income inequality. One possible explanation is that FDI has led to a collapse in the incomes of domestic capital in the border states, essentially leveling income inequality by reducing the income of individuals at the higher end of the income distribution. Yet, Hanson finds that it is the states with low exposure to FDI where the incomes of workers fell by 10 percent and wage poverty increased 7 percent relative to high FDI states after the Mexican peso crisis.45
Hanson 2005a.
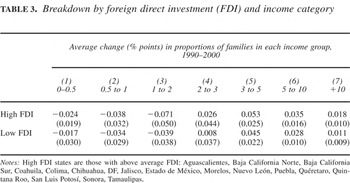
Though we cannot speak directly to the issue of income differentials between 1990 and 2000, our data allow us to compare growth in the number of families in different income categories. Table 3 offers a breakdown of change in the percentage of families within each or our seven income categories in high and low FDI states. First, it does not seem to be the case that diminished inequality is driven by a collapse in the number of families at the upper end of the income distribution. Second, both types of states show increases in the number of families at the upper tail of the distribution and decreases in the lower categories. However, decreases in the number of poor families and increases in the number of well-off families seem to be more pronounced among high FDI states. We caution the reader that in our small sample only the numbers in income category (3) (that is, those reporting income of one to two minimum wages) are statistically different across FDI categories at the 95 percent level. Though we cannot confirm which mechanism is most important in tying FDI to diminished income inequality, evidence is consistent with the claim that unskilled workers are benefiting the most from increased FDI, at least if we consider that unskilled workers are more common in category (3). We believe this evidence, specifically in the context of a natural experiment, illustrates that FDI flows can lead to an increase in the incomes of workers and a leveling of income inequality within states.
Breakdown by foreign direct investment (FDI) and income category

Conclusions
In this article we explore the relationship between inflows of foreign direct investment and changing patterns of income inequality in Mexico from 1990–2000. Using geographic proximity to major border crossings with the United States as an instrument for FDI, we find that inflows of FDI into Mexican states are associated with a leveling of incomes at the state level.
These results provide new insights and possible directions for future research. The existing studies on the link between globalization and income inequality have focused on the impact of trade and investment on country-level measures of income inequality. We argue that these studies suffer from serious econometric problems. Other studies have discussed rising income inequality across regions. For example, scholars studying China lament the increasing income inequality within that country, partially attributed to dynamic income growth in the eastern provinces and the lagging performance of the western and central provinces.
Yet, these studies are limited in their ability to answer the question of how globalization influences these patterns of income inequality. In this project we find that inflows of FDI into a state lead to a leveling of income inequality within the state. This is not to say that Mexico is becoming a more egalitarian society; many scholars have stressed that the peso crisis led to a further increase in Mexico's already high levels of income inequality. More importantly, diminished within-state inequality produced by FDI may actually increase national levels of inequality. This could occur if states that attract FDI not only become more equal, but also more prosperous, as is likely to be the case. The spread of the national distribution of income could become even wider as Mexican states converge on two different “clubs”: one comprising mostly poor and still extremely unequal states, the other one including more prosperous and more egalitarian states. In fact, in the 2006 presidential election, sixteen states in the prosperous north overwhelmingly favored a candidate that espoused adherence to markets and promised further internationalization of the Mexican economy, whereas sixteen states in the poorer south supported a candidate that underscored redistribution and protection from the vagaries of the marketplace.
National-level studies have often linked globalization to increasing income inequality by suggesting that openness increases demand (and returns) to high-skilled labor relative to low-skilled labor. We find this mechanism to be an unlikely candidate for explaining broad changes in the level of income inequality. This explanation is implausible in our study of Mexico because we find that when a MNC invests in a state, the income distribution becomes flatter within that state. We speculate that this effect occurs through a localized increased demand for labor relative to that of capital. Globalization could have complex effects on the distribution of income within a country, yet we find that flows of FDI can also be associated with a reduction of income inequality for less-developed countries.