I. INTRODUCTION
Nanomaterials are intrinsically characterized by a large ratio of surface-to-bulk atoms. This modifies many basic materials properties. The most notable difference in the example from the conventional bulk properties is probably the depression of the melting temperature relative to the bulk counterparts. Because melting is one of the most important phase transformations, extensive experimental and theoretical investigations along with computer simulations have been performed to understand the effect of the size shrinkage on the modifications of the thermodynamic properties. Reference Qi1–Reference Borel3 Most of the theoretical models of nanocrystal melting assume a spherical shape and yield a linear relation of the melting point with the reciprocal of the particle size. Reference Lai, Guo, Petrova, Ramanath and Allen4–Reference Mei and Lu6
However, the shape of nanocrystals can also affect the melting behavior because the surface-to-volume ratio is shape dependent. The understanding of the melting behaviors of nanomaterials with some unique and practically important geometries is much less compared to the spherical shape. One-dimensional nanostructures are building blocks for nanoscale integration. Reference Xia, Yang, Sun, Wu, Mayers, Gates, Yin, Kim and Yan7,Reference Davami, Weathers, Kheirabi, Mortazavi, Pettes, Shi, Lee and Meyyappan8 Particularly, employing nanowires as the interconnection or joints for nanoscale electronics necessitates understanding of the thermal stability as well as the melting behavior, which is essential to generate good metallurgical bonding and reliable nanowire interconnects. Reference Shaygan, Gemming, Bezugly, Cuniberti, Lee and Meyyappan9
As an essential part of nanoscale joining, different kinds of solder nanowires, such as Sn, In, or metal alloys, have been fabricated using an electrodeposition approach. Reference Gu, Ye, Smirnova, Small and Gracias10–Reference Yin, Gao, Gu, Stach and Zhou12 Such lead-free (Pb-free) nanosolders hold tremendous potential as a viable solution for replacing traditional tin/lead (Sn/Pb) solders, which have toxic properties and may be harmful to health and the environment. Pb-free nanosolders also offer exceptional opportunities for making nanoscale contacts as needed with the miniaturization of devices as well as the production of nanoscale circuits. The melting behavior of these one-dimensional Pb-free solders is one of the most important considerations for the practical applications of the nanosolders. Although the melting of Sn has been investigated extensively, almost all the previous studies have been dealt with the material with the bulk form or nanoparticles (e.g., a spherical shape). The melting behavior for nanowires may differ significantly from that for bulk materials or nanoparticles because of geometrical effects. Specifically, there is a lack of understanding of how the melting of the nanowires depends on the length/diameter ratio, which is important for the application of nanowire-based solders by controlling the diameter and length of the nanowires for nanoscale joining and integration.
In situ transmission electron microscopy (TEM) is an ideal tool to study the melting behavior of individual nanowires. Particularly, in situ TEM visualization of the morphological evolution of nanowires can provide unique insight by quantitatively measuring the size, shape, and length of the nanowires during melting. In this work, we perform a systematic in situ TEM study of the melting behavior of Sn nanowires with different length/diameter aspect ratios in conjunction with scanning electron microscopy (SEM) observations of the overall morphology of Sn nanowires under different melting treatments. We demonstrate that the melting of long Sn nanowires results in the Rayleigh instability for which the nanowires are fragmented into nanoparticles, while for short nanowires (e.g., nanorods) such instability is suppressed and their melting results in isometric or spherical particles.
II. EXPERIMENTAL
Single crystalline tin (Sn) nanorods are synthesized by a one-pot chemical reduction method assisted by sodium dodecyl sulfate surfactant. Reference Cui, Rajathurai, Jia, Li, Gao, Lei and Gu13 Sn nanowires are fabricated by room-temperature electrodeposition assisted with polycarbonate nanoporous membrane templates (Whatman). The Sn layer is electroplated by a commercial Sn plating electrolyte (Sn concentrate with make-up solutions, Technic, Inc.) with the current controlled at 18 mA/cm2. After the electroplating, the polycarbonate membrane is dissolved in dichloromethane to release the nanowires into the solvent. The as-prepared Sn nanorods and nanowires are kept as a suspension in ethanol. TEM samples are prepared by the powder sample preparation method with ultrasonic dispersion followed with drop casting onto a carbon film supported by a TEM Mo grid purchased from Ted Pella, which is then mounted onto a Gatan heating holder (Model 652-Ta double tilt) with the rapid heating capability using a Gatan hot-stage temperature controller. The uncertainty of the temperature measurements for the Gatan TEM heating holder is ±15 °C. Ex situ melting measurement is carried out in a Lindberg Blue M tube furnace by placing dried nanowire samples on a piece of silicon, and the temperature is measured by a thermocouple that is in direct contact with the sample inside the furnace. In situ TEM observations of the Sn melting are performed using a JEM2100F TEM (JEOL Ltd., Peabody, Massachusetts) operated at 200 kV.
III. RESULTS AND DISCUSSION
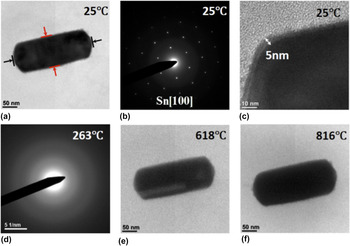
Figure 1(a) shows bright-field (BF) TEM images of a typical Sn nanorod at room temperature. The nanorod has a length/width aspect ratio of ∼2.50. The Sn nanorod has a single crystalline body-centered tetragonal structure, known as β-Sn, as identified by selected area electron diffraction (SAED) pattern shown in Fig. 1(b). The nanorod is confined by an amorphous layer of the native Sn oxide (SnO x ) with a thickness of ∼5.0 nm, as indicated in Fig. 1(c). The melting of the nanorod is monitored by electron diffraction as the temperature increases. At the melting point, all the diffraction spots disappear and leave only a diffused halo. Reference Sun, Yu, Ng and Meyyappan14,Reference Yu, Sun, Ju, Janes and Meyyappan15 In this way, the melting point of the Sn nanorod can be measured to be 263.0 °C, from the readout temperature of the heating stage controller. The nanorod does not show any appreciable morphological changes after melting at this temperature. Therefore, we further increase the temperature to explore any morphological evolution above the melting point. Figures 1(e) and 1(f) show BF TEM images of the nanorod by slowly increasing temperature above the melting point. The length of the nanorod is measured along the axial direction of the Sn nanorod, as indicated by the black arrows and lines in Fig. 1(a). The diameter of the nanorod is measured along the radial direction of the nanorod, as indicated by the red arrows and lines in Fig. 1(a). The length and diameter of the nanorod before heating are measured as 278.0 nm and 111.4 nm, respectively.
(a) BF image of an as-prepared Sn nanorod at room temperature, (b) SAED of the Sn nanorod at room temperature, (c) a 5 nm-thick native oxide layer (SnO x ) on the surface of the Sn nanorod, (d) a diffuse ring pattern at 263 °C confirms that the Sn nanorod is in its melt state, (e and f) BF images of the Sn nanorod beyond the melting point.

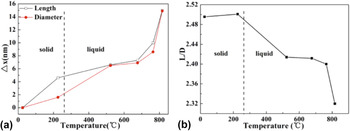
The evolution of the length and width during the melting of the Sn nanorod is measured from the in situ TEM imaging as a function of temperature. Figure 2 shows a plot of Δx with temperature T, where Δx stands for the change in the length and width and Δx = L T − L 0, with L T and L 0 corresponding to the length or width at elevated temperature T and 25 °C, respectively. It shows that the nanorod expands anisotropically before melting, i.e., the nanorod in its solid state expands more along the length direction than the width direction. However, the expansion becomes more isotropical after it is fully melted. It can be also noted from Fig. 2(a) that the expansion becomes significantly more dramatic after raising the temperature above ∼680 °C. Figure 2(b) shows the temporal evolution of the length/width aspect ratio. It shows that the nanorod, upon heating, becomes slightly more elongated because of the anisotropic expansion along the length and width directions before melting. After melting, the amount of the thermal expansion along the width direction catches up with the length direction [Fig. 2(a)] and then becomes isotropic, which results in gradual decrease in the length/width aspect ratio (i.e., the tendency to form a spherical shape).
(a) Expansion of a Sn nanorod along both the axial and radial directions upon heating. The red and black lines indicate the increase in the diameter and length of the nanorod. (b) Decrease of the length/diameter (L/D) ratio of the nanorod with temperature above the melting point.

Because the nanorod has a single crystal structure before melting, the anisotropic expansion in the solid state can be related to different thermal expansion coefficients (TECs) along the length and width directions. Based on the electron diffraction pattern shown in Fig. 1(b), the length direction of the nanorod is along [001] and its width direction is along [010]. Based on the in situ TEM measurements of the length and width evolution of the nanorod, the TECs for the solid Sn along the [001] and [010] directions can be calculated as 8.25 × 10⁻⁵/°C and 7.16 × 10⁻⁵/°C, respectively. These values are within the same order of magnitude of the values reported in the literature. Reference Ravelo and Baskes16,Reference Deshpande and Sirdeshmukh17 The anisotropic thermal expansion of solid tin measured by X-ray diffraction showed the increased expansion coefficients upon the temperature increase. Reference Deshpande and Sirdeshmukh17 The TEC of tin along the [001] direction was reported approximately two times as the TEC of tin along the [010] direction due to the anisotropy of the tetragonal lattice structure along the a and c directions. Reference Deshpande and Sirdeshmukh17,Reference Childs and Weintroub18 The varying TEC with temperature is related to the mosaic imperfection and Schottky defects of the crystal. With increased temperature, the increase in Schottky defect and the lattice expansion contribute to the macroscopic expansion; however, the mosaic blocks adjust the orientation and realign at high temperature, which can result in the decrease of the expansion. Reference Deshpande and Mudholker19 The degree of mosaic imperfection in nanocrystal is less as compared to the bulk counterpart; thus, the measured thermal expansion from one single tin nanorod crystal could be larger than the value measured by the conventional X-ray method. The measured thermal expansion along the c direction is slightly larger than the thermal expansion along the a direction. We believe it is because the native amorphous oxide layer works as a confining tube and suppresses the anisotropic expansion of the solid tin crystal. The thermal expansion becomes more isotropic along the length and width directions after the nanorod is fully melted. By linear regression fitting of the volume of liquid Sn with temperature, we can get the average linear thermal expansion coefficient as 8.87 × 10⁻⁵/°C, which is close to the value reported by V.G. Baryakhtar et al. Reference Baryakhtar, Mikhailova, Ilyinskii, Romanova and Khristenko20 They investigated liquid tin over the temperature range from 300 °C to 1700 °C by X-ray diffraction, and the radial atomic distribution profile showed that the interatomic distance does not increase with temperature. Frenkel et al. used the idea of free volume of “holes” to explain the volume increase or expansion of liquid tin with temperature. Reference Baryakhtar, Mikhailova, Ilyinskii, Romanova and Khristenko20 Upon melting, tin loses its long-range-order and becomes a short-range-order structure, with the distribution of interatomic distances similar to that of the tetragonal structure of solid tin.
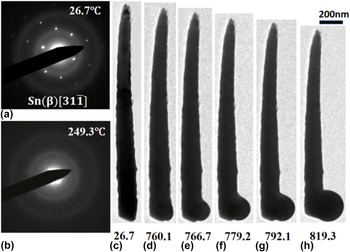
Figure 3 shows in situ electron diffraction patterns and BF TEM images of a Sn nanowire during its heating. The Sn nanowire has a much larger length/width aspect ratio (10.5) as compared to the Sn nanorod shown in Figs. 1 and 2. The electron diffraction pattern [Fig. 3(a)] identifies the single crystalline structure of the as-prepared Sn nanowire. Similarly, electron diffraction is used to monitor the melting of the nanowire during heating. The nanowire retains its initial body-centered tetragonal structure until reaching 249 °C, at which the nanowire becomes fully melted, as confirmed by the diffuse halo electron diffraction pattern shown in Fig. 3(b). The difference in the measured melting temperatures of the nanorod and nanowire is probably due to the uncertainty (±15 °C) in the temperature measurement by the TEM heating holder. The length of the nanowire does not show obvious changes before reaching 760 °C, and then the length of the nanowire starts to decrease appreciably at the higher temperatures due to the liquid mass flow from the fine end of the wire toward the bottom of the nanowire. Different from the nanorod that does not show appreciable morphology changes within the entire temperature range of heating up to ∼820 °C (Fig. 1), significant morphological evolution of the Sn nanowire is observed after heating above 760 °C. As shown in Figs. 3(d)–3(h), a bulge starts to form at the coarse end of the nanowire after heating to 760 °C. The bulge grows with increasing temperature. At 819 °C the bulge evolves to a spherical particle and the rest of the nanowire tends to shrink and collapse into one particle.
(a) SAED pattern of a Sn nanowire at room temperature, (b) the SAED taken at the melting point of the nanowire, (c) BF image of the nanowire before heating, (d–h) the nanowire tends to shrink and collapse into one particle beyond the melting point.

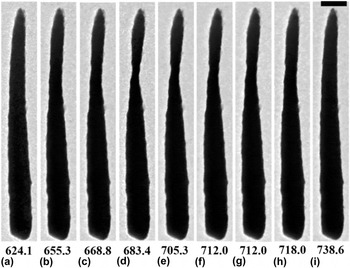
Another phenomenon is observed before bulging occurs at the lower temperature between 650 °C and 730 °C, as shown in Fig. 4. As compared to 624 °C [Fig. 4(a)], the upper part of the nanowire gradually becomes thinner as temperature increases [Figs. 4(b)–4(d)] until it forms a “neck” at 683.4 °C [Fig. 4(d)]. With the further temperature increase, the “necking” does not continue. Instead, the necking process is reversed, thereby gradually recovering the diameter of the nanowire [Figs. 4(e)–4(h)]. The initially necking region disappears around 739 °C [Fig. 4(i)]. The necking process can be attributed to the Rayleigh instability effect, which tends to breakup of a fluid stream into smaller droplets with less surface area to minimize the total surface energy. The varicose perturbation causes the sinusoid formation along the liquid cylinder, and the pressure gradient between the trough and peak region drives the fluid flow from the trough to the peak according to the Young-Laplace equation, resulting in the growth of bulging and necking. Reference Hagedorn, Martys and Douglas21,Reference Molares, Balogh, Cornelius, Neumann and Trautmann22 However with the tubular confinement of the native amorphous oxide layer for the molten liquid Sn in our case, there is compressive stress imposed on the bulging section of the nanowire. This compressive stress works against the pressure gradient of the Rayleigh instability effect and suppresses the flux flow and necking formation, thereby reversing the necking process.
Unstable Necking phenomenon observed above the melting point. (a) Morphology before necking starts to form, (b–d) necking appears and grows narrower with increased temperature and time, (e–i) necking gradually disappears with temperature. The scale bar is 200 nm.

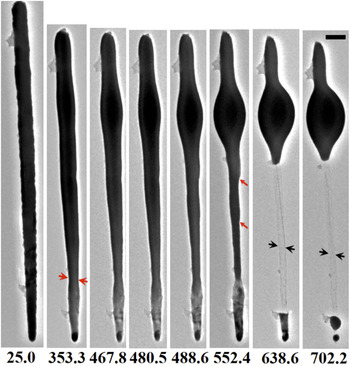
However, the nanowires with larger aspect ratios feature a different melting behavior as shown below. Figure 5 shows a single nanowire with length L ∼3.66 μm, diameter D ∼171.4 nm, and the aspect ratio L/D ∼21.4 at 25 °C. After becoming fully melted, the necking of the nanowire appears at 353 °C near the fine end of the nanowire, as indicated by the red arrow in Fig. 5. The necking continues upon continued temperature ramping, as shown by the morphology snapshot at 467.8 °C, 480.5 °C, 488.6 °C, and 552.4 °C, respectively, in Fig. 5. Simultaneously, bulging appears and grows near the coarse end of the nanowire due to the flow of the molten liquid Sn withdrawn from the rest of the liquid nanowire to the bulge. At 552.4 °C a distinct bulge with an olive shape is present. Perturbations or kinks along the molten wire also appear after melting, as indicated by the red arrows in Fig. 5. With continued temperature increase, the wire abruptly breaks and fragments into two parts at 638.6 °C: one part is located near the top part of the wire with a bulge and the other part is a segment at the fine end of the nanowire. A tube is present between the top and bottom parts of the nanowire, as indicated by the black arrows. The tube wall is the remaining amorphous SnO x after the molten liquid flows upward to form the bulge. When the temperature is further increased to 702.2 °C, it is noticeable that the bulge at the upper part of the nanowire grows bigger and tends to transform to a spherical particle. The segment located at the bottom end of the wire fragments into two spherical particles due to the Rayleigh instability of the liquid stream mentioned earlier.
Morphological evolution of a nanowire heated beyond the melting point. The temperature corresponding to the TEM image sequence is labeled below the images. Necking of the nanowire starts at ∼353.3 °C, as indicated by the red arrows in the images. The neck grows thinner with temperature and breaks the nanowire at 638.6 °C. The scale bar is 200 nm.

Shilyaeva et al. Reference Shilyaeva, Gavrilov and Matyna23 reported that the nanowires confined in the anodic aluminum oxide (AAO) template have decreased melting point with increased diameter, and the melting point of the nanowire is close to the melting temperature of the bulk counterpart when the diameter is larger than 130 nm. Zhou et al. Reference Zhou, Zhou, Pan and Xu24 compared the melting point of Ni nanowires with and without an oxide capping layer from both experimental and theoretical perspectives. For oxide-capped Ni nanowires, the Ni-oxide strengthens the bonds and leads to observed overheating of the nanowire. However, when the diameter of the single crystalline nanowire is larger than 50 nm, the impact of the oxide layer on the melting point is little. Reference Zhou, Zhou, Pan and Xu24 For our experiments, both the Sn nanorods and nanowires are confined in a native oxide layer of SnO x with approximately 5 nm in thickness, and the diameter of both the nanorod and nanowire samples is over 100 nm. The measured melting point is 263 °C for the Sn nanorod [Figs. 1(d)], and 249 °C for the Sn nanowires [Fig. 3(b)]. The difference in the measured melting temperatures of the nanorod and nanowire is probably due to the uncertainty of the TEM heating holder. The melting temperature of the Sn nanorods and nanowires with different aspect ratios is measured by our DSC experiments and confirmed to be very close to the melting point of bulk Sn. Correlation between the melting point suppression and diameter/length aspect ratio for metallic nanowires can be found from the work by Yu et al. Reference Yu, Sun, Ju, Janes and Meyyappan15 Because of the large diameters of the nanowires and nanorods (>100 nm) used in our study, no melting point depression effect was found from our in situ TEM measurements of the melting behavior of the samples. The amorphous oxide functions as a confinement tube after Sn melts. As indicated by the black arrows in Fig. 5, the diameter of the SnO x tube shrinks after the liquid Sn flows away, which implies the relaxation of the compressive stress originally exerted on the liquid Sn and flexible feature of the native SnO x layer with the ability to shrink or expand upon the flow of the liquid Sn.
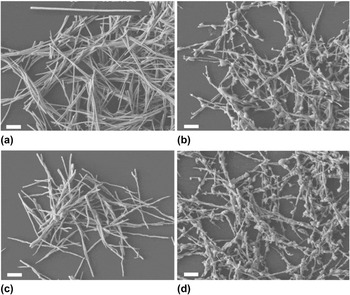
The in situ TEM observation focuses on the melting behavior of individual nanowires, which may not represent sufficient statistical importance. Therefore, the melting behavior of Sn nanowires is also examined ex situ in a large quantity in a furnace with controlled atmosphere. As-prepared free-standing Sn nanowires are distributed on a silicon wafer, as shown by the SEM images in Fig. 6(a). The morphologies of the nanowires after being heated at different temperatures and atmospheres are shown in Figs. 6(b)–6(d), respectively. The nanowires have inhomogeneous diameters along the length with one end thick and the other end thin, as shown by the inset SEM image of a single Sn nanowire in Fig. 6(a). This is caused by the inhomogeneous pore size of the template used for electrodeposition. Most of the as-prepared Sn nanowires are in an intact form, with very few fractured pieces or segments of the nanowires. After heating at 400 °C for 10 min in the flow of N2 gas, substantial bulging appears along the nanowires, as indicated in Fig. 6(b). It indicates that Sn nanowires melt at this temperature and Rayleigh instability sets in, causing perturbation or curviness along the liquid Sn nanowires with a tendency to break into particles. The temperature is lower as compared to the bulging phenomenon observed in TEM experiments. It could be caused by the fact that the TEM experiment was carried out in a vacuum condition (10−5 Pa), which may still contain some residual amount of oxygen that oxidizes the nanowire to form a slightly thicker SnO x layer. The ex situ heating treatment shown in Fig. 6(b) is conducted in a nitrogen atmosphere with the Sn nanowires protected from exposure to oxygen. The oxygen content in the atmosphere can lead to the growth and formation of a thicker native oxide layer on the surface. Figure 6(c) shows the Sn nanowires after heating in air at 800 °C for 10 min. The nanowires maintain their original shape with only slightly lost surface smoothness without bulge formation. Figure 6(d) shows the Sn nanowires after heating in nitrogen atmosphere at 800 °C for 10 min, in which the surface of nanowires becomes very unsmooth with the formation of many bulges. By comparing Fig. 6(c) with Fig. 6(d), it is evident that the atmosphere can significantly affect the melting behavior of Sn nanowires. With the Sn nanowires exposed to air during the heat treatment, the oxide layer of SnO x on the surface grows thicker due to the oxidation of Sn, which serves as a rigid confinement layer to prevent bulge formation. In contrast, the melting of Sn nanowires in the N2 atmosphere results in the formation of a large number of bugles because the thin native SnO x is not sufficiently rigid to confine the flow of liquid Sn, for which the Rayleigh instability effect gives rise to the bulge formation and the fragmentation of the nanowires. The melting behavior observed by the ex situ heating experiments is consistent with the in situ TEM results shown above.
SEM images of Sn nanowires (a) before heating, (b) after heating in nitrogen at 400 °C for 10 min, (c) after heating in air at 800 °C for 10 min, (d) after heating in nitrogen at 800 °C for 10 min. The scale bar is 1 μm.

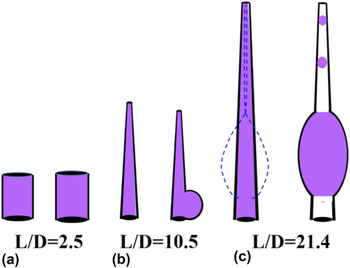
Figure 7 illustrates schematically the melting behavior of Sn nanowires with different aspect ratios. All the nanowires used in this study have inhomogeneous diameters along the length, due to the inhomogeneous pore size of the templates for electrodeposition. We measure the diameter of the coarse end of the each nanowire and take it as the diameter (D) to calculate the aspect ratio L/D. For nanorods (aspect ratio below 10), as illustrated in Fig. 7(a), the molten nanorods expand along both the axial and radial directions upon increasing temperature. However, the aspect ratio of the liquid rod decreases with temperature, indicating a tendency to form a spherical or isometric morphology. This is because the fluid desires to minimize the surface area to minimize the surface energy. For nanowires, the perturbed cylinder has the trough and peak region, and the pressure gradient between those regions drives the fluid flow from the trough to the peak, resulting in the growth of bulging and necking. As for the nanowires with the aspect ratio close to 10.5, as shown in Fig. 7(b), the compressive stress from the surface oxide layer as the confinement outcompetes the pressure gradient favoring necking formation, thus the necking could not exist as a stabilized form and the whole nanowire tends to shrink into one particle to minimize the surface area. However for nanowires with large aspect ratio ∼21.4, as indicated in Fig. 7(c), the necking outcompetes the compressive stress from the confining oxide, and the neck grows until it ruptures and the wire fragments into particles. Such Rayleigh instability effect can be completely suppressed with the growth of a thick SnO x layer by heating the nanowires in air.
Schematic illustrating the melting induced morphological evolution of Sn nanowires with different length/diameter (L/D) aspect ratios. (a) Nanorods maintain the shape with slight dilation along both the axial and radial directions; the nanorod tends to transform into a spherical particle, (b) nanowires with a small aspect ratio; the whole nanowire tends to shrink and form one spherical particle, (c) nanowires with a large aspect ratio ∼21; Rayleigh instability leads to necking, followed by fragmentation of the molten Sn wire into particles.

IV. CONCLUSION
To summarize, the melting behavior of Sn nanowires with different aspect ratios is investigated by in situ TEM. The nanorods and nanowires used for this study have melting point close to that of bulk Sn. For nanorods with a relative small aspect ratio, they expand along both the axial and radial directions with increased temperature with a tendency to form a spherical or isometric morphology. For nanowires with aspect ratio ∼10.5, perturbation along the liquid stream causes an unstable necking phenomenon and the whole wire tends to shrink into a spherical particle. For nanowires with large aspect ratio ∼21, the “neck” grows with time until it ruptures and breaks the wire. The amorphous surface oxide layer serves as a confinement tube and plays an important role in influencing the melting behavior of the Sn nanowires. Thick oxide tube can kinetically suppress the bulging and necking formation in molten Sn nanowires.
ACKNOWLEDGMENTS
This work was supported by the National Science Foundation under NSF Collaborative Research Award Grant CMMI-1233806. Research was carried out in part at the Center for Functional Nanomaterials, Brookhaven National Laboratory, which is supported by the U.S. Department of Energy, Office of Basic Energy Sciences, under Contract No. DE–SC0012704.